In the labyrinth of business performance, the compass of success is frequently guided by a suite of metrics known as Key Performance Indicators (KPIs). Far more than just mere statistics or numbers on a spreadsheet, KPIs serve as the vital lifelines that connect an organization’s vision to its practical, ground-level operations.
These metrics emerge as a beacon in the fog of complexity, highlighting the path to organizational triumph. Just as a heartbeat tells us about the vitality of a living being, KPIs relay the pulsating narrative of a company’s health, accomplishments, and potential for future growth.
Table of Contents
What Is a KPI or Key Performance Indicator?

A Key Performance Indicator, or KPI, is a measurable value that demonstrates how effectively a company, department, team, or individual is achieving their key business objectives. They are employed across various industries and organizations to evaluate their success or progress toward a particular goal over a certain period.
KPIs can be high-level, monitoring the overall performance of a business, or more low-level, focusing on processes or employees in departments such as sales, marketing, HR, or operations. By defining and tracking KPIs, organizations can make informed decisions that help them achieve strategic and operational goals.
KPI Templates
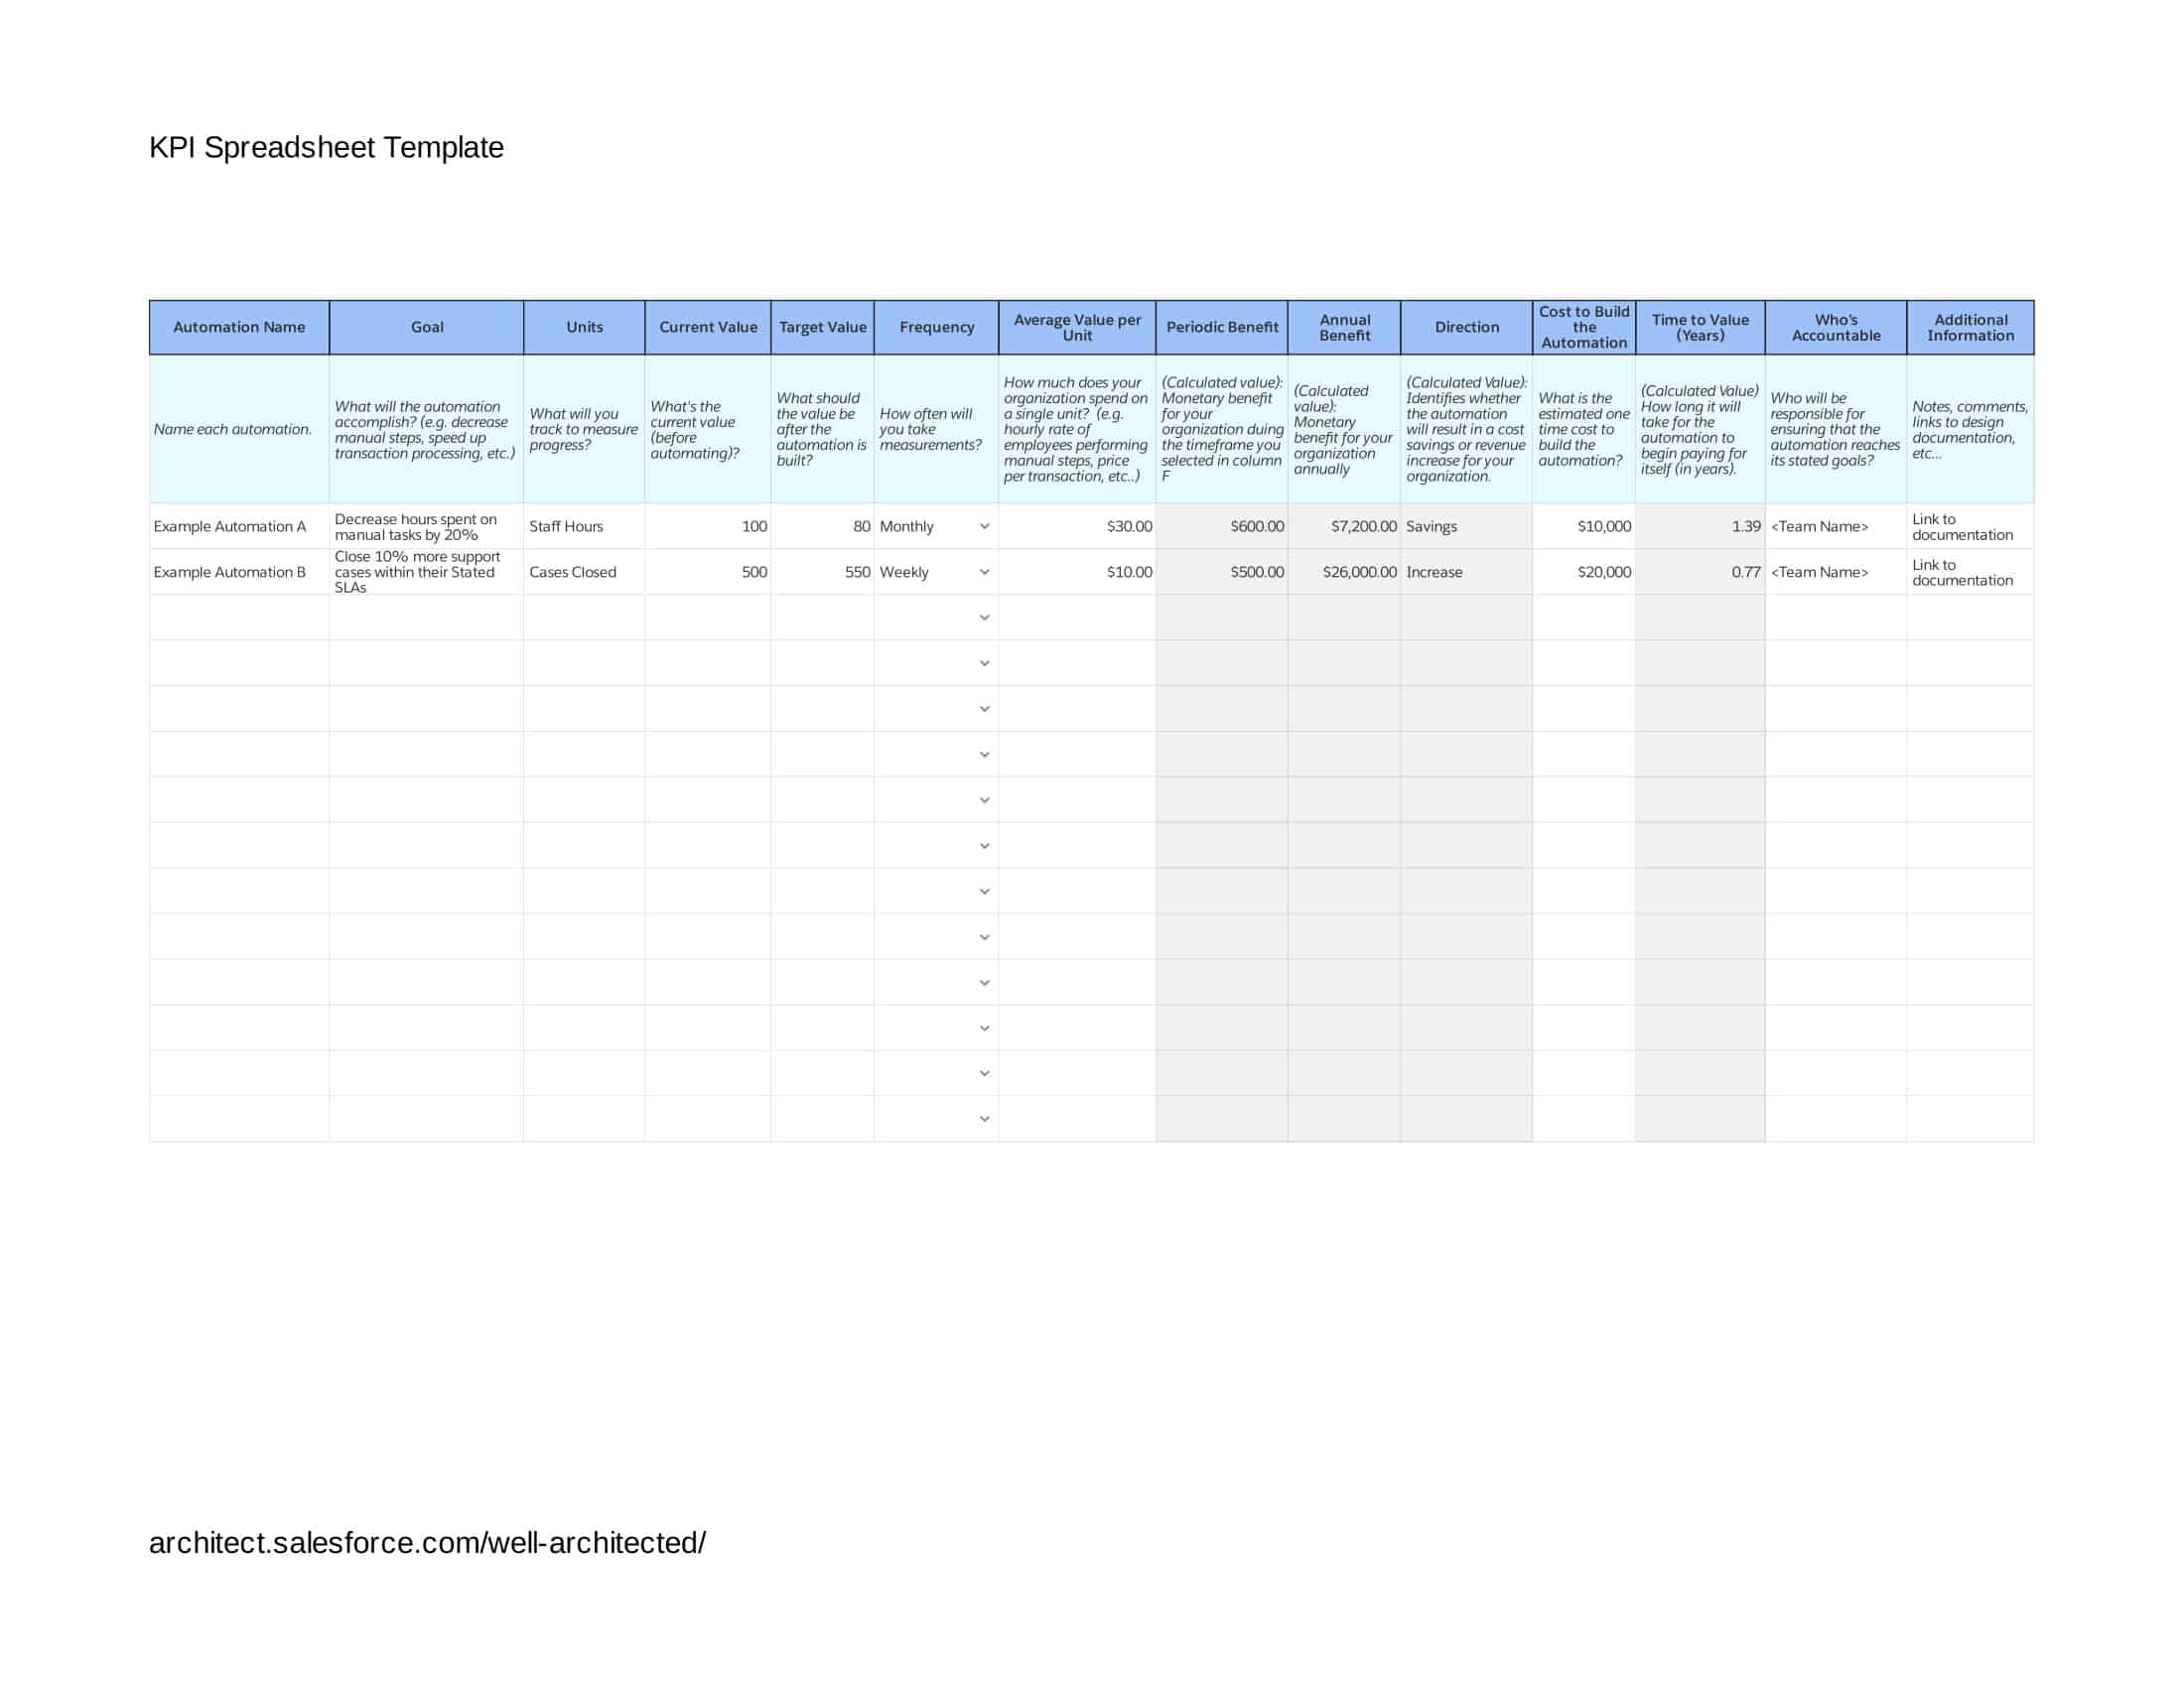
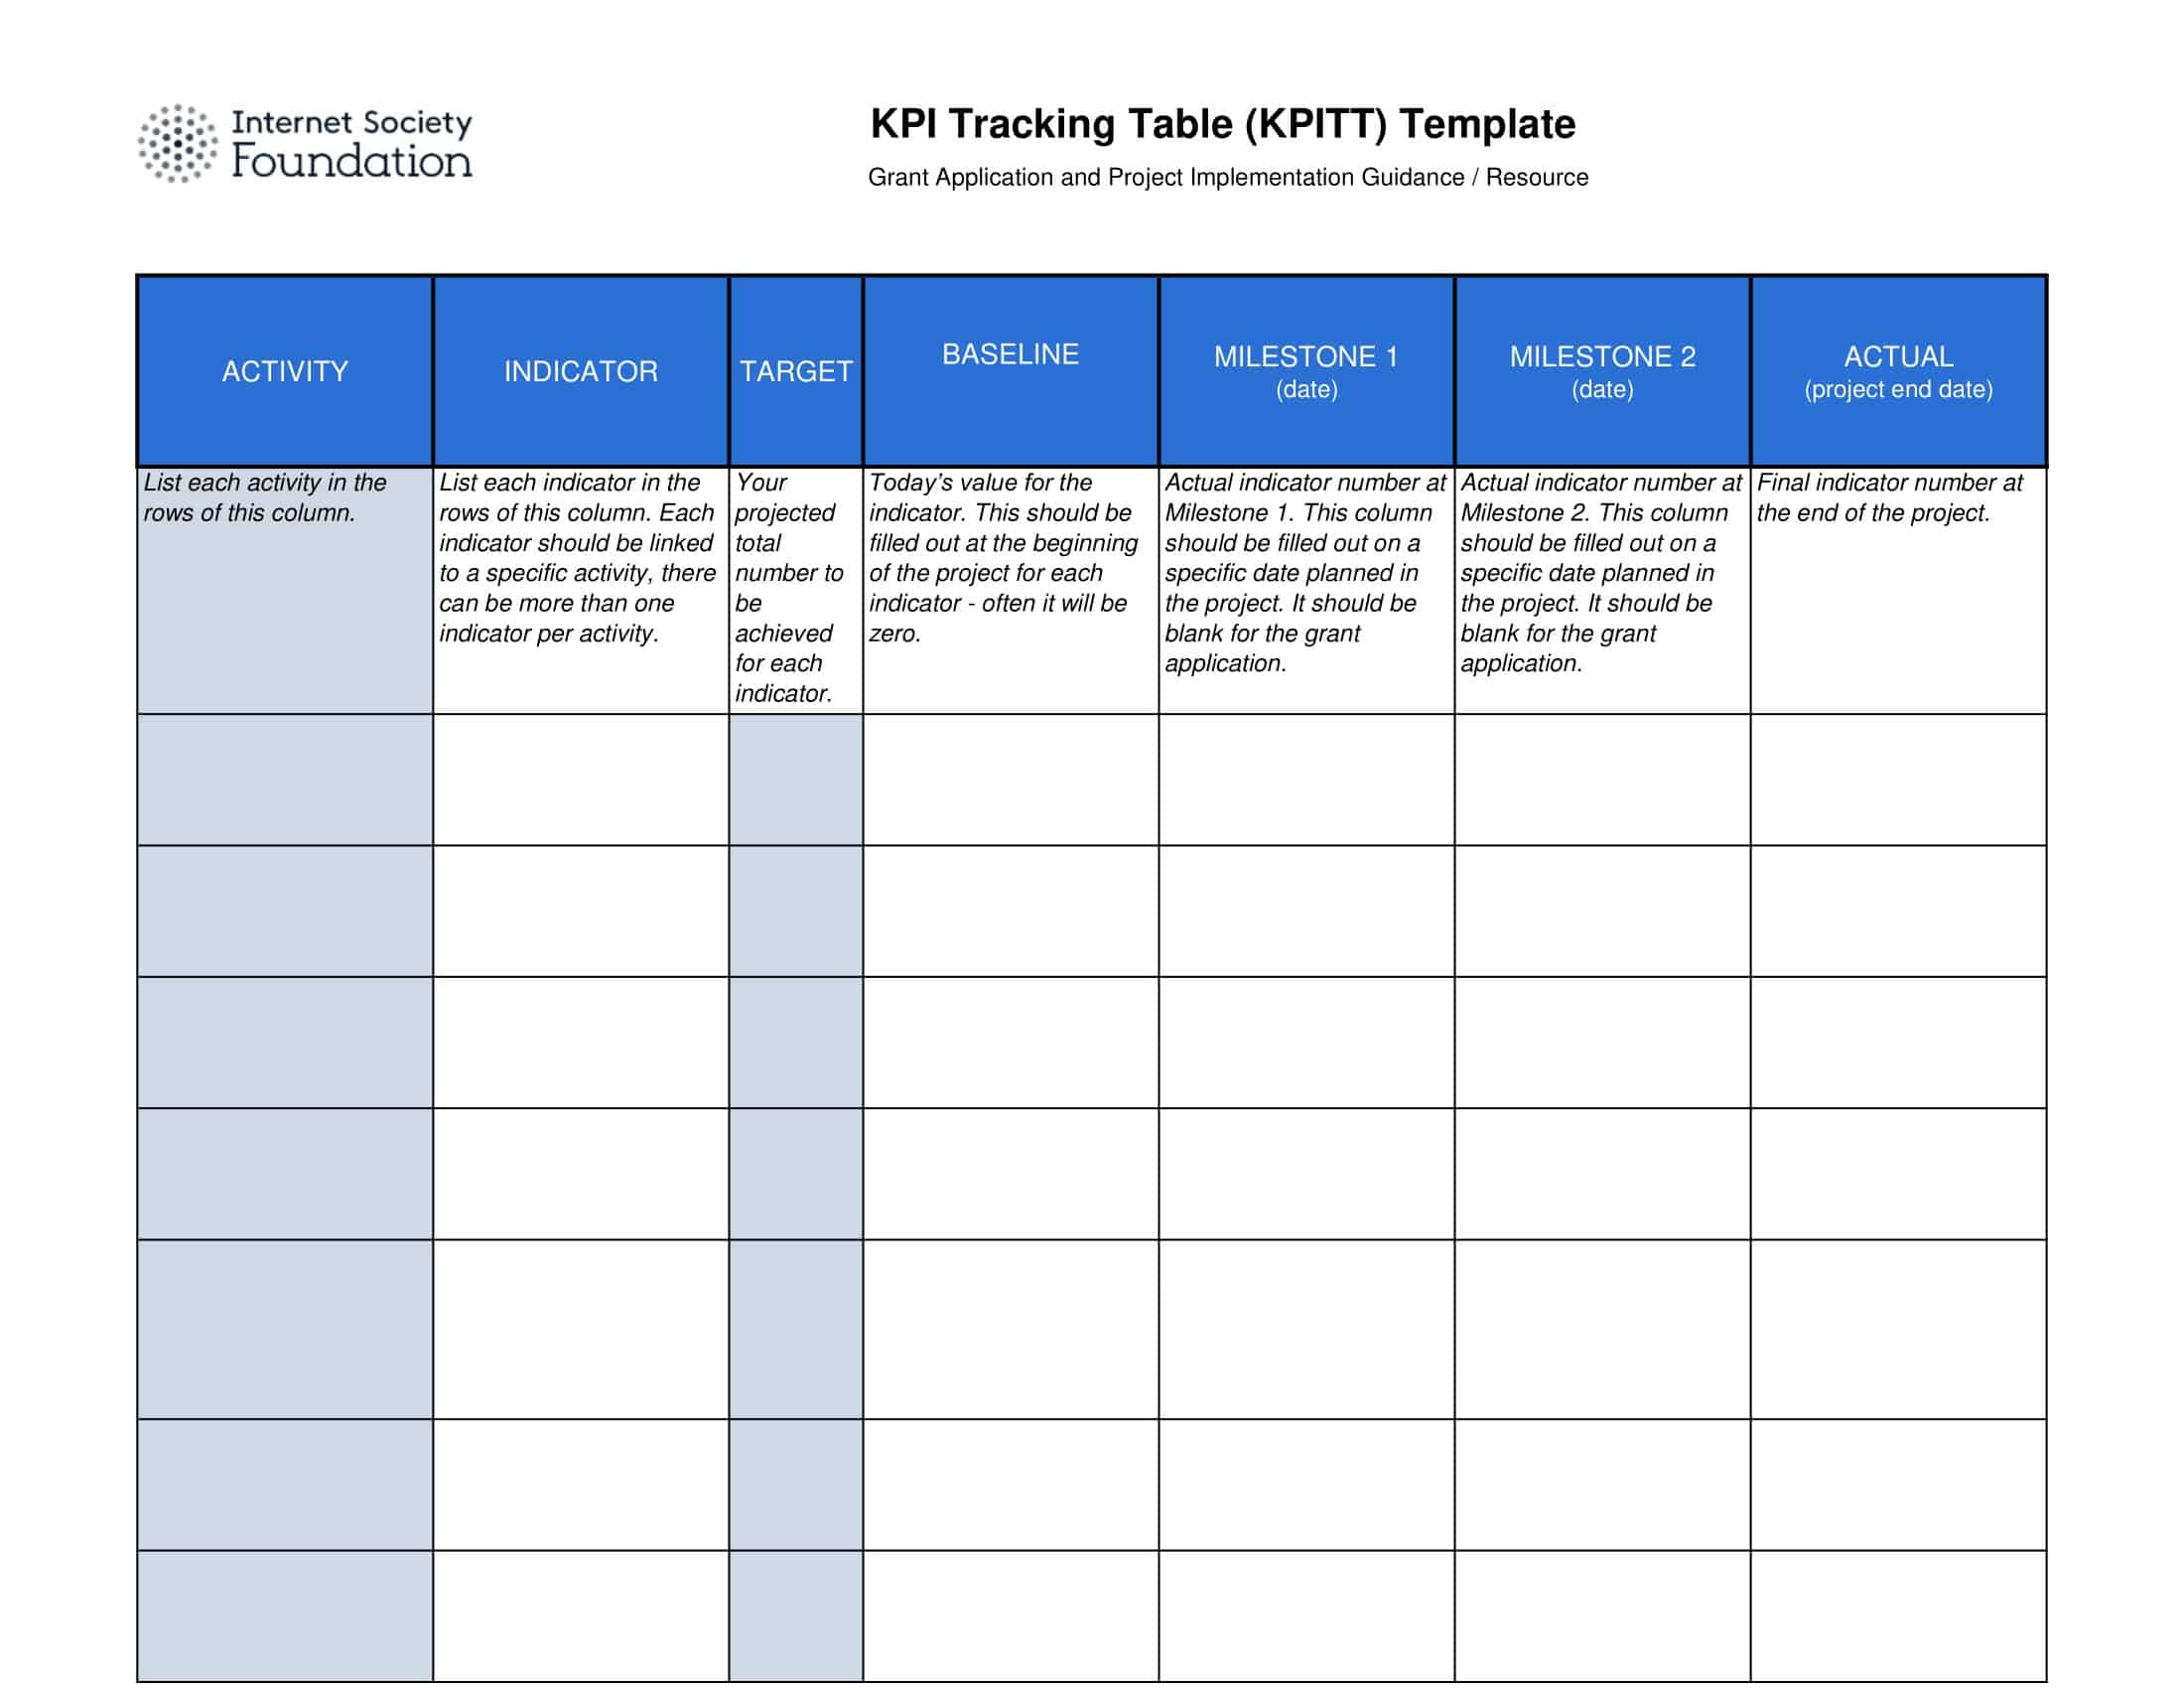
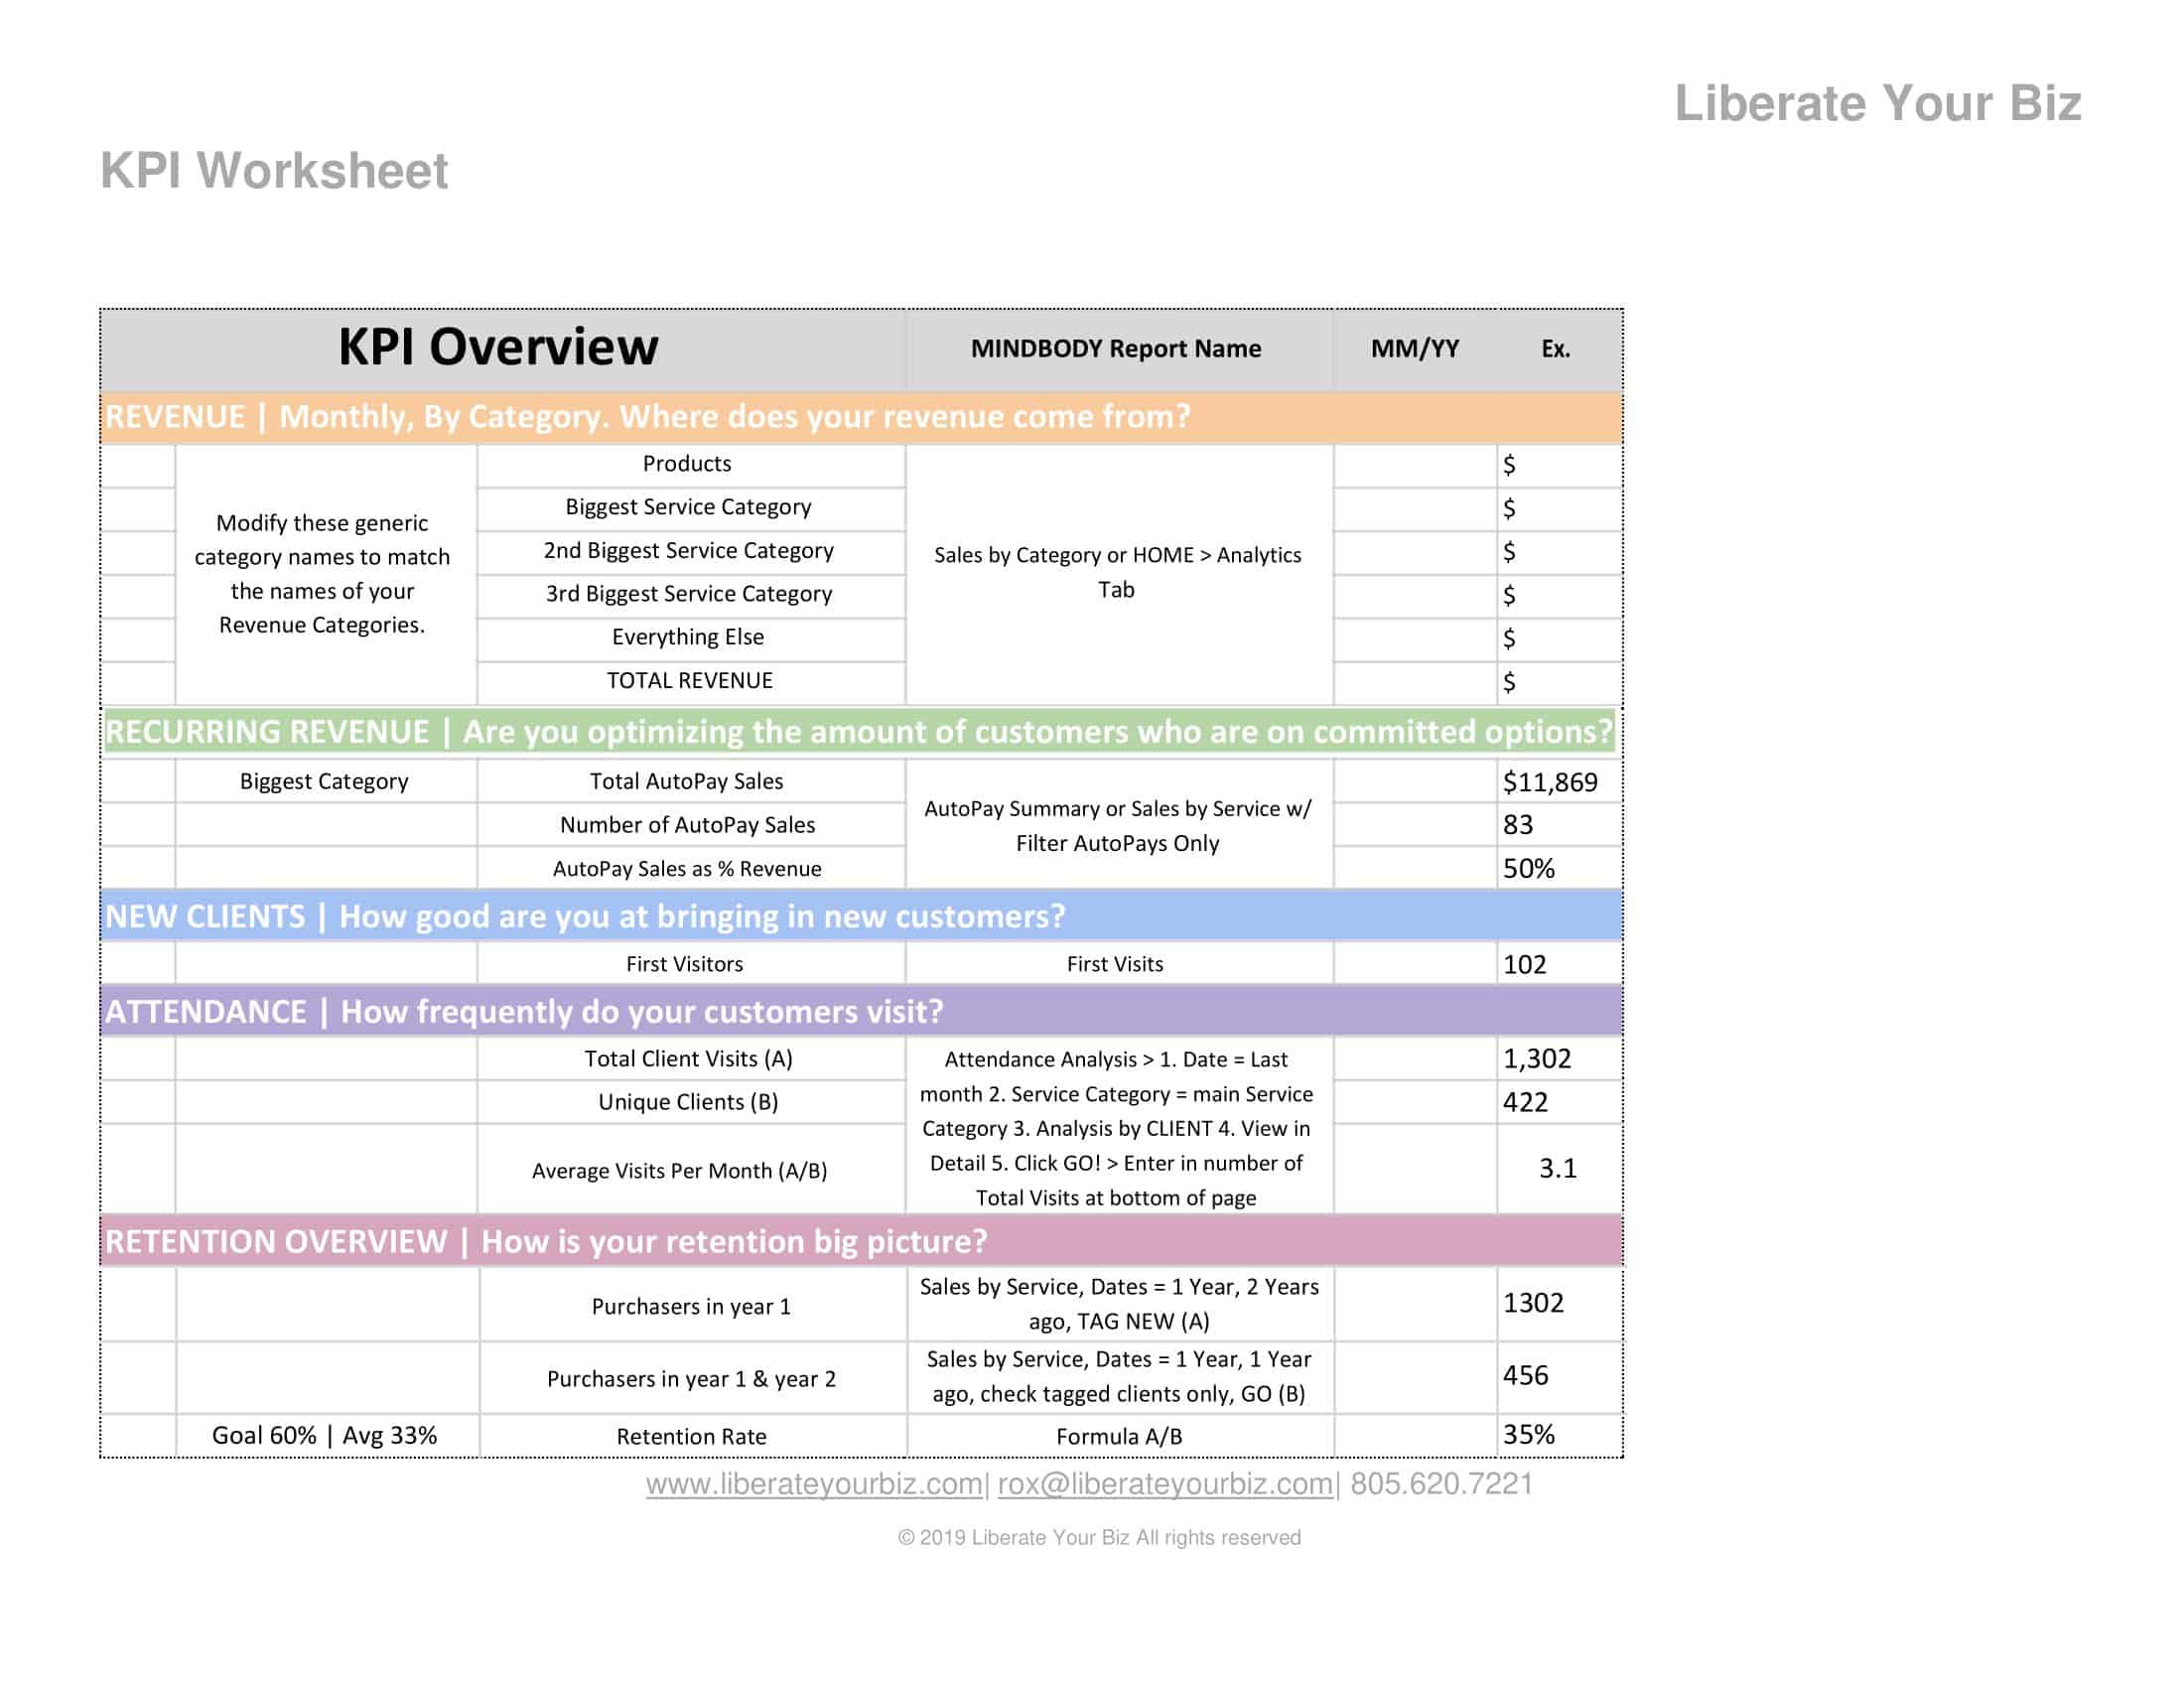
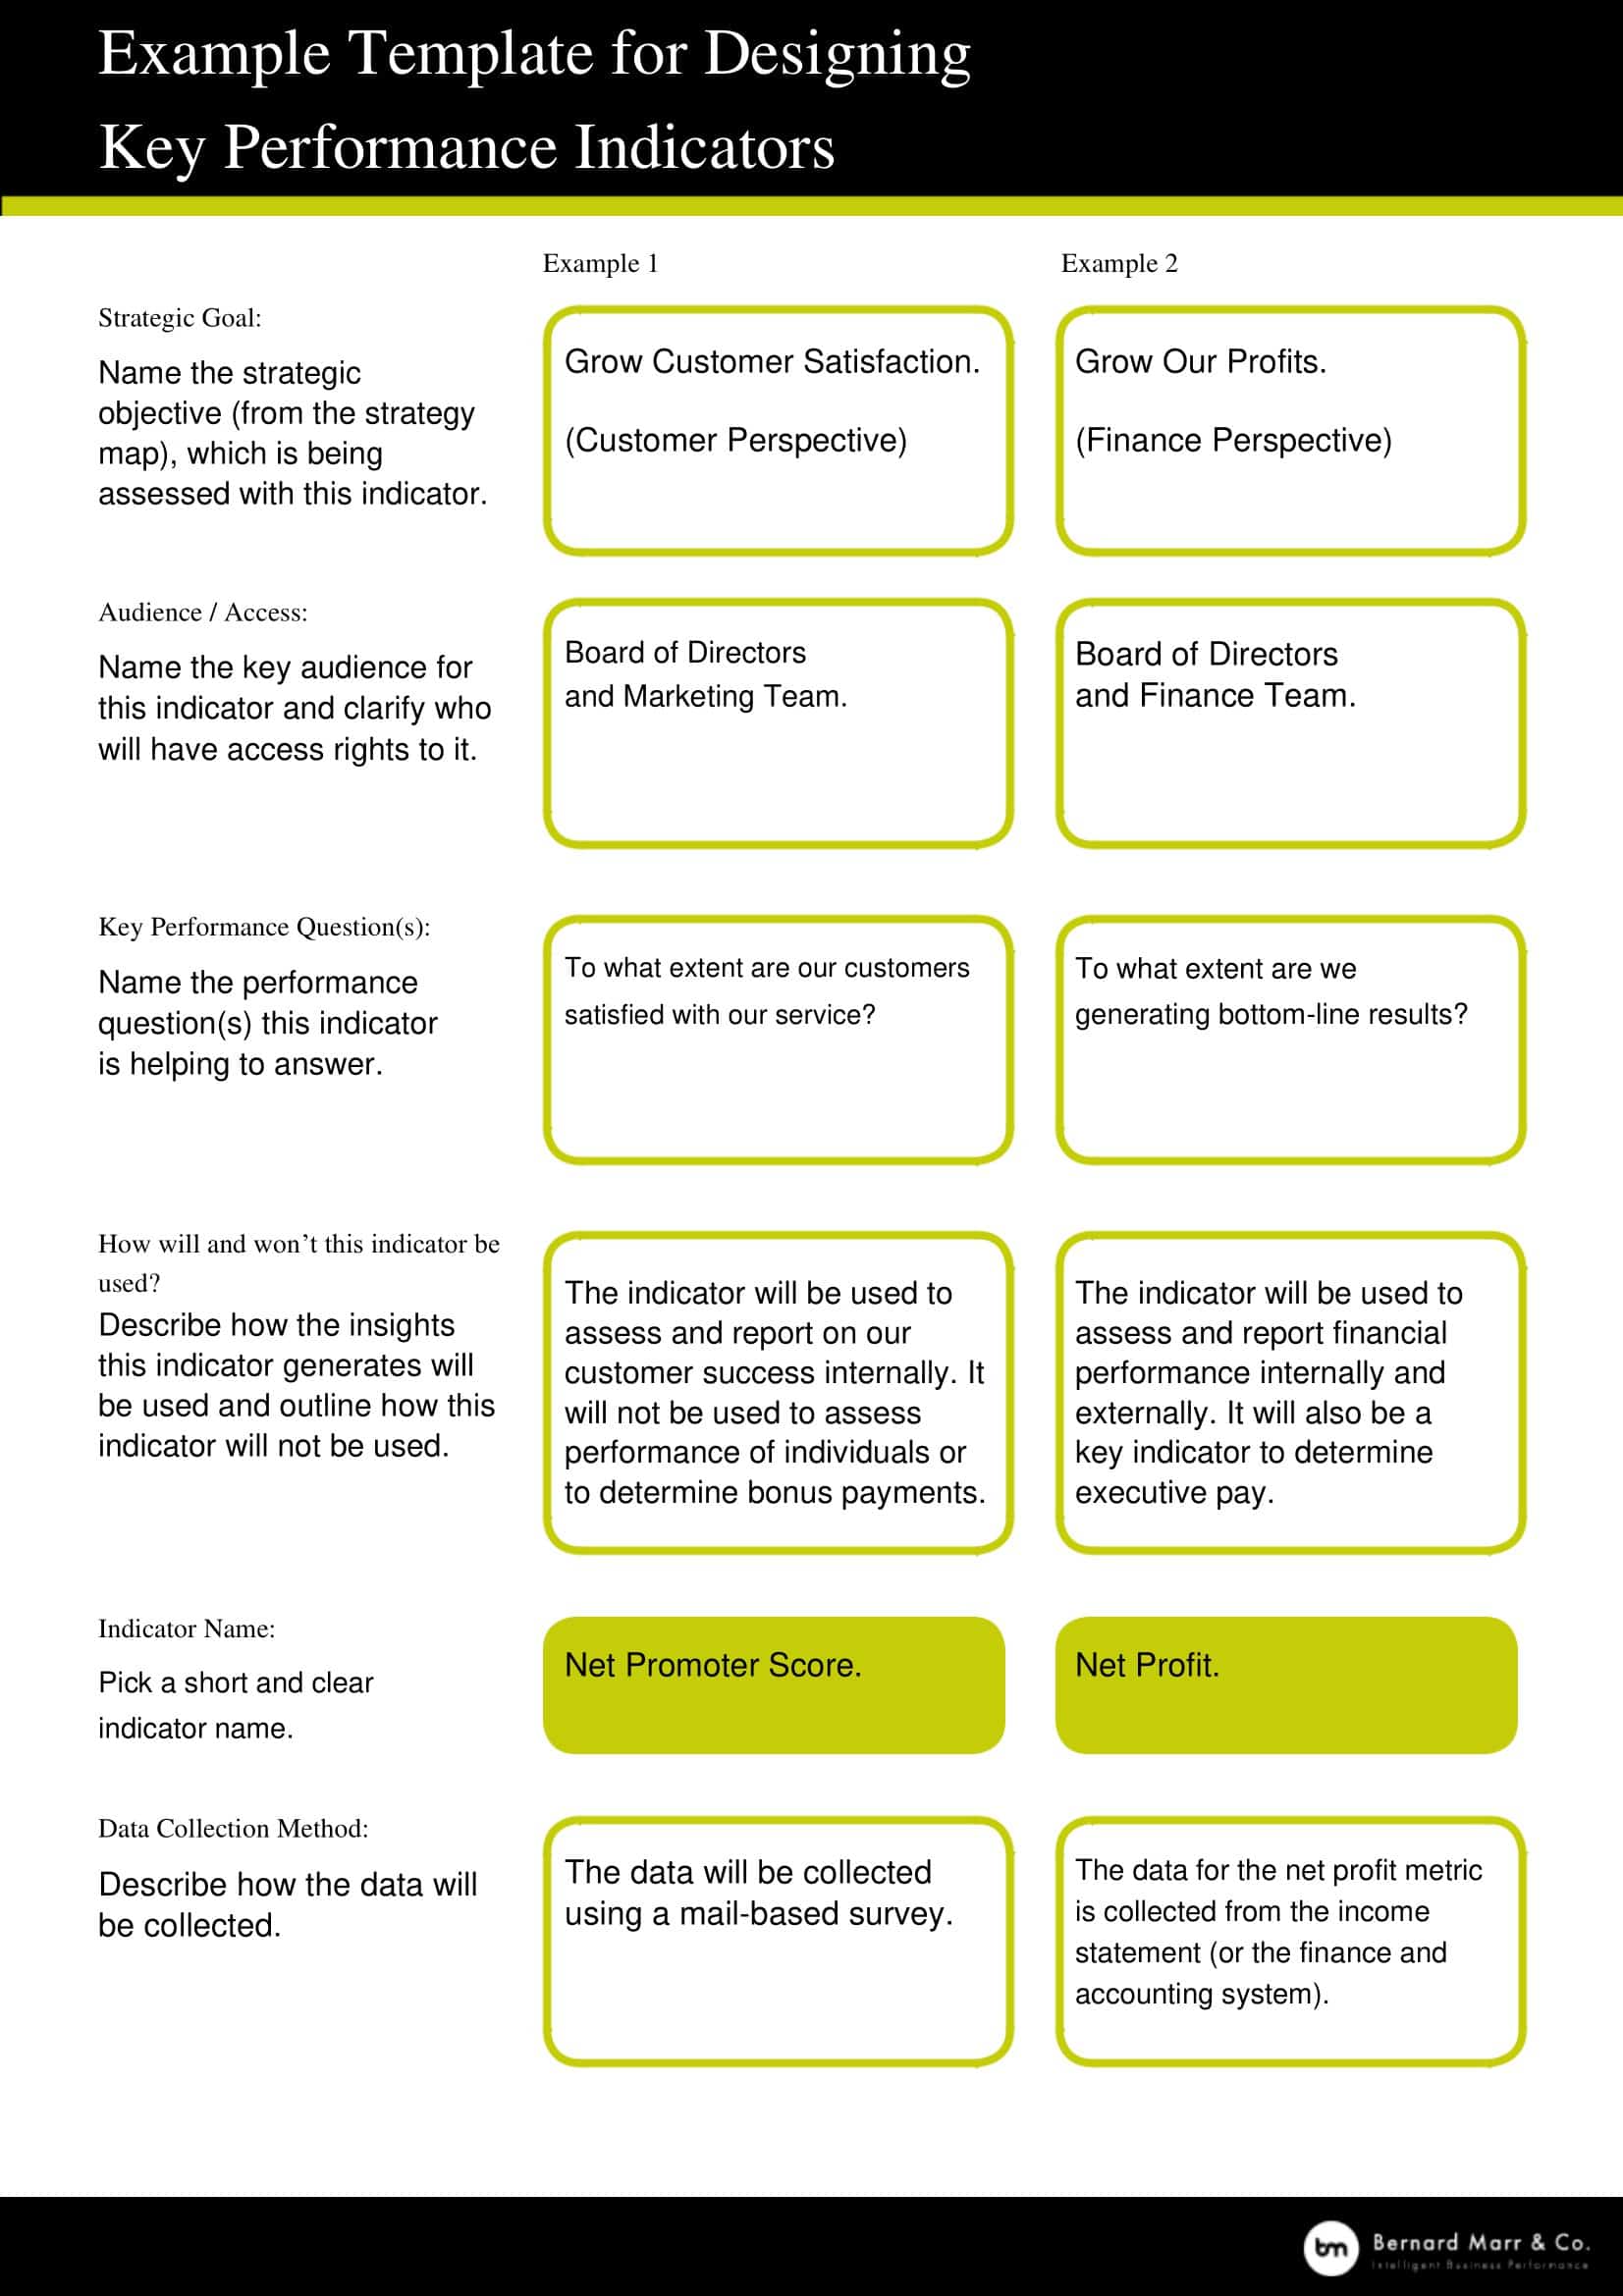
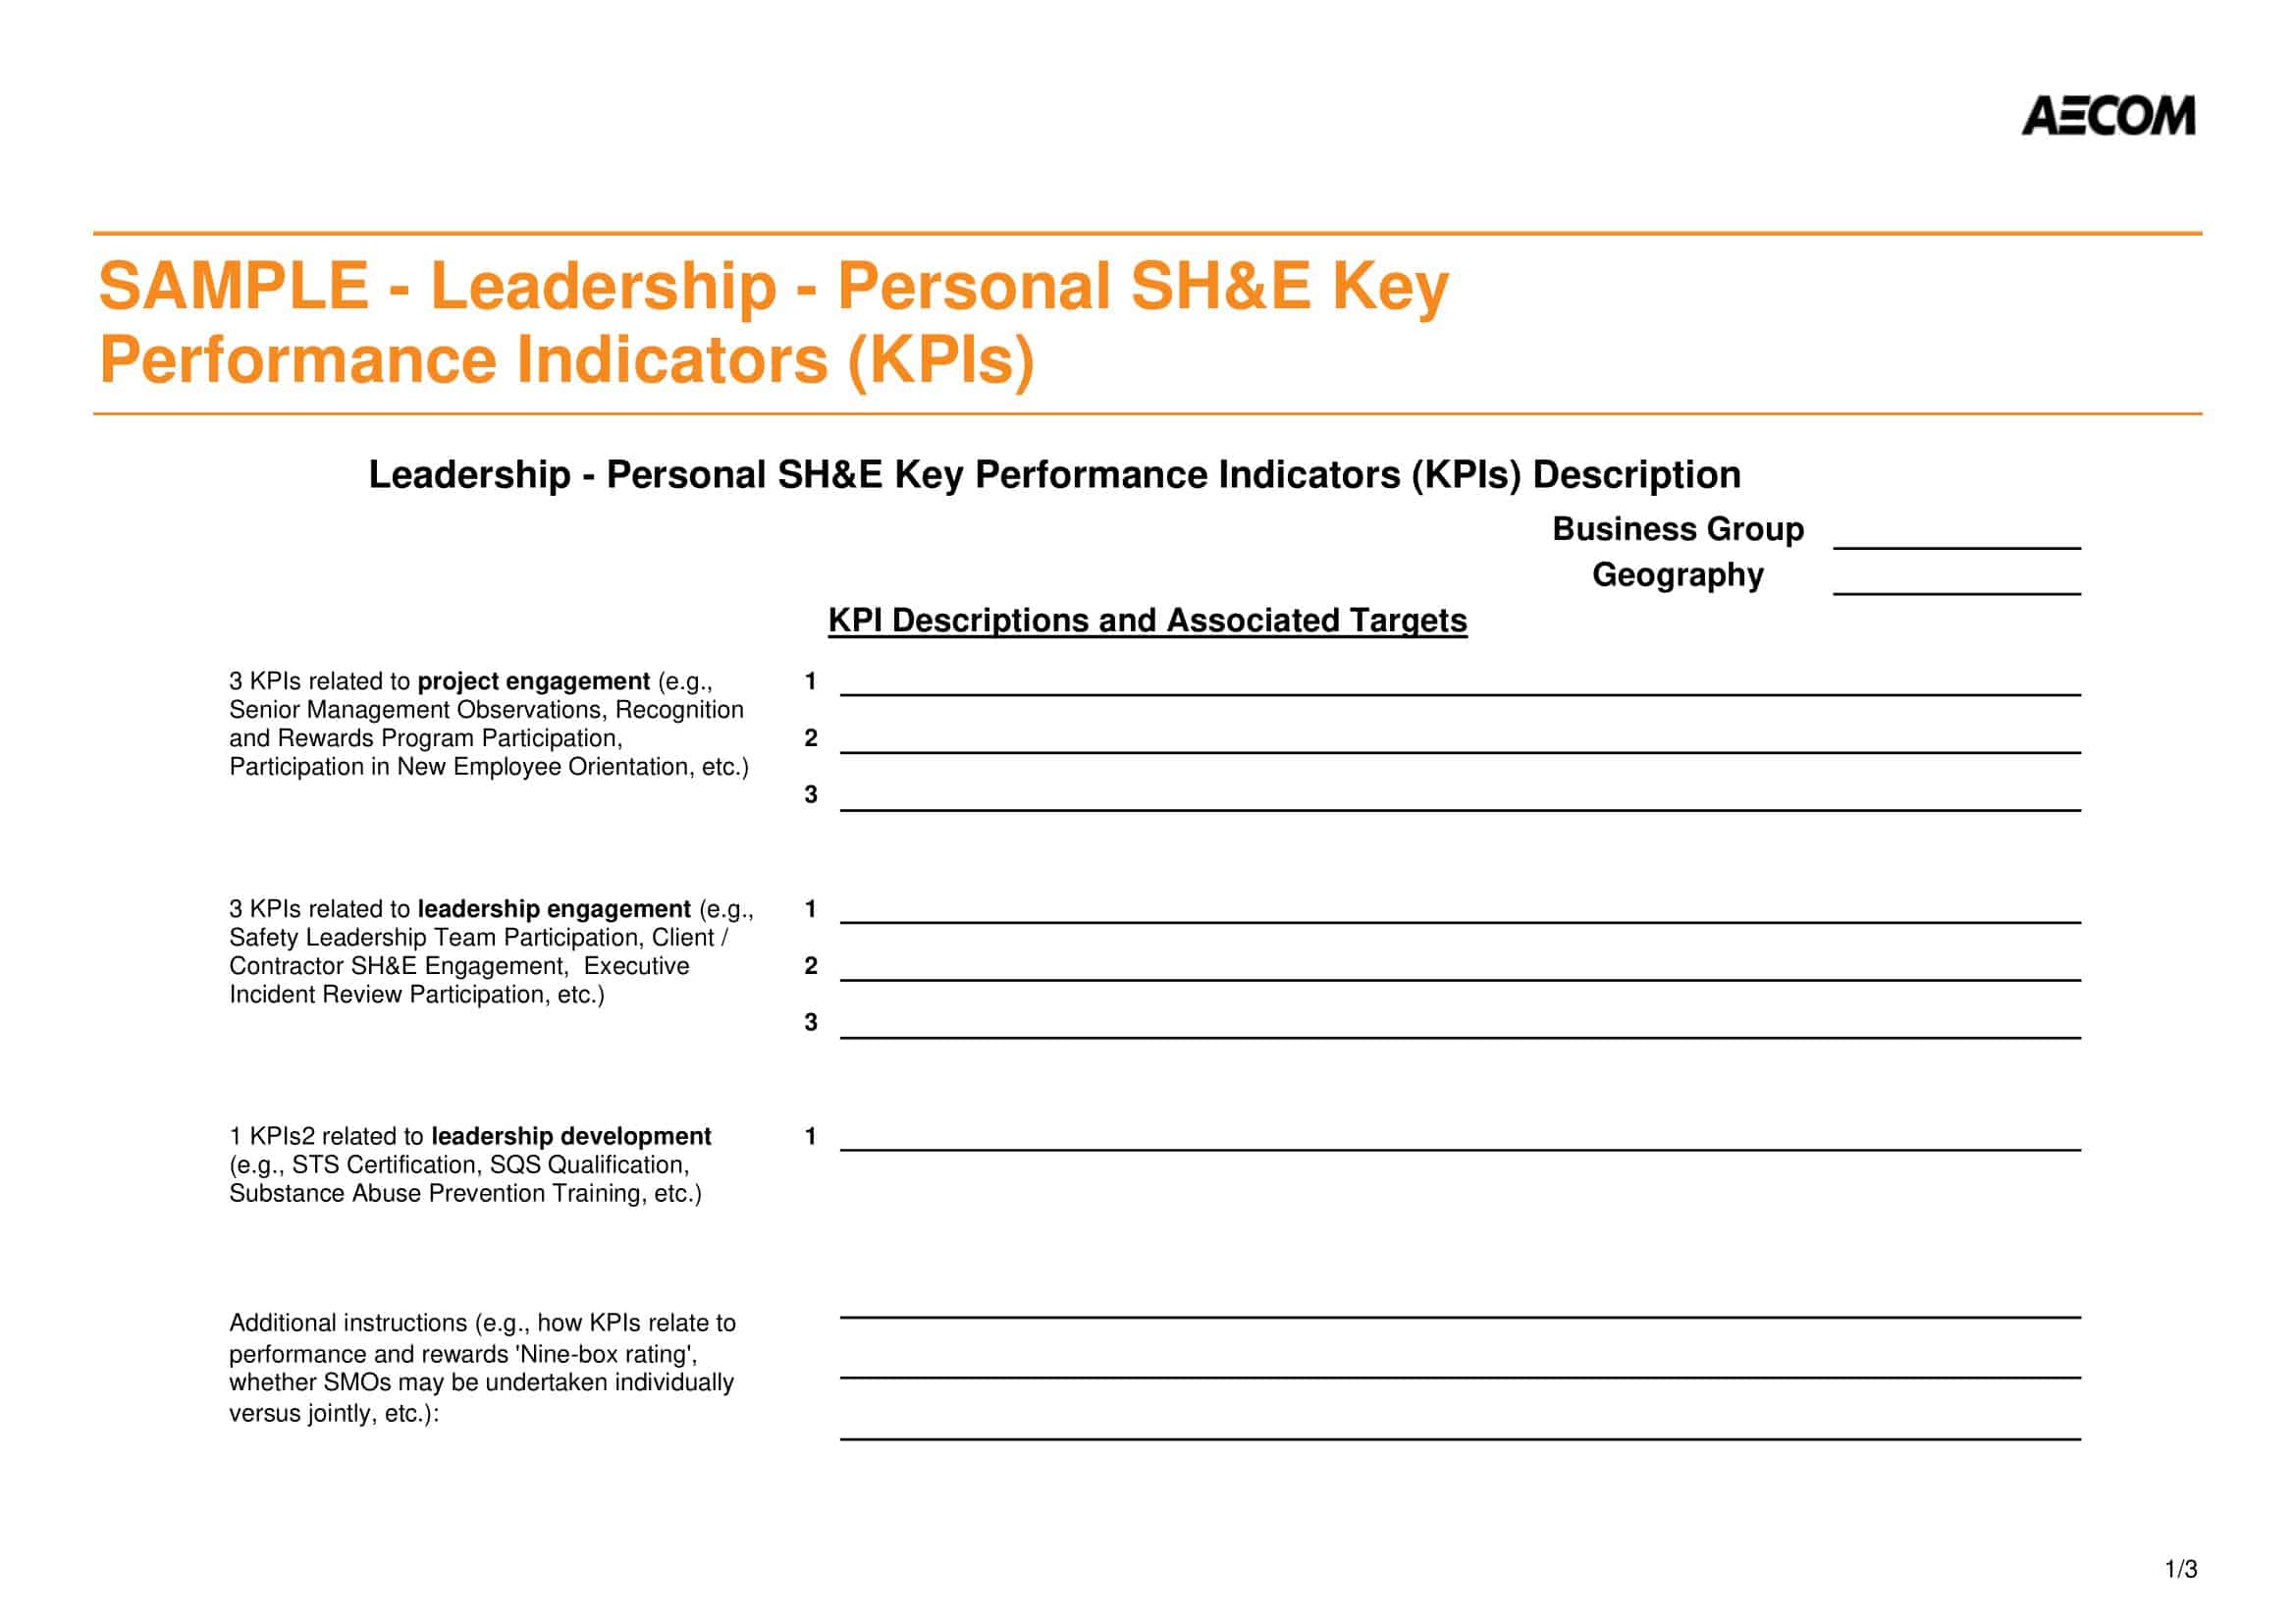
KPI Templates are predefined structures for tracking and analyzing Key Performance Indicators. These templates often contain specific sections for various KPIs that companies and organizations use to measure performance against operational goals and targets.
The design of KPI Templates can be simple or complex, depending on the specific needs of the organization. These templates usually include fields to input data about each KPI, including its definition, measurement period, owner, source of data, calculation method, and goal or target.
One critical element of KPI Templates is their ability to handle a wide range of KPI types. From financial metrics like revenue growth rate to customer-related metrics like net promoter score or internal processes such as operational efficiency, these templates can manage and track them all.
Why KPIs Are Important ?
Key Performance Indicators (KPIs) are crucial tools in the world of business, acting as navigational aids on the journey towards achieving strategic and operational goals. Here’s why they are fundamentally important:
Strategic Alignment
KPIs provide a connection between company objectives and individual actions. By using KPIs, every member of the organization can understand their role in fulfilling these objectives, ensuring that the efforts of all departments and individuals align with the company’s overall strategy.
Performance Measurement
KPIs quantify objectives, turning qualitative goals into quantifiable metrics. This allows companies to monitor the execution of their strategies and evaluate their success in a measurable way. Without KPIs, it would be nearly impossible to gauge progress and performance.
Decision-making Support
By offering a clear, quantitative snapshot of performance, KPIs inform decision-making. Managers and leaders can use KPIs to identify areas of strength and weakness within the organization, enabling them to make informed decisions about where to focus resources or implement changes.
Goal Setting and Motivation
KPIs encourage a culture of continuous improvement by enabling goal setting at different levels of the organization. They create an environment where success can be celebrated and areas for improvement can be identified, boosting employee motivation and engagement.
Early Warning Signals
KPIs can act as an alarm system, detecting potential issues before they escalate. If a KPI begins to veer off course, it can indicate a problem that needs immediate attention. This allows organizations to be proactive and tackle challenges early.
Benchmarking
KPIs enable benchmarking, a process of comparing an organization’s performance against industry standards or competitors. This comparison can provide valuable insights and highlight areas where the organization can strive to improve.
Transparency and Accountability
KPIs foster transparency and accountability within the organization. When KPIs are openly shared, every team member is aware of what is expected of them, and they are held accountable for their contributions towards achieving the overall objectives.
In essence, KPIs are pivotal in steering an organization towards its desired destination. They provide a clear vision of success, foster a culture of accountability, aid in decision making, and promote a continuous drive for improvement. However, to fully leverage the power of KPIs, organizations must ensure they are relevant, well-defined, and tied to strategic objectives.
Types of Key Performance Indicators
Key Performance Indicators (KPIs) come in various forms and types, each with its unique utility. They cater to a wide range of business needs and can be categorized based on several criteria, including the scope of operation, nature of measurement, and time sensitivity. The following are some of the primary types of KPIs:
Quantitative KPIs
As the name suggests, these are quantifiable measurements, typically presented as numbers. They provide an objective metric that can be measured over time, such as sales revenue or the number of new customers acquired.
Qualitative KPIs
Unlike quantitative KPIs, these are subjective measures that are typically based on an individual’s judgements and perceptions. For example, customer satisfaction or employee morale are qualitative KPIs as they cannot be directly measured in numerical terms but can be assessed through surveys or interviews.
Leading KPIs
These are forward-looking indicators that predict the future performance of a company. They offer insights into future outcomes and can help prevent undesirable events from happening. An example of a leading KPI might be the number of qualified leads in a sales pipeline that can indicate future sales revenue.
Lagging KPIs
These are backward-looking indicators that reflect the outcome of a process. They measure the success or failure after an event has been completed, providing useful insights for future strategy refinement. An example would be the annual profit or loss of a company.
Process KPIs
These KPIs focus on how efficiently a company can transform its inputs into outputs. They measure the efficiency or productivity of a specific business process. For instance, a manufacturing firm might use a process KPI to measure the time taken to produce a product from start to finish.
Input KPIs
These KPIs measure the amount of resources consumed during the generation of an output. They are useful in cost analysis and resource allocation. An example could be the number of working hours required to complete a task.
Output KPIs
Output KPIs measure the results of business processes. They tell you what a company has achieved in a given period, such as the number of products produced or the revenue generated.
Practical KPIs
Practical KPIs are directly aligned with a company’s objectives and are tied to its strategic goals. They help companies monitor the progress toward their stated aims.
Directional KPIs
These KPIs indicate whether an organization is improving over time. They can show whether the company is getting better, staying the same, or getting worse.
Actionable KPIs
Actionable KPIs are within a company’s control and can be acted upon. For instance, a company can directly influence the number of customer support tickets resolved in a day.
Keynote: Selecting the right KPI depends on an organization’s specific goals, strategies, and industry. Each type of KPI serves a different purpose and provides unique insights into a company’s performance. The key to successful KPI usage lies in choosing the right mix that reflects the organization’s unique set of objectives and challenges.
How do you measure KPIs?
Measuring Key Performance Indicators (KPIs) starts with identifying the KPIs relevant to your specific business goals. Once established, determine the methods of data collection, which can range from customer surveys to financial reports or performance logs. The next step involves defining clear standards or benchmarks against which the data will be compared.
This could be a specific target, a past performance level, or an industry standard. After gathering the data, use appropriate analytical techniques to calculate each KPI. Periodically review and analyze the results, looking for trends, achievements, or areas needing improvement. Importantly, the interpretation of KPIs should not be done in isolation, but rather in the context of overall business performance and environment.
Finally, present your findings in a digestible format such as dashboards or visual reports, enabling easier understanding and decision-making. Regular measurement and review ensure KPIs remain a true reflection of business performance and a valid tool for strategic planning.
What should be included in KPI?
Establishing effective Key Performance Indicators (KPIs) involves several essential elements. These components are crucial to ensure that your KPIs provide actionable insights and contribute to the attainment of strategic goals. Here’s detailed guide on what should be included in a KPI:
Clear Objective: Each KPI should be linked to a specific objective or goal of the organization. These goals can range from strategic ambitions like increasing market share to operational targets such as reducing production time. The objective must be clearly defined so that the KPI effectively measures progress towards it.
Quantifiable Measures: KPIs should ideally be based on measurable data. Whether it’s sales figures, customer retention rates, or production volumes, the KPI should quantify performance in a way that can be accurately and consistently tracked over time.
Relevance: The KPI must be relevant to the goals and strategy of the organization. This means it should directly reflect the success factors of the business. A KPI that is not aligned with business objectives may lead to misdirected effort and wasted resources.
Time Frame: KPIs should be associated with a specific time frame. This could be monthly, quarterly, yearly, or any other period that suits the nature of the objective. The time frame provides context for evaluating performance and progress.
Benchmark or Target: There should be a benchmark or target associated with each KPI, which represents the desired level of performance. This could be a specific value to reach, a previous performance level to beat, or an industry standard to match.
Data Source: A consistent and reliable data source must be identified for each KPI. This ensures that the KPI measurement is accurate, and comparable over the defined time period. Data sources can range from financial reports and CRM systems to employee surveys or customer feedback forms.
Responsibility: Each KPI should have an individual or a team assigned to it. This ensures accountability and ownership, making it more likely that actions will be taken to improve or maintain the KPI.
Reporting Frequency: The frequency of KPI reporting should be established based on the nature of the KPI and its associated goal. Some KPIs might require daily monitoring, while others may be reviewed weekly, monthly, or quarterly. Regular reporting ensures timely decision-making and action.
Actionability: KPIs must be actionable. That is, the data they provide should be capable of informing decisions and inspiring actions that can improve the measured performance.
Simplicity: While KPIs need to be comprehensive, they should also be easy to understand. Overly complex KPIs can lead to confusion and misinterpretation. Simple, clear KPIs ensure everyone in the organization can understand what they mean and what is expected.
Examples of KPIs
Bed Occupancy Rate (Healthcare Industry KPI)
Bed Occupancy Rate is a vital KPI in the healthcare industry, particularly for hospitals and other in-patient facilities. It refers to the number of hospital beds occupied by patients divided by the total number of available beds, usually expressed as a percentage. High bed occupancy rates may indicate high demand for the healthcare facility’s services but could also signal strain on resources. Low rates might suggest inefficiency or missed opportunities. By monitoring this KPI, hospitals can optimize patient flow, staffing, and capacity planning. For instance, if a hospital has 100 beds and an average of 85 beds are occupied daily, the bed occupancy rate would be 85%.
Average Time to Process an Order (E-Commerce KPI)
In the e-commerce sector, the Average Time to Process an Order measures the time elapsed from when a customer places an order to when the order is prepared for shipping. It’s a crucial indicator of operational efficiency and customer service. The faster the processing time, the quicker the customer will receive their order, enhancing customer satisfaction. For example, if an e-commerce platform manages to process most orders within 6 hours from the order placement, it indicates high operational efficiency.
Loan-to-Deposit Ratio (Banking Industry KPI)
The Loan-to-Deposit Ratio (LDR) is a critical metric for banks, indicating the total loans granted divided by the total deposits received. A higher ratio could signify that a bank is more reliant on borrowed funds, while a lower ratio could suggest that the bank has a healthy level of deposits to support its lending activities. For instance, if a bank has extended loans worth $90 million and has deposits worth $100 million, the LDR would be 90%.
Pupil-Teacher Ratio (Education KPI)
In the education sector, the Pupil-Teacher Ratio is a key indicator of the learning environment’s quality. It represents the number of students enrolled in a school or an educational institution divided by the total number of teachers. A lower ratio implies more individual attention for students, potentially enhancing learning outcomes. For example, a school with 600 students and 30 teachers would have a Pupil-Teacher Ratio of 20:1.
Customer Acquisition Cost (Software-as-a-Service (SaaS) KPI)
The Customer Acquisition Cost (CAC) is a significant metric for SaaS companies. It measures the average cost associated with acquiring a new customer, including the costs of marketing and sales efforts. The lower the CAC, the more efficient the company is at acquiring customers. For instance, if a SaaS company spends $5,000 on marketing and sales in a month and acquires 50 new customers, the CAC would be $100.
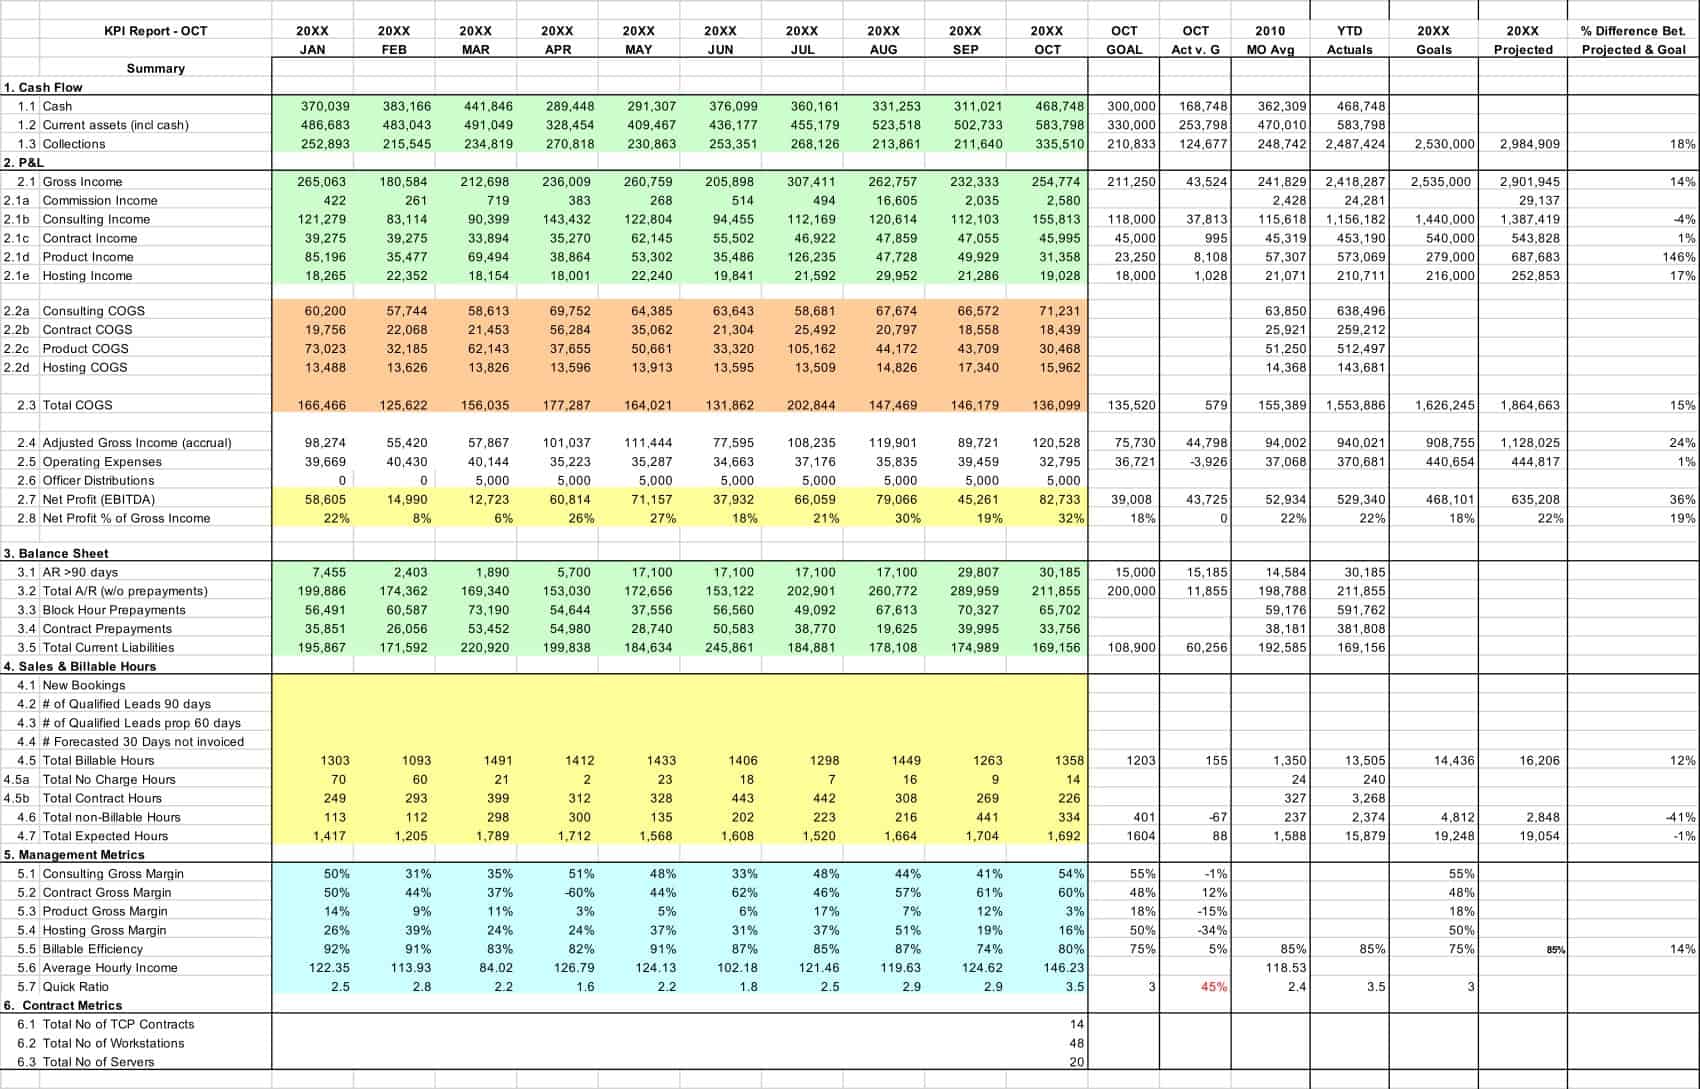
How to Create a KPI Report
Creating a Key Performance Indicator (KPI) report is a critical aspect of business strategy. It’s a way of presenting your company’s most important metrics in a way that’s easy to understand and act upon. Here is a step-by-step guide on how to create a comprehensive and effective KPI report:
Step 1: Define Your Goals and Objectives
Start by clearly defining your business goals and objectives. They could be tied to revenue, customer satisfaction, internal efficiency, market expansion, or any other aspect of your business. Your goals should be SMART – Specific, Measurable, Achievable, Relevant, and Time-bound.
Step 2: Identify Relevant KPIs
Once your goals are clearly defined, you need to identify the KPIs that are most relevant to these goals. Each KPI should have a direct and measurable impact on your defined objectives. Be careful not to choose too many KPIs, as this can lead to information overload and detract from the focus on key objectives.
Step 3: Determine Your Data Sources:
After identifying your KPIs, you need to determine where the data for these indicators will come from. It could be from internal sources such as your sales or customer service departments, or external sources such as market research. Ensure the data sources are reliable and accurate.
Step 4: Set Targets and Benchmarks
For each KPI, set a target or benchmark that represents your goal for that indicator. This could be based on your company’s past performance, industry standards, or specific objectives you want to achieve. This will give you a clear point of comparison for your actual results.
Step 5: Collect and Analyze Data
Collect data for your KPIs from the identified sources, over the relevant period. Then analyze this data to calculate each KPI. Use statistical and data analysis methods to interpret the data, identify trends, and draw conclusions.
Step 6: Visualize Your Data
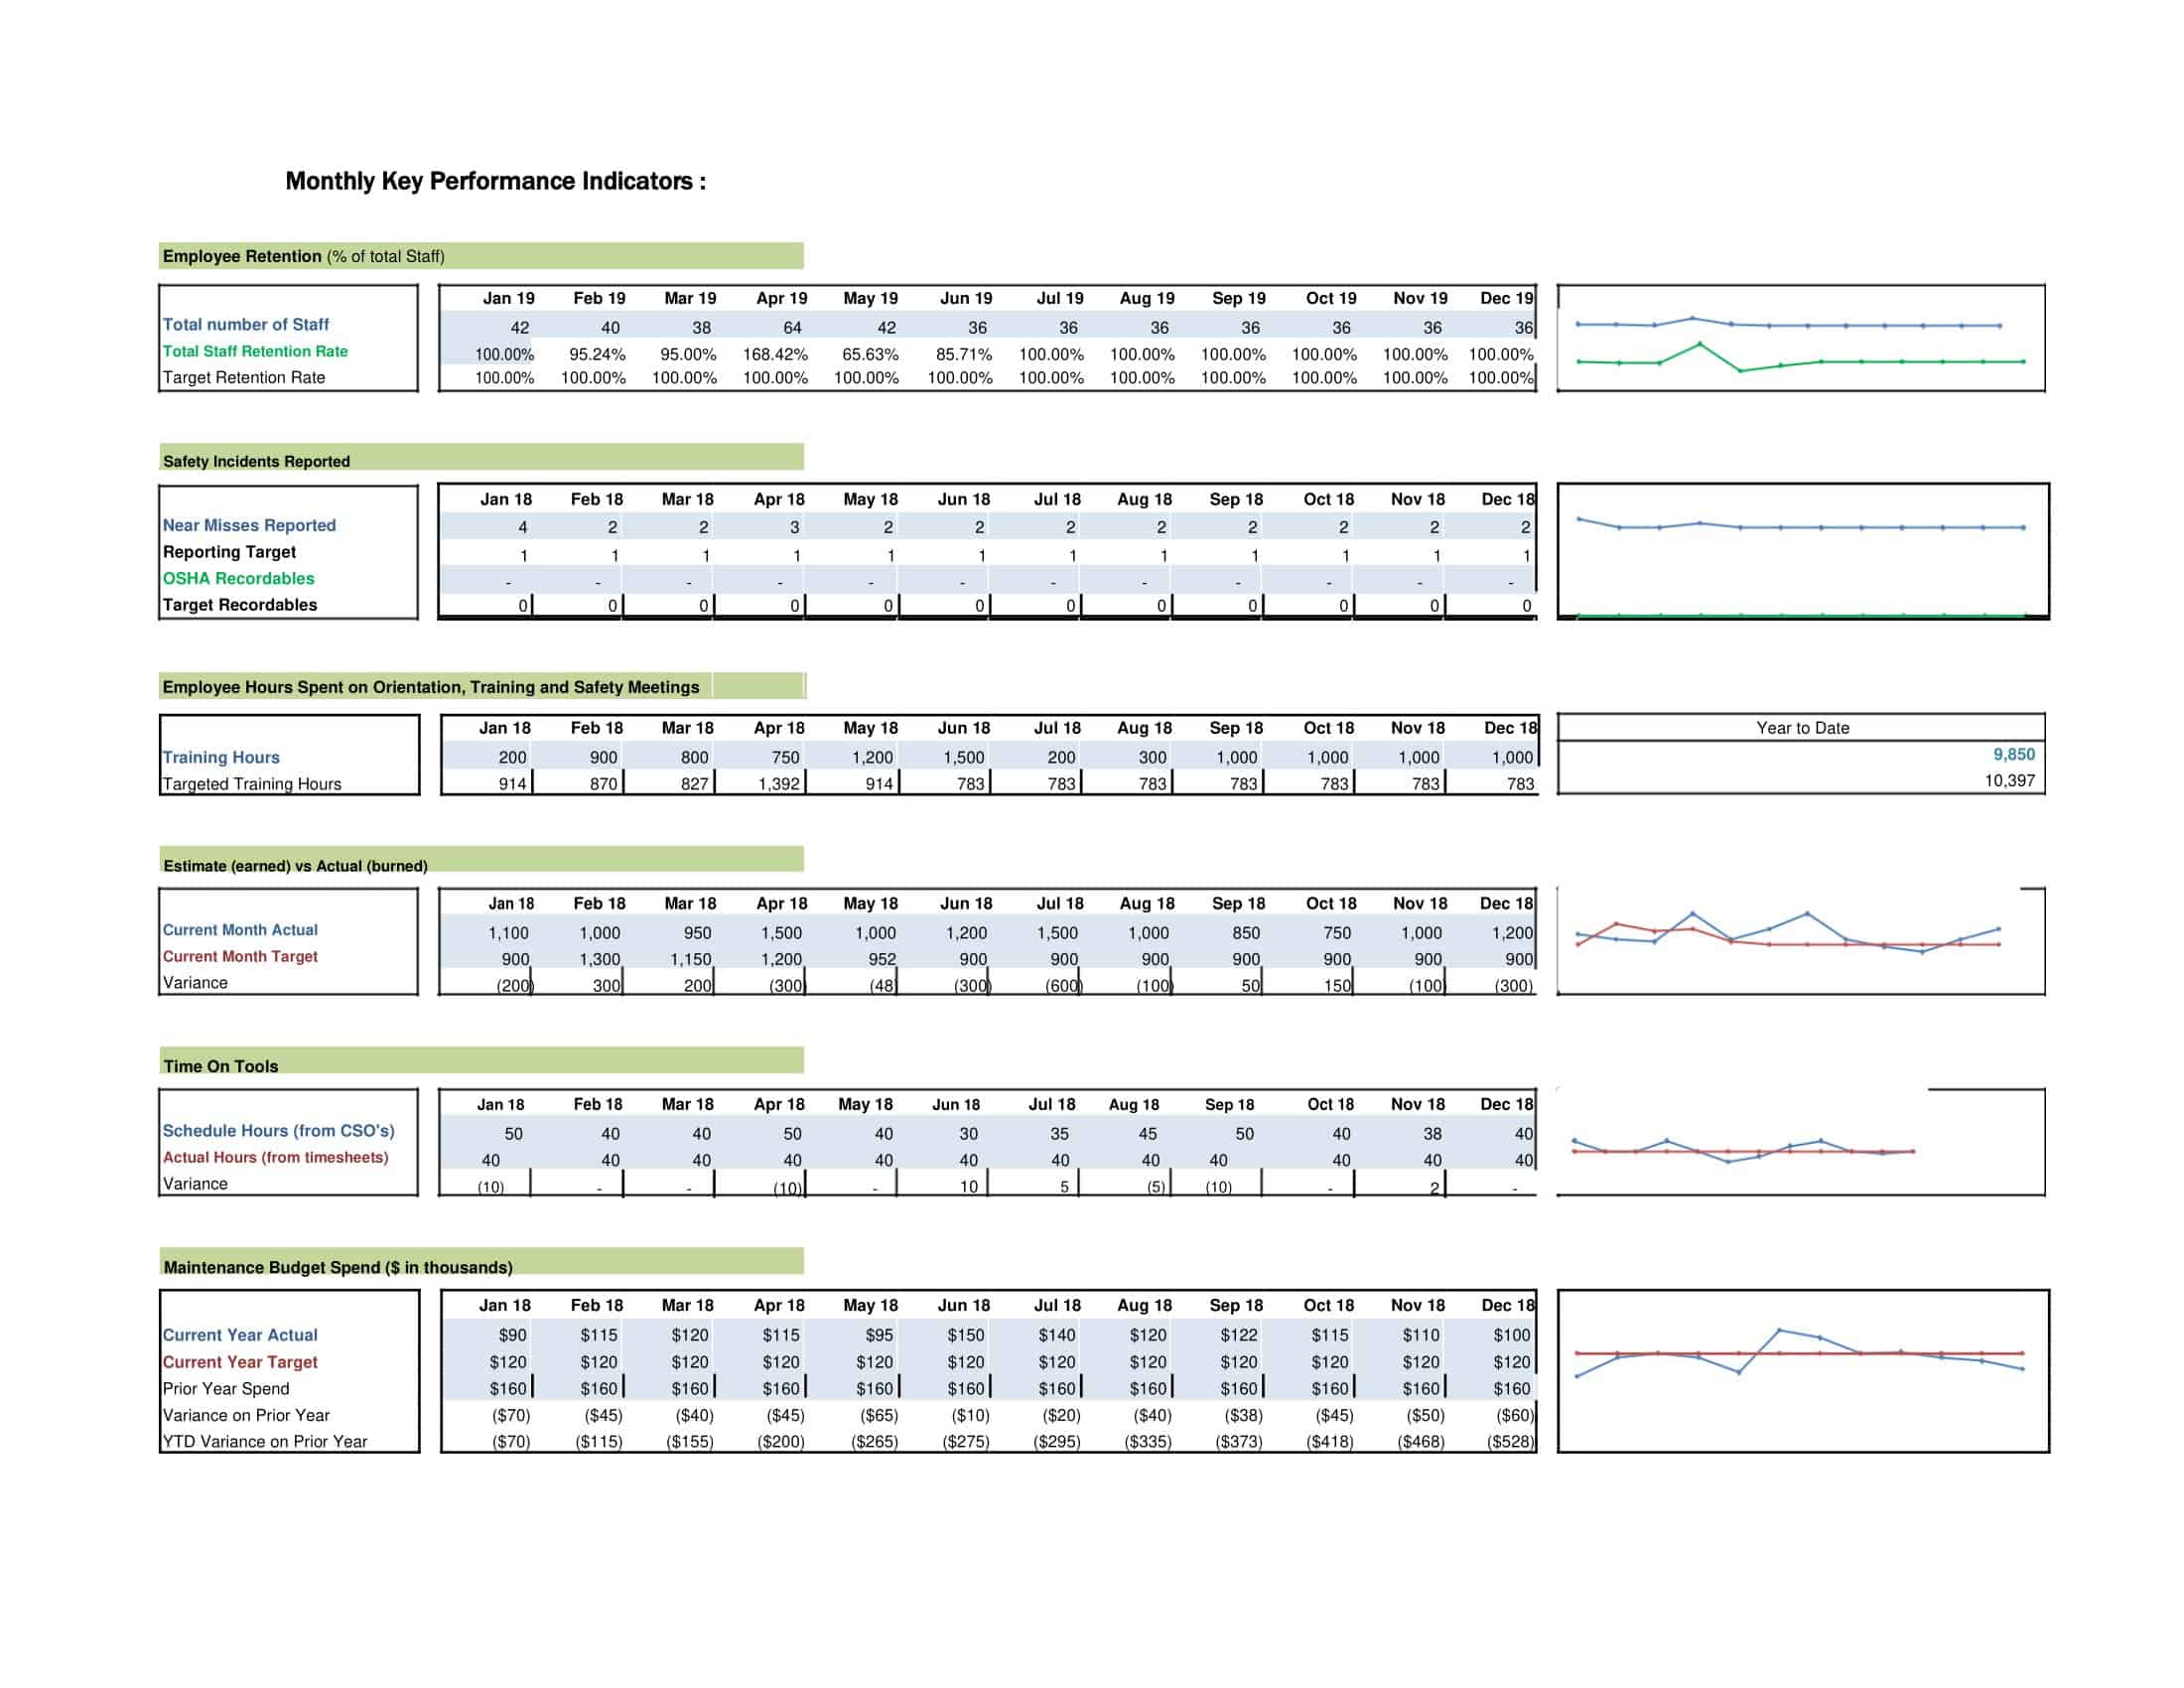
Present your KPIs in a visually appealing and easily understandable manner. Use graphs, charts, and other visualization tools to make the data more digestible. For example, you could use a line graph to show trends over time or a bar chart to compare different categories.
Step 7: Create the Report
Start the report by providing an overview of the objectives and KPIs. Then present each KPI, along with its visualization, actual result, target, and an analysis of the result. Discuss what the results mean for your business, and any actions you plan to take as a result.
Step 8: Provide Recommendations
Based on the performance against each KPI, provide actionable recommendations for improvement. This could involve adjusting strategies, reallocating resources, or implementing new tactics.
Step 9: Review and Refine
After completing the report, review it for clarity, accuracy, and effectiveness. Also, as your business goals and conditions change, your KPIs might need to change as well. Regularly review and refine your KPIs to ensure they remain relevant and valuable.
Step 10: Communicate Your Findings
Finally, share the KPI report with all relevant stakeholders, including team members, managers, executives, and investors. Use the report as a tool for communicating your performance, discussing improvements, and aligning your team around shared goals.
Best KPI Dashboard Software & Tools
KPI Dashboard Software allows you to manage, track, and analyze your key performance indicators effectively. Here’s a list of top KPI software tools with their websites and details:
Tableau (www.tableau.com):
Tableau is one of the most popular data visualization tools that help businesses transform raw data into understandable, interactive dashboards. It’s particularly favored for its intuitive interface, extensive customization options, and the ability to handle large volumes of data. You can connect to various data sources, and it also supports real-time data analysis.
Microsoft Power BI (www.powerbi.microsoft.com):
Power BI is another robust tool for creating KPI dashboards. It has excellent data visualization capabilities and a user-friendly drag-and-drop interface. Power BI can connect to a wide range of data sources, from Excel spreadsheets and on-premise SQL Server databases to cloud services like Azure SQL Database and Google Analytics.
Databox (www.databox.com):
Databox is a mobile-first business analytics platform built to help you understand what’s going on with your business. It integrates with various tools and allows you to monitor all your business data from one place. You can build custom dashboards without any coding and receive updates in real-time on your mobile device.
Zoho Analytics (www.zoho.com/analytics/):
Zoho Analytics is a self-service BI and analytics platform that allows you to create visually appealing data visualizations and insightful dashboards in minutes. Its strong points include a wide range of pre-built reports, intuitive drag-and-drop interface, and capability to blend and merge data from across multiple sources.
Klipfolio (www.klipfolio.com):
Klipfolio is a cloud-based KPI dashboard platform used by thousands of businesses worldwide. It allows users to connect to numerous data sources, create beautiful visualizations, and share the most important insights with the team. The tool provides real-time visibility into your data and allows for comprehensive customization.
Sisense (www.sisense.com):
Sisense is an end-to-end business intelligence tool that enables users to easily prepare and analyze complex datasets. It stands out for its ability to handle large amounts of data and the possibility to embed interactive dashboards into customer-facing applications.
Geckoboard (www.geckoboard.com):
Geckoboard is an easy-to-use tool that creates TV dashboards for your metrics. It allows you to pull in data from various sources, and it’s designed for real-time tracking. It’s particularly useful for teams as a way to keep an eye on their KPIs throughout the day.
When choosing the best KPI software, you need to consider your specific needs, the complexity of your data, the integrations you need, and your budget. Each of these tools offers a unique set of features, and the best choice depends on your specific situation. Most of these tools offer trial versions, so I recommend trying a few to see which fits your requirements the best.
FAQs
Can KPIs change?
Yes, KPIs can and should change as your business goals and strategies evolve. It’s important to review your KPIs periodically to ensure they still align with your current business objectives.
How many KPIs should a company have?
The number of KPIs a company should have depends on its size, goals, and the complexity of its operations. However, it’s usually advisable to focus on a limited number of crucial KPIs (often referred to as “critical success factors”) to prevent diluting focus and resources.
What’s the difference between a KPI and a metric?
While all KPIs are metrics, not all metrics are KPIs. A metric is a measurable value that provides information about business performance. A KPI, however, is a specific metric that has been chosen as a key gauge of organizational performance and progress toward defined objectives.
How do I choose the right KPIs?
The right KPIs should align directly with your strategic goals. They should be relevant to your business model, industry, and market. Good KPIs are quantifiable, easy to understand, and a result of relevant business processes. They should also be normalized, meaning they are adjusted for factors that might impact comparison.
What is a KPI dashboard?
A KPI dashboard is a tool used for visualizing and tracking key performance indicators. It offers a comprehensive snapshot of performance, allowing organizations to access, analyze, and improve various areas of operations. Dashboards can be built using software like Tableau, Power BI, or custom-built within Excel or Google Sheets.
What is a KPI scorecard?
A KPI scorecard is a visual representation of key performance indicators that helps organizations monitor and measure performance. It combines data from different sources to provide an overview of the organization’s performance and progress towards its goals.











![Free Printable Credit Card Authorization Form Templates [PDF, Word, Excel] 1 Credit Card Authorization Form](https://www.typecalendar.com/wp-content/uploads/2023/06/Credit-Card-Authorization-Form-150x150.jpg)
![Free Printable Stock Ledger Templates [Excel,PDF, Word] 2 Stock Ledger](https://www.typecalendar.com/wp-content/uploads/2023/08/Stock-Ledger-150x150.jpg)
![Free Printable Financial Projections Templates [Excel, PDF] 3 Financial Projection](https://www.typecalendar.com/wp-content/uploads/2023/05/Financial-Projection-1-150x150.jpg)
