In today’s data-driven world, decision-making processes are constantly becoming more complex and multifaceted. Amidst this growing complexity, Decision Trees serve as a beacon of simplicity and clarity, illuminating the path to insightful conclusions.
They stand at the intersection of data and decisions, forging a critical link between raw information and meaningful action. This article aims to uncover the myriad ways Decision Trees are employed across various sectors, demonstrating their profound influence on our understanding and interaction with a wide range of phenomena.
Table of Contents
What is a decision tree?

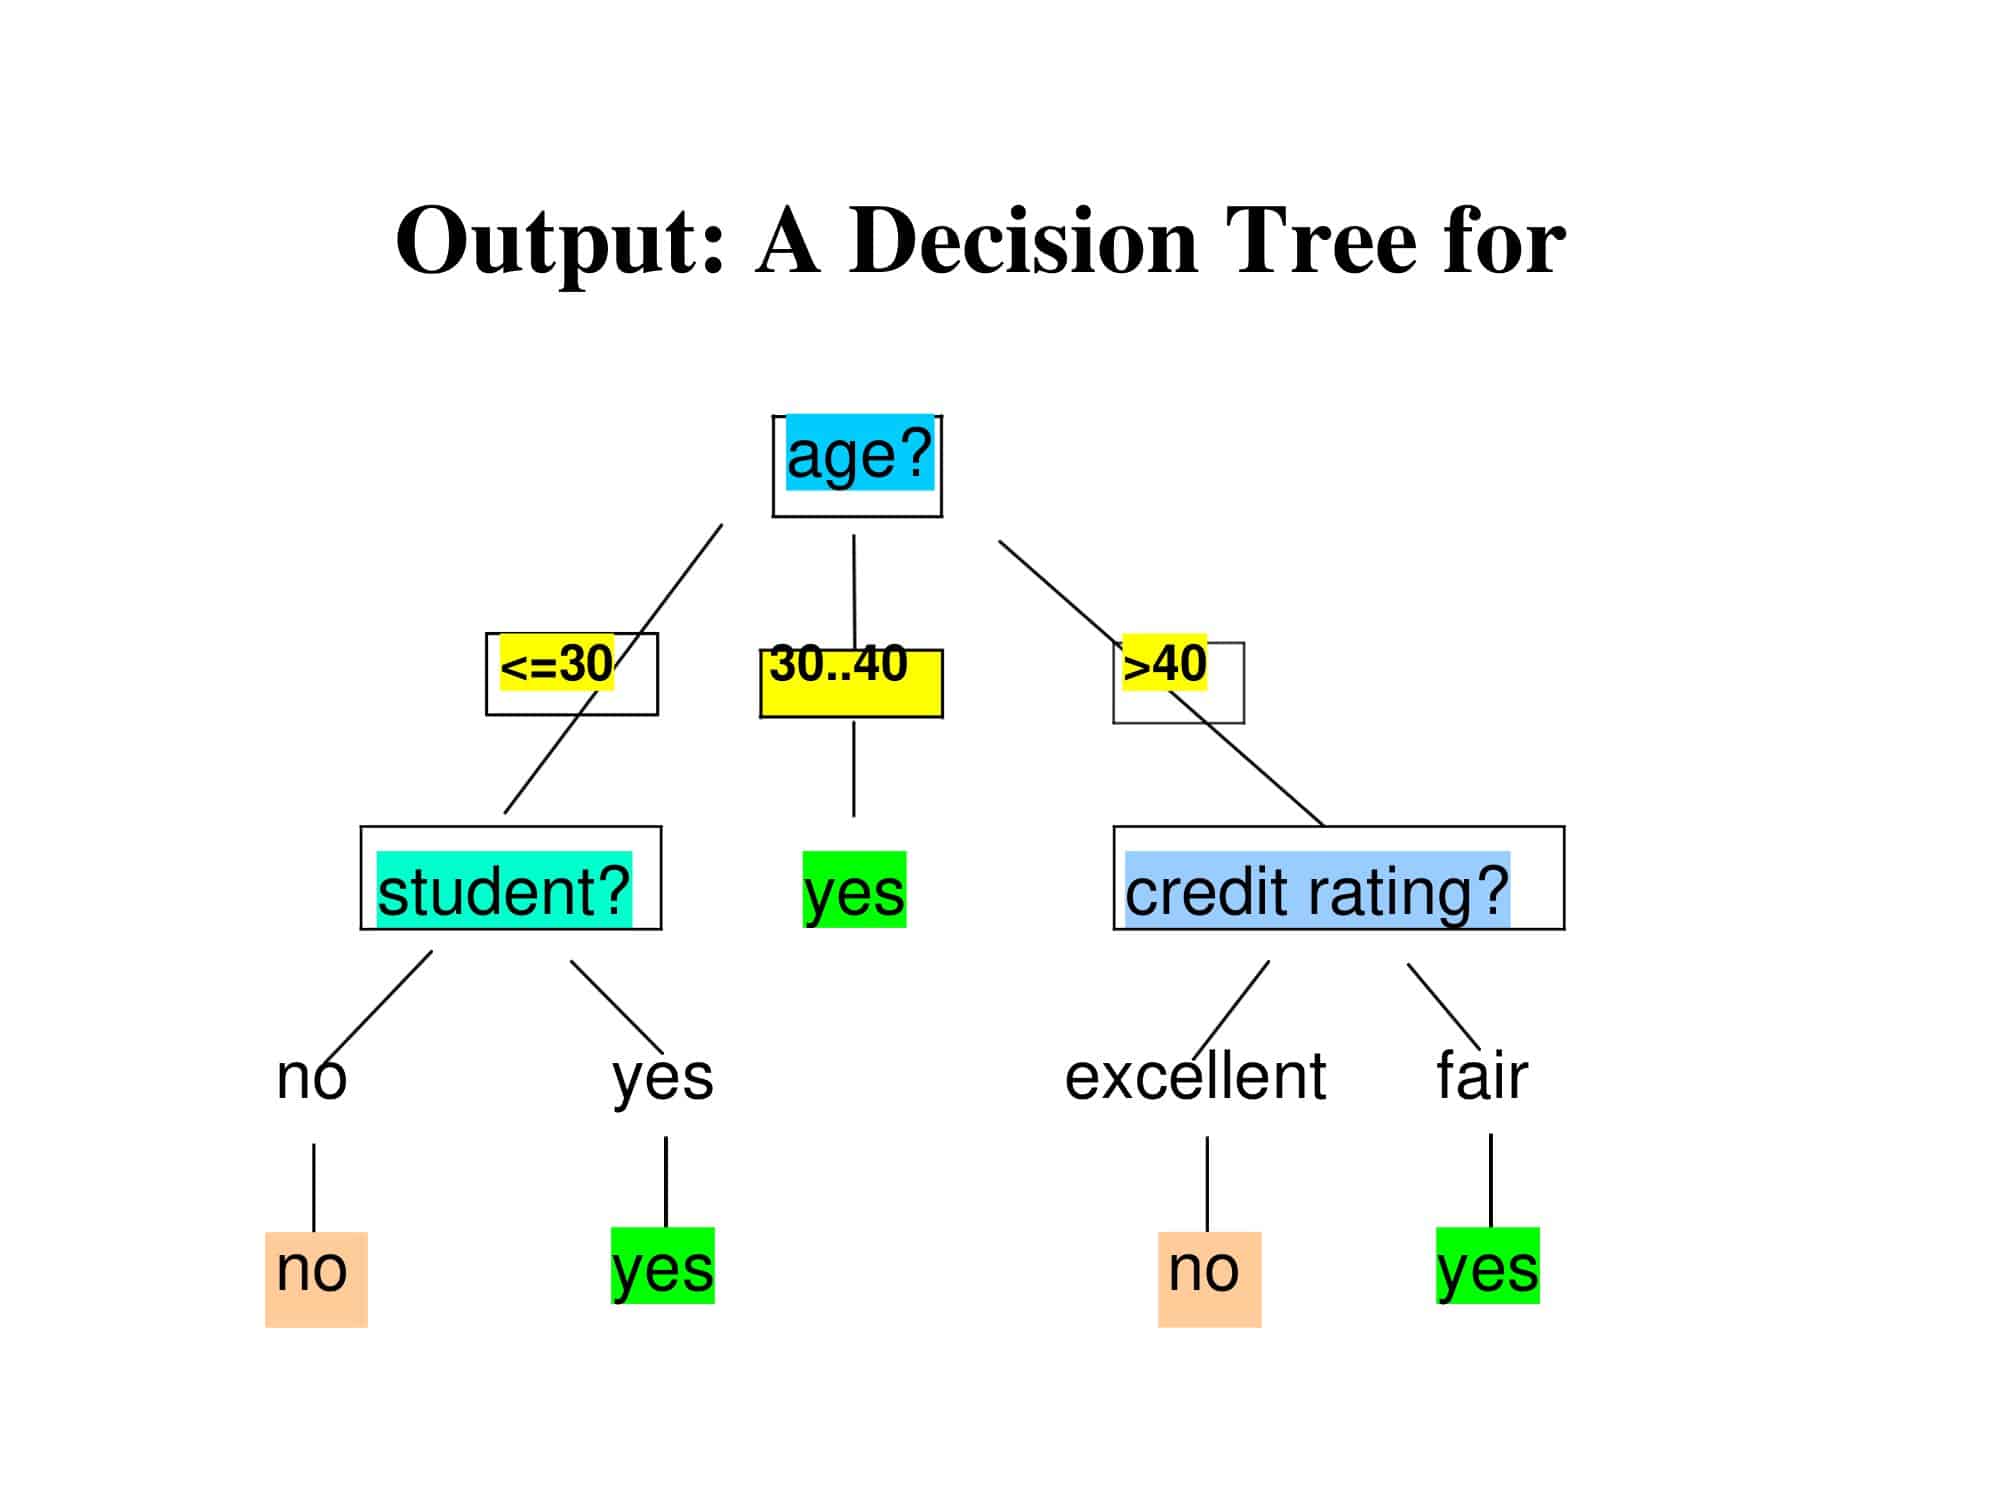
A Decision Tree is a flowchart-like structure used in decision making, where each internal node denotes a test on an attribute, each branch represents an outcome of the test, and each leaf node (terminal node) holds a class label (decision). It’s a simple yet powerful tool used in both data mining and machine learning.
The topmost node in a Decision Tree is known as the root node. It learns to partition on the basis of the attribute value. This process is recursively performed on each derived subset in a manner called recursive partitioning.
The concept is used broadly in fields like machine learning and artificial intelligence to build algorithms for classification and regression models. This tree-like model of decisions and their possible consequences allows for visibility of all possible outcomes, making it a valuable tool for strategic decision-making.
Decision Tree Templates
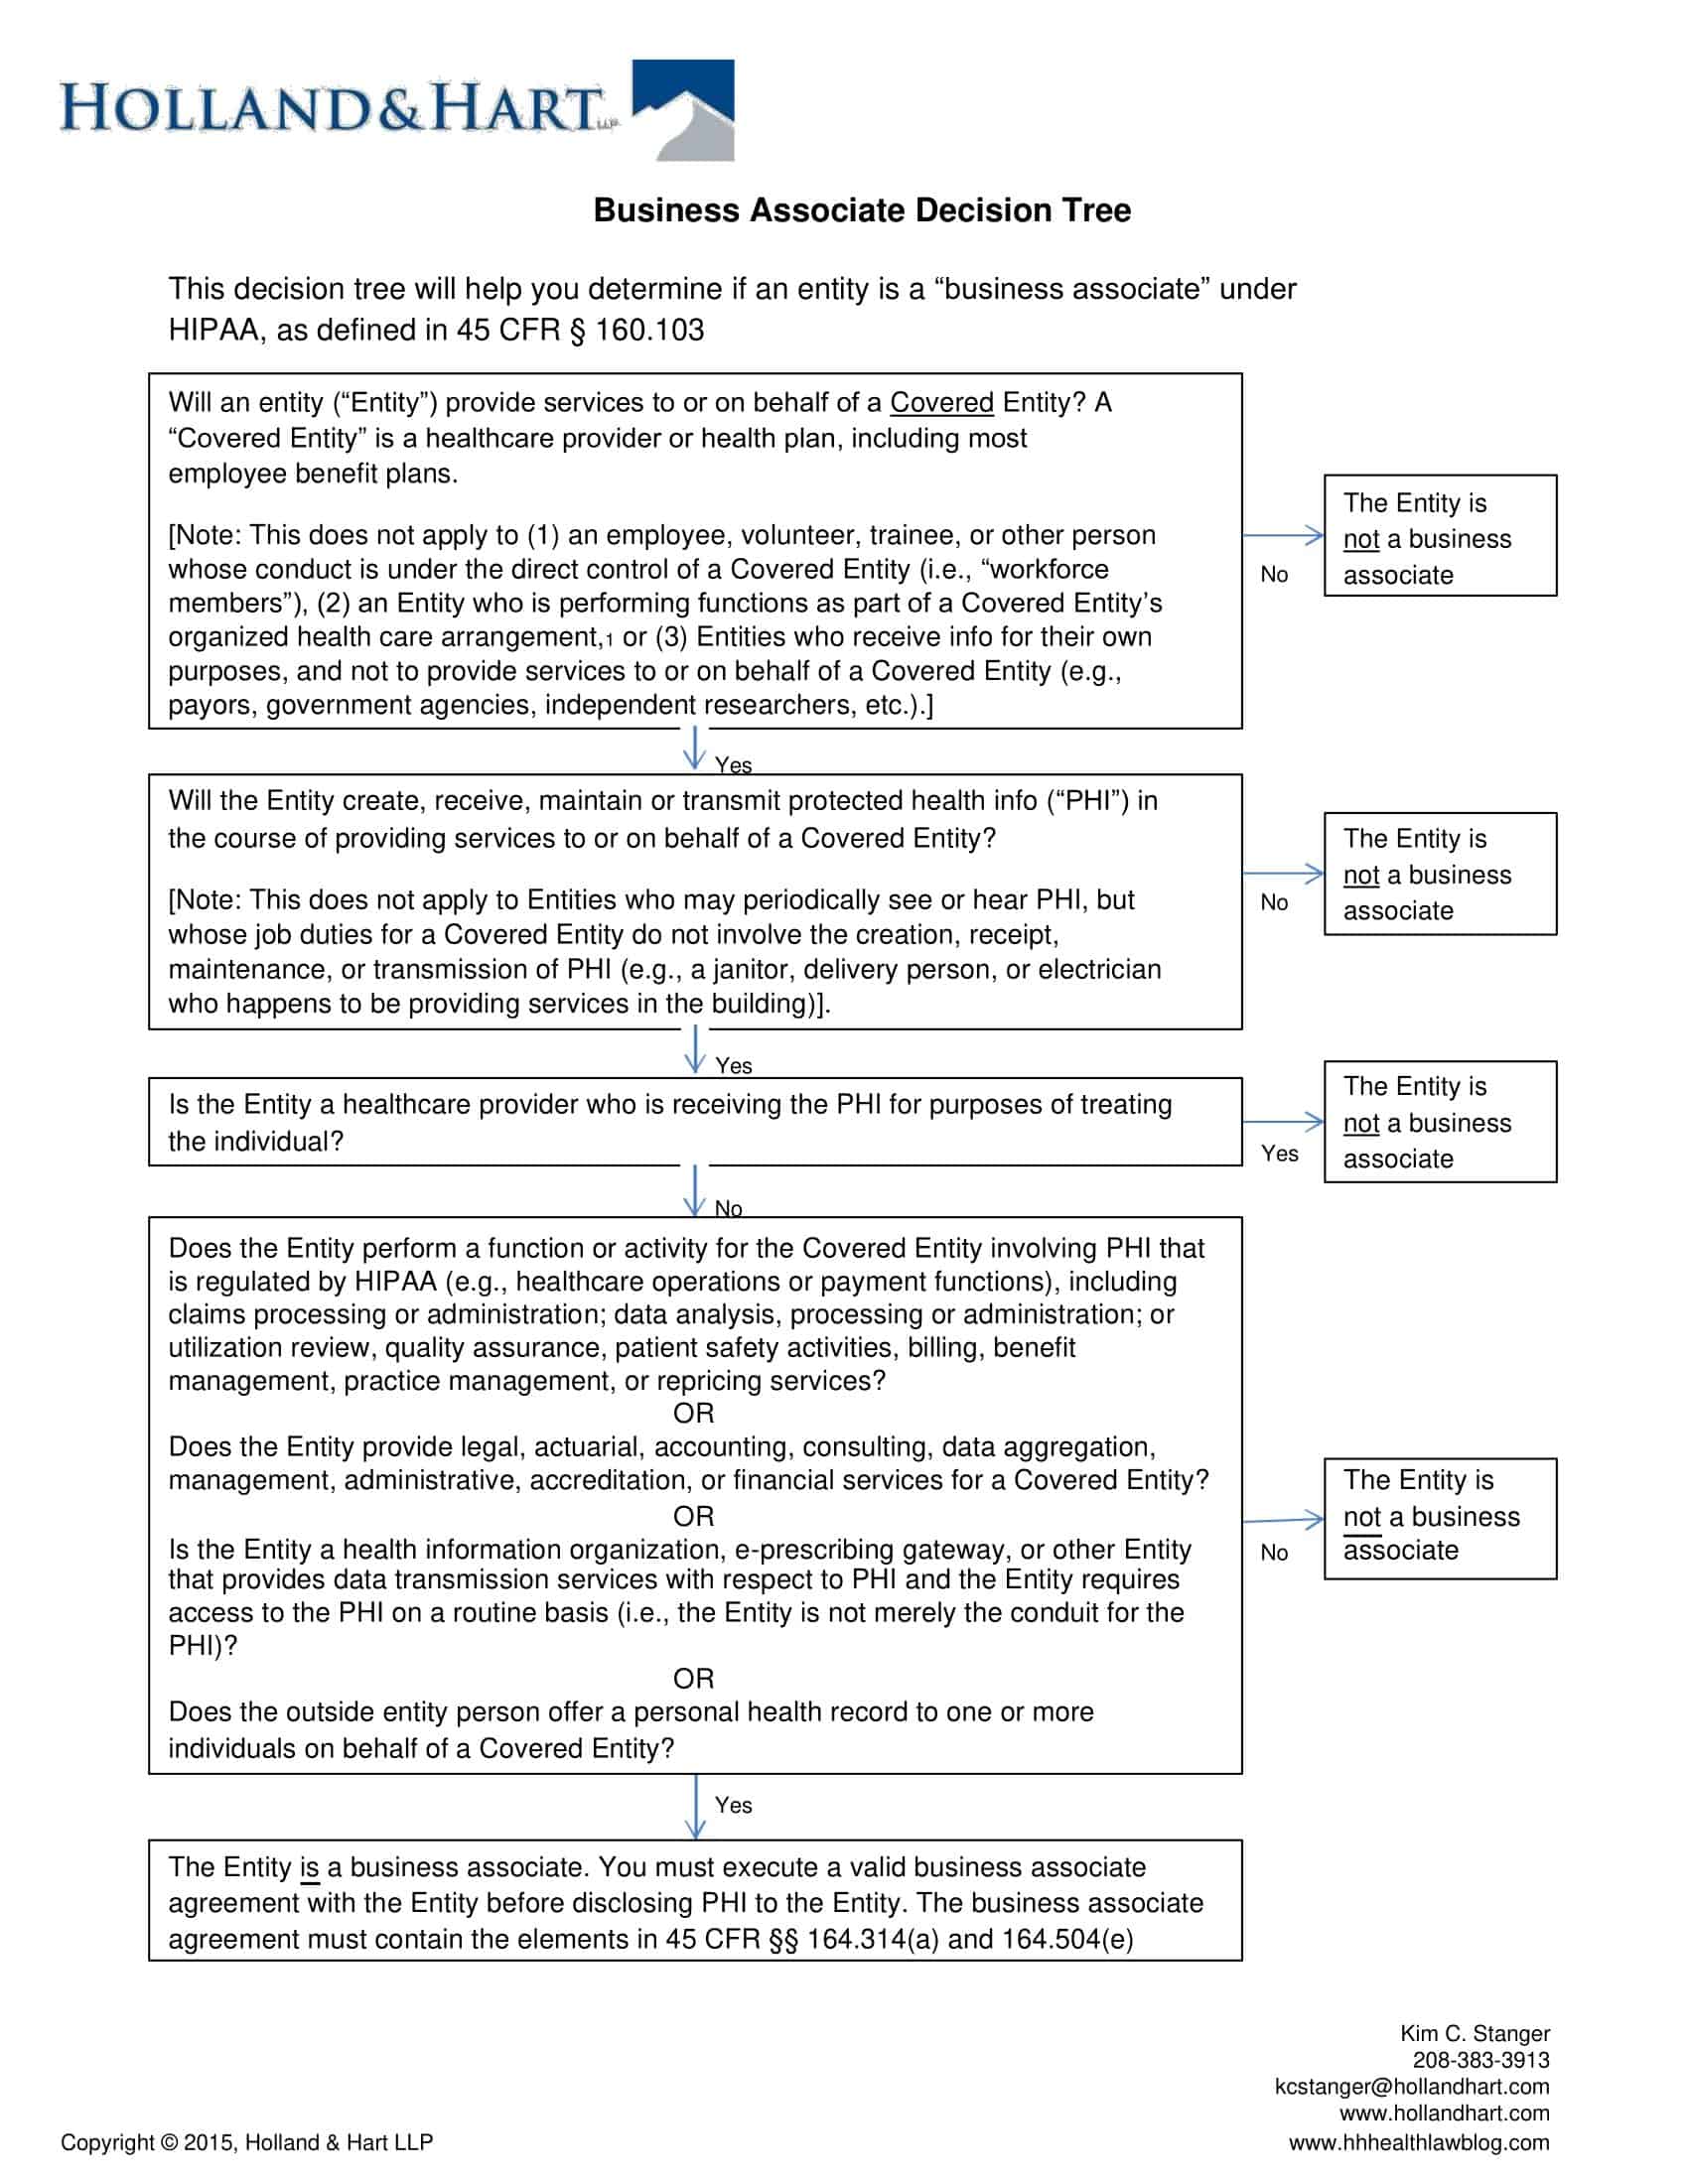
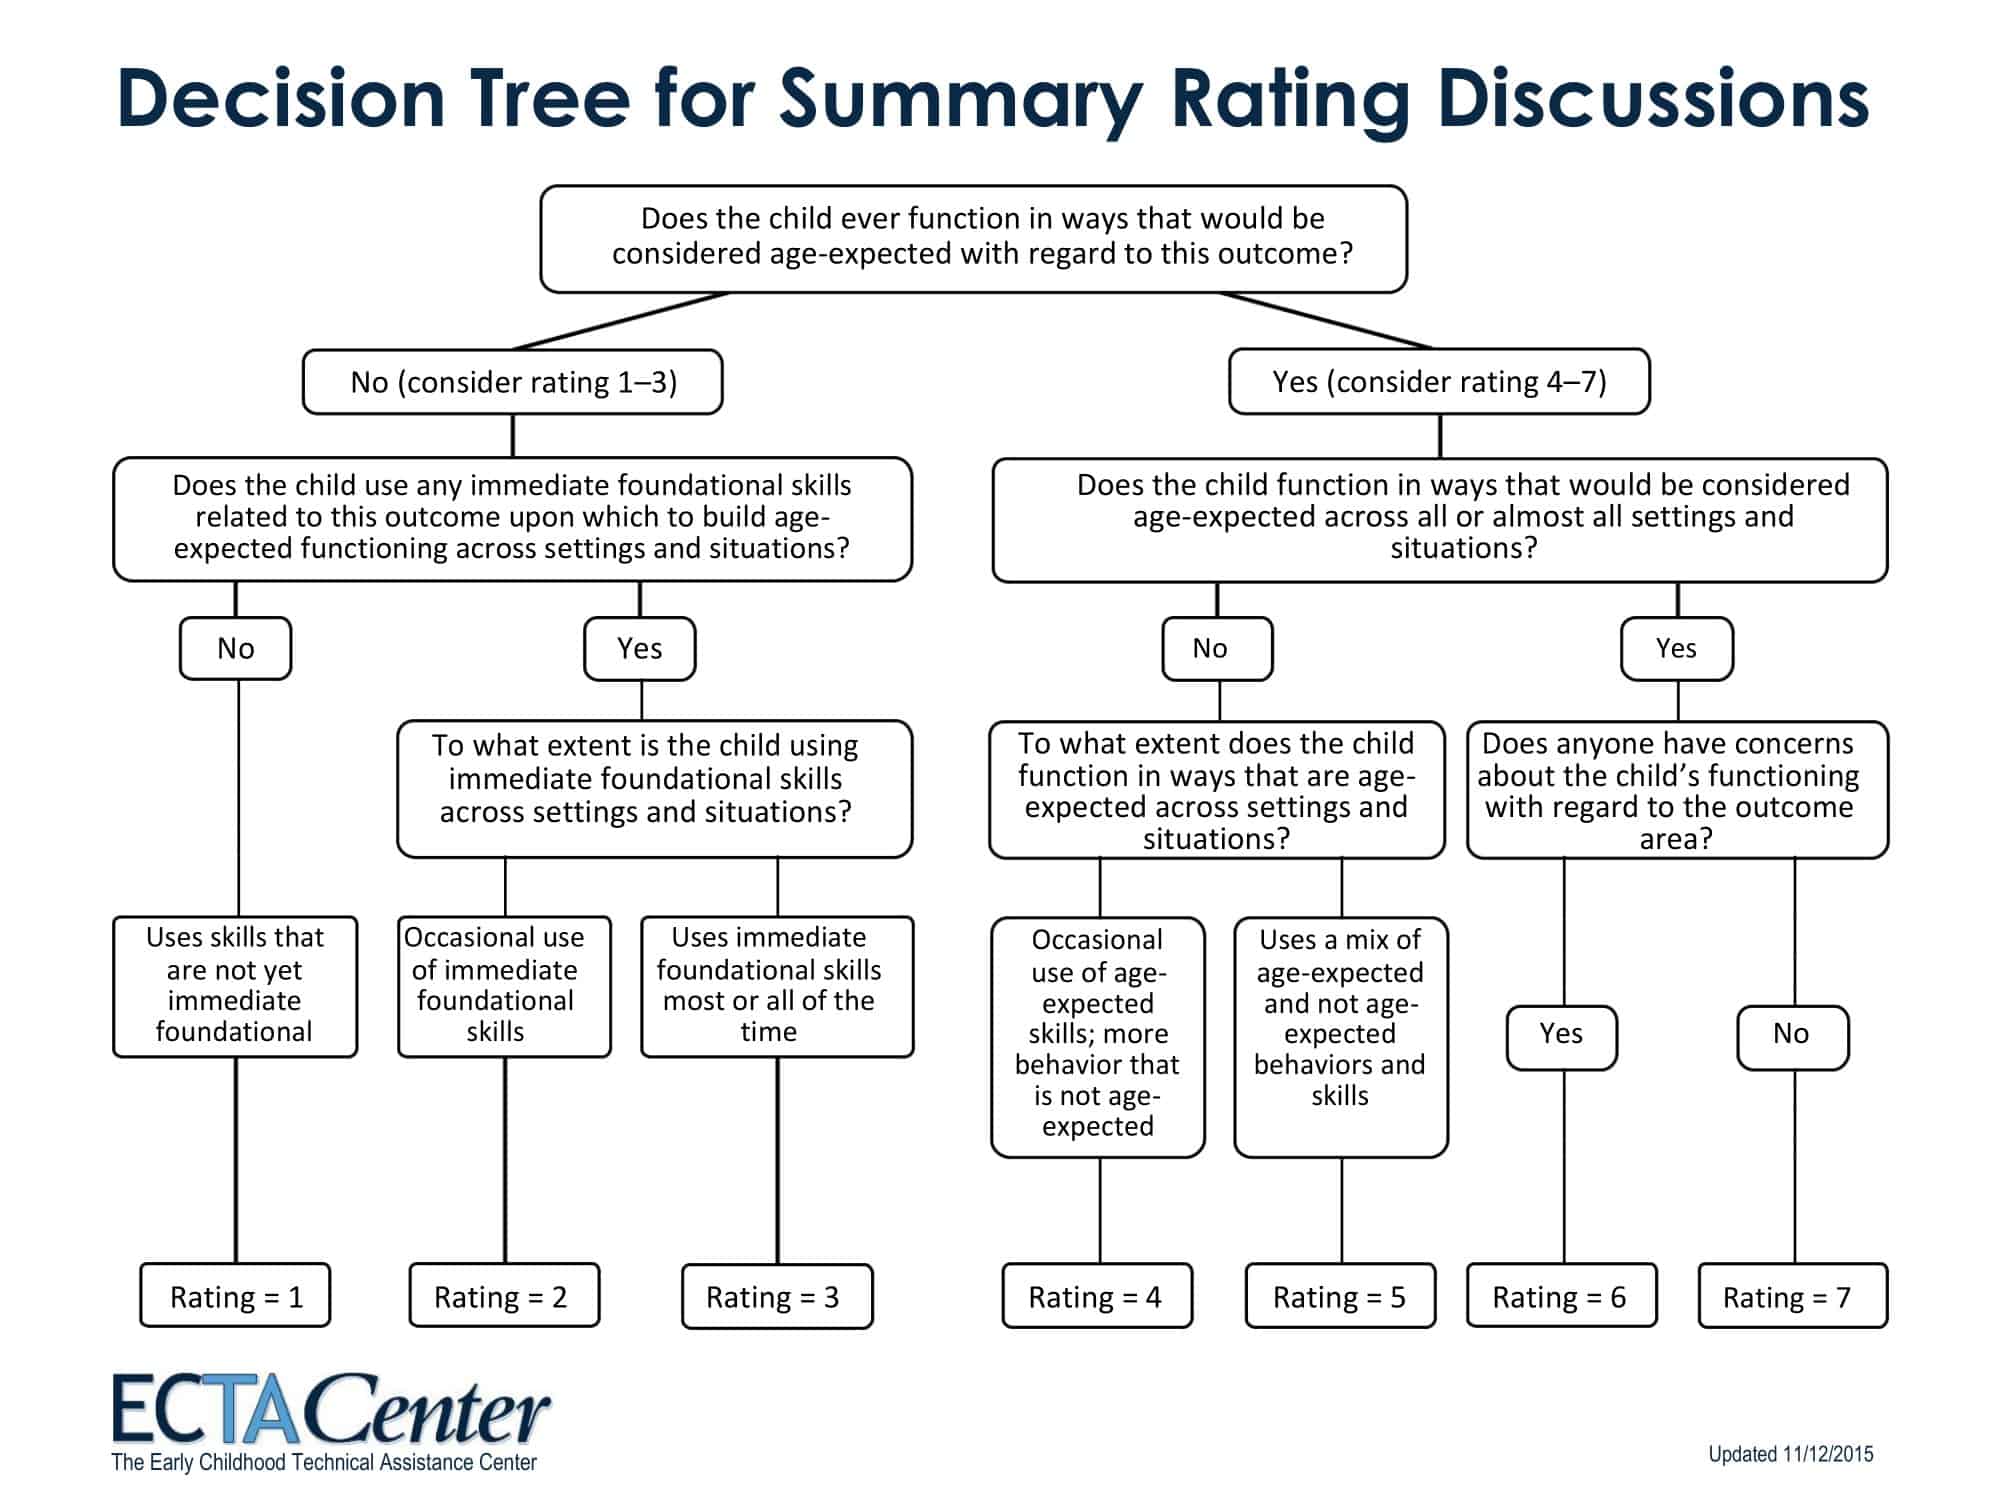
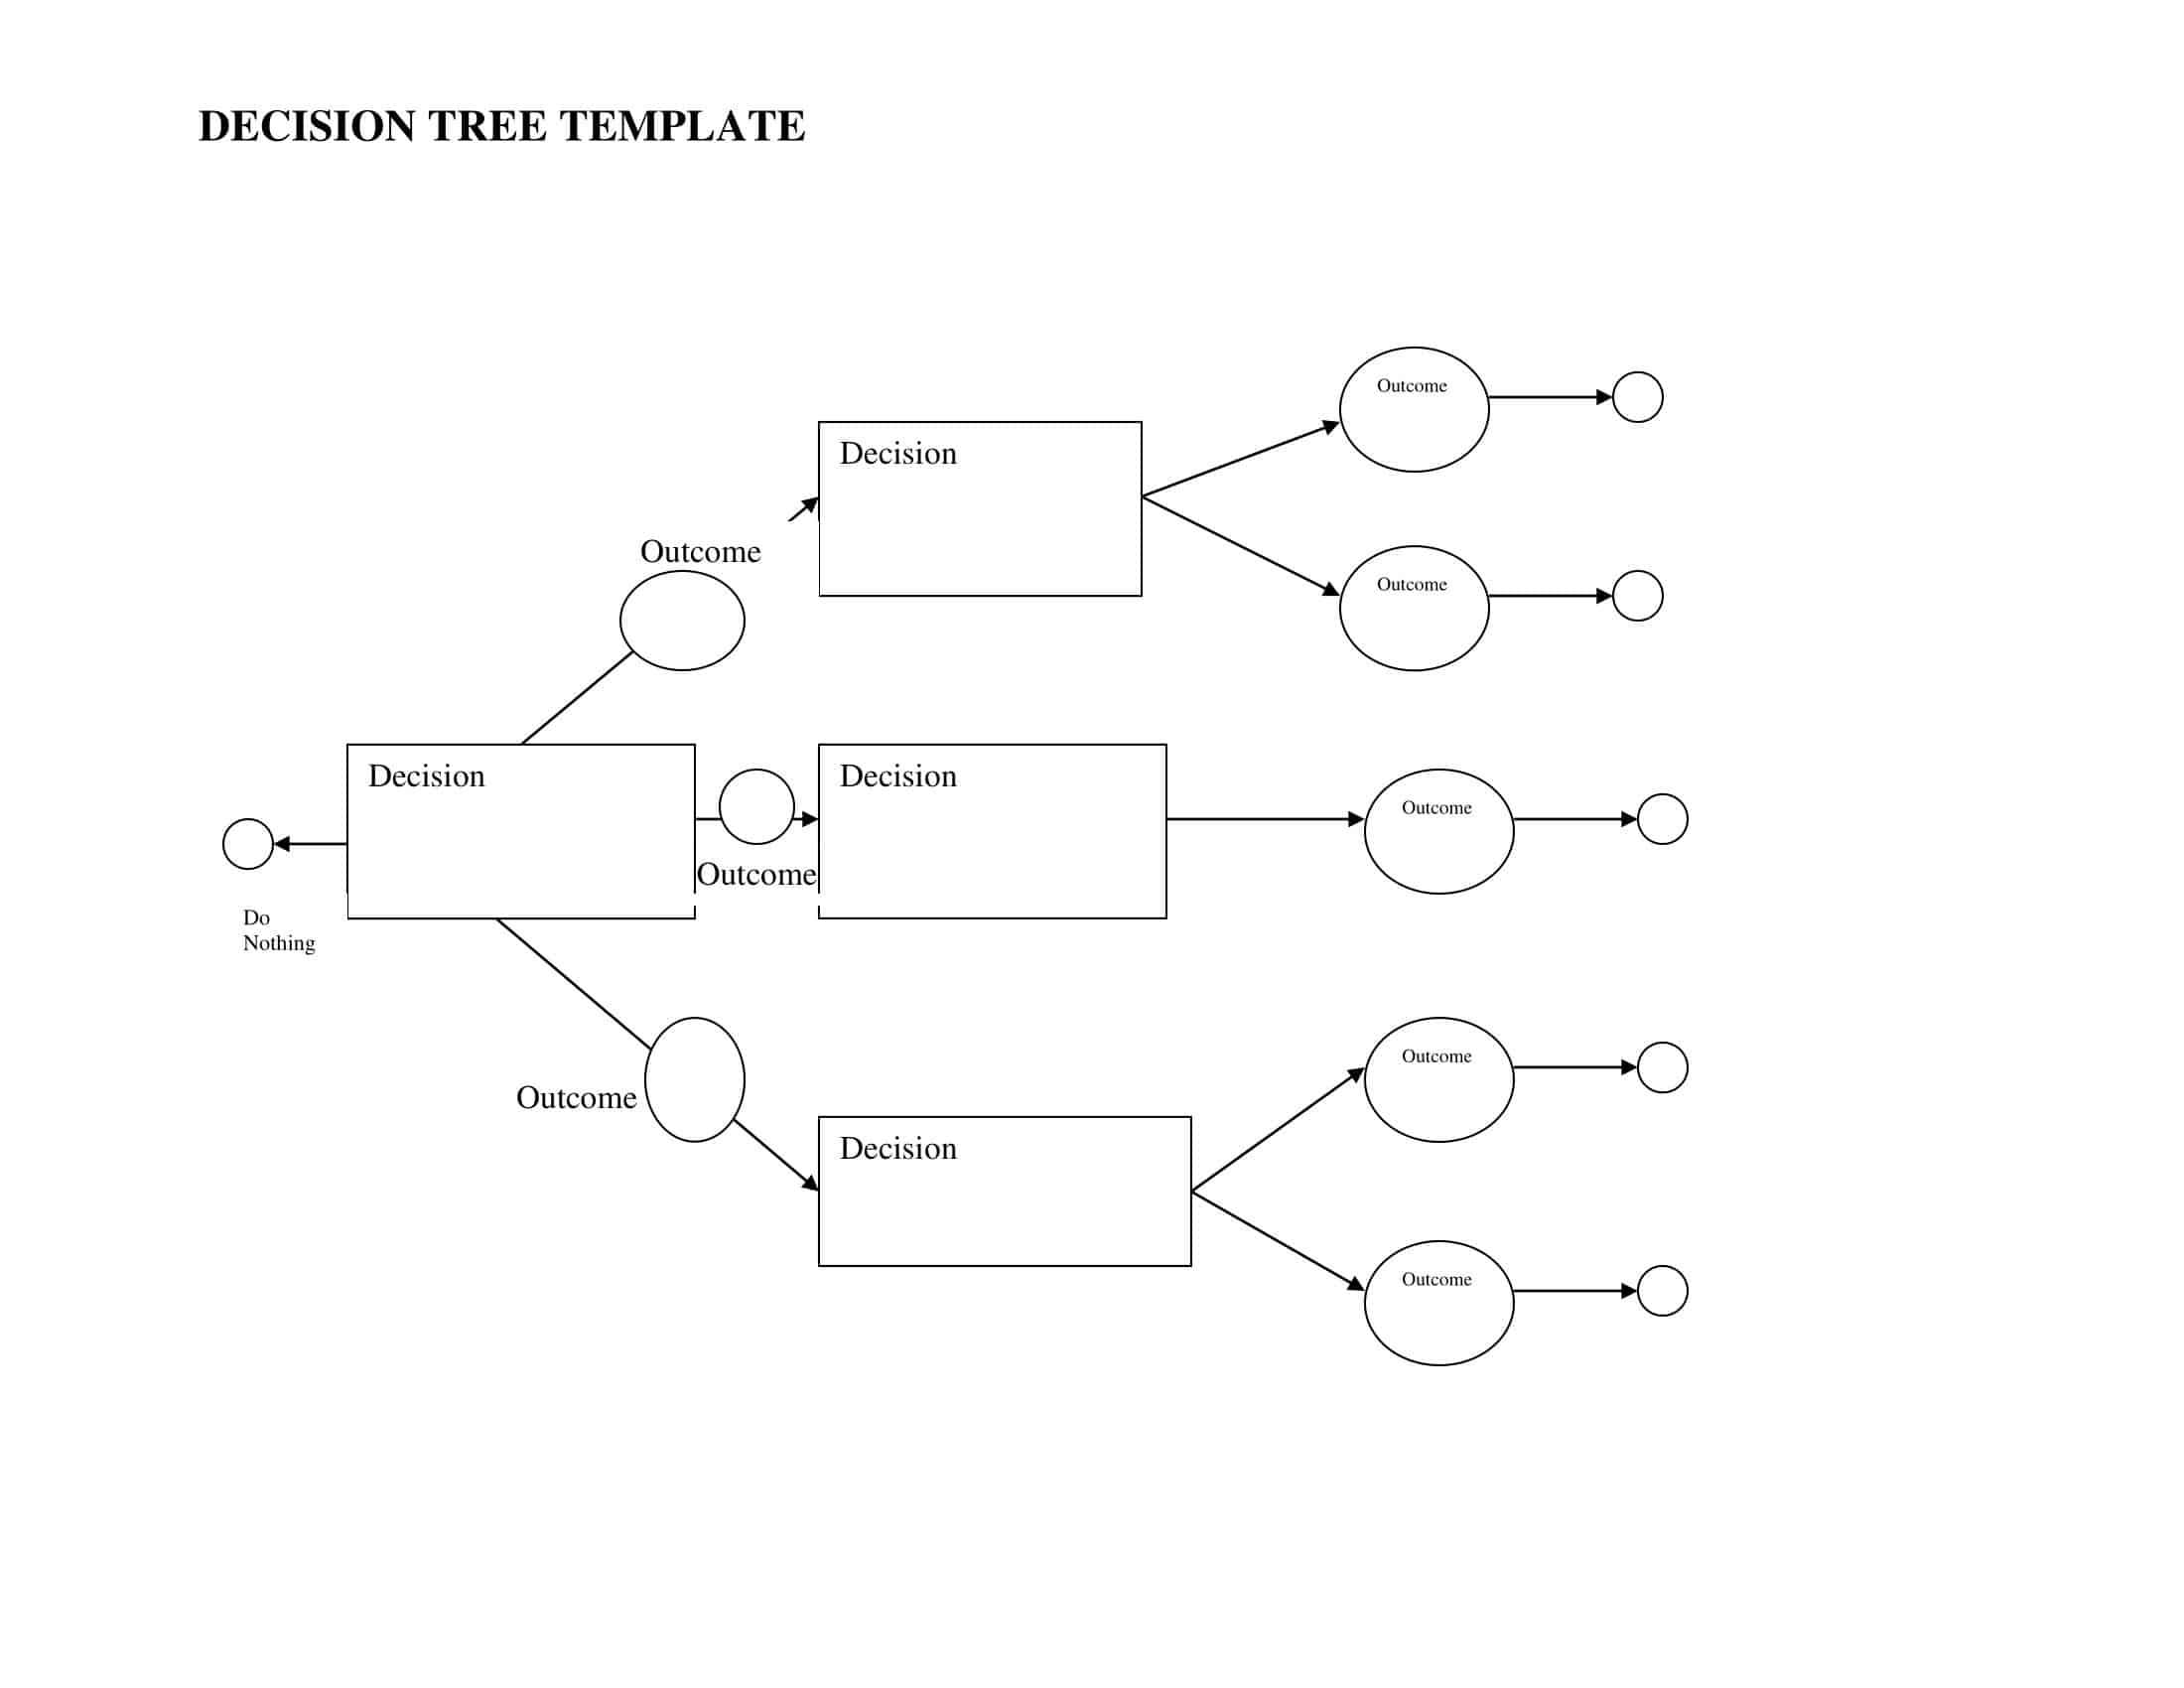
Decision Tree Templates are visual representations of potential outcomes or decisions in a logical, hierarchical layout. They are instrumental tools utilized in various industries and areas of study, such as business, machine learning, and medical diagnostics.
Primarily, these templates act as a guide to decision-making processes, allowing individuals or teams to map out each probable outcome of a decision and its subsequent repercussions in an organized, tree-like structure. This structure comprises nodes and branches, each signifying decisions, decision points, or possible outcomes, offering a comprehensive overview of complex scenarios.
The root of the decision tree represents the initial decision or the primary problem. Each branch stemming from this root symbolizes a potential decision or outcome that can be made. These branches may further bifurcate into additional branches, showcasing different scenarios or options resulting from the prior decision. The end of each branch, the leaves, signifies the final outcomes.
Why should you make a decision tree?
Decision trees are valuable tools in decision-making processes, data analysis, machine learning, and artificial intelligence because they allow us to approach problems in a structured and systematic way. Here are some reasons why you should consider making a decision tree, along with a guide on how to do so:
Simplicity and Interpretability
Decision trees are straightforward and intuitive, making them easy to understand and interpret. They provide a clear visualization of multiple potential outcomes, which can aid in communication and decision-making.
Versatility
Decision trees can handle both categorical and numerical data, and they can be used for both regression and classification tasks. This makes them useful in a wide variety of applications.
Non-parametric nature
They don’t make assumptions about the space distribution and the classifier structure, which makes them flexible and powerful.
Implicit Feature Selection
Decision trees give higher priority to the most important variables (features), providing an implicit form of feature selection.
Key elements of a decision tree
A Decision Tree is composed of several key elements that contribute to its functionality and utility. Understanding these elements is critical for proper interpretation and usage of Decision Trees in various domains, especially in decision analysis and machine learning.
Here’s a general look into the key elements of a Decision Tree:
Root Node
This is the topmost node of the tree that corresponds to the best predictor or the most important feature, according to which initial splitting of the dataset happens. The determination of the root node is based on a chosen metric such as entropy and information gain for classification problems, or variance reduction for regression problems.
Decision Nodes
Also known as internal nodes, these represent the features or attributes on which the data will be split. The number of outgoing edges from a decision node equals the number of possible values that the feature can take. Decision nodes are chosen based on the attribute selection measures which could include Gini Index, Chi-Square, Information Gain, and Gain Ratio, among others.
Branches
These are the edges or links that stem from a decision node, representing an outcome of the test on that node. They connect the decision nodes and the leaf nodes. Each branch typically corresponds to the possible values that a selected attribute can take.
Leaf Nodes
Also known as terminal nodes or end nodes, these nodes contain the final output or decision (class label or regression value) and do not contain any further splits. In other words, they represent the final outcomes or decisions based on the path taken from the root node.
Splitting
This is the process of dividing a node into two or more sub-nodes to create more branches in the tree. Splitting is based on certain conditions, aiming to create purer nodes with similar data points.
Pruning
This is the process of removing the unnecessary structure from a decision tree to make it more robust and to avoid the problem of overfitting. Pruning techniques can be pre-pruning (stop growing the tree earlier) or post-pruning (allowing the tree to fully grow first and then trimming it).
Parent and Child Nodes
In any decision tree, a node that is divided into sub-nodes is called a parent node of sub-nodes whereas sub-nodes are the child of a parent node.
Entropy
This is a measure of the impurity, disorder or uncertainty in the data. It is used to decide how a Decision Tree can split the data.
Information Gain
This is the reduction in entropy or impurity after a dataset is split on an attribute. Decision Trees always try to maximize Information Gain.
Gini Index
This is a metric to measure how often a randomly chosen element would be incorrectly identified. It means an attribute with a lower Gini index would be preferred.
Advantages and Disadvantages of Decision Tree
In the dynamic, high-stakes field of project management, the capacity to make well-informed, strategic decisions swiftly is of paramount importance. Here, Decision Trees serve as powerful instruments, offering visual, intuitive structures that unravel the complexity of decision-making processes.
They help evaluate risk, cost, and benefits associated with project decisions and allow project managers to explore multiple alternatives and outcomes. Nevertheless, like all tools, Decision Trees come with their own set of advantages and limitations.
Advantages of Decision Trees in Project Management
Transparent Decision-Making: Decision Trees provide a visual and transparent method for considering different courses of action. They illustrate the full range of possible outcomes and the associated risks in a single view, which can facilitate discussions with stakeholders and team members.
- Complex Problem Simplification: They assist in breaking down complex decisions into simpler, more manageable parts. This helps in better understanding the problem and making more informed and reasoned decisions.
- Risk Evaluation: Decision Trees are excellent tools for risk evaluation and mitigation. They highlight paths with high uncertainty or risk, allowing project managers to identify and prepare for potential issues in advance.
- Cost-Benefit Analysis: By assigning costs and benefits to different paths, Decision Trees enable a robust cost-benefit analysis. This aids in aligning project decisions with financial objectives and constraints.
- Multiple Decision Path Exploration: They allow exploration of multiple decision paths and their potential outcomes, offering a holistic view of the possible scenarios that could emerge from a decision.
- Versatility: Decision Trees are applicable across various types of decisions in project management, from resource allocation, risk mitigation strategies, to major strategic decisions.
Disadvantages of Decision Trees in Project Management
- Over-simplification: Decision Trees, while excellent for breaking down complex problems, can sometimes oversimplify situations, especially when the project’s decisions involve intricate interdependencies and feedback loops.
- Inaccurate Assumptions: The quality of a Decision Tree analysis depends on the accuracy of estimates for costs, benefits, and probabilities of different outcomes. Inaccurate assumptions can lead to incorrect decisions.
- Bias: The construction of Decision Trees can be subject to biases, especially when probabilities are estimated based on personal judgment rather than robust data.
- Limited Scope: Decision Trees might not be suitable for decisions that have a long time horizon or those involving continuous variables due to the difficulty in accurately predicting far-future events or capturing the nuances of continuous variables.
- Static Analysis: Decision Trees do not account for future unknowns that can emerge as a project evolves. They are not designed to adjust or adapt to new information that wasn’t available during the initial construction of the tree.
How to create a decision tree
Creating a Decision Tree involves several steps, from understanding the problem to visualizing and interpreting the results. Here’s a detailed step-by-step guide on how to create a Decision Tree, with examples provided at each step:
Step 1: Define the Problem
Start by clearly identifying the problem you want to solve. This could be a decision you need to make or a prediction you want to carry out.
Example: Let’s say you’re a project manager trying to decide whether to take on a new project. The problem here would be “Should we take on this new project?”
Step 2: Identify the Decisions or Choices
Identify the possible decisions or choices you can make in response to the problem. Each of these decisions will form a branch in your decision tree.
Example: For our project scenario, the possible decisions could be “Take the project” and “Don’t take the project.”
Step 3: Identify Possible Outcomes
For each decision or choice, identify the possible outcomes. These will also form branches in your decision tree.
Example: If we decide to take the project, the possible outcomes could be “Project is successful” or “Project is not successful.” If we decide not to take the project, the possible outcome would be “No change.”
Step 4: Assign Probabilities
For each possible outcome, assign a probability. This is an estimate of the likelihood of each outcome occurring.
Example: Based on past data, we might assign a 70% probability to the project being successful and a 30% probability to it not being successful. If we don’t take the project, there is a 100% probability of no change.
Step 5: Assign Costs or Payoffs
For each possible outcome, assign a cost or payoff. This is an estimate of what each outcome will cost you, or what you will gain from it.
Example: If the project is successful, we might gain $500,000 in profit. If the project is not successful, we might lose $200,000. If there is no change, our cost or payoff is $0.
Step 6: Calculate Expected Values
For each decision, calculate the expected value. This is done by multiplying the probability of each outcome by its cost or payoff, and then summing these values.
Example: For “Take the project”, the expected value would be (0.7 * $500,000) + (0.3 * -$200,000) = $290,000. For “Don’t take the project”, the expected value is $0.
Step 7: Make the Decision
Choose the decision with the highest expected value.
Example: Since $290,000 is greater than $0, we would choose to take the project.
Step 8: Create the Decision Tree
Now that you have all the necessary information, you can create the decision tree. Start with the problem or decision at the left, then draw branches for decisions, outcomes, and end nodes representing the final outcomes. Label each branch with the decision, outcome, probability, and cost or payoff.
Example: Your decision tree might start with the problem “New Project?” branching into “Take” and “Don’t Take”. “Take” then branches into “Successful” (0.7 probability, $500,000 payoff) and “Not Successful” (0.3 probability, -$200,000 cost).
Step 9: Review and Update
After making the decision, it’s important to review and update your decision tree as new information becomes available. This can help improve the accuracy of future decisions.
Example: After the project has been completed, you could update the probabilities and payoffs based on the actual results. If the project was successful, for instance, you could update the probability of success for similar future projects. Or, if the payoff was different than expected, you could adjust that value as well.
Step 10: Visualize and Interpret
Visualize the decision tree using diagrams and interpret the results. The visualization can help you and others understand the decision-making process and the different factors involved.
Example: After drawing the decision tree, you can see that choosing to “Take the project” has a higher expected value, given the probabilities and payoffs you assigned. This visualization also clearly shows the different potential outcomes and their probabilities.
Creating a decision tree can be a helpful way to make complex decisions more manageable, by breaking them down into smaller, sequential decisions. It also allows you to incorporate uncertainty into your decision-making process, by assigning probabilities to different outcomes.
However, remember that the quality of your decision tree is only as good as the data you put into it. It’s important to use reliable data for probabilities and payoffs, and to update these values as new information becomes available.
Decision tree analysis example
Scenario:
Let’s say you are a business owner considering launching a new product. You have two choices – to conduct a market research study before the launch or to proceed directly with the launch. The market research study will cost $20,000. If the study results are positive, you expect a profit of $100,000 from the product. If the results are negative, you’ll scrap the idea, incurring no additional costs. If you launch the product directly, and it succeeds, you predict a profit of $80,000. However, if the product fails, you expect a loss of $50,000.
Step-by-Step Decision Tree Analysis:
Step 1: Define the problem – The problem is whether to conduct market research before launching the product or launch it directly.
Step 2: Identify decisions or choices – The choices are “Conduct Market Research” and “Direct Launch.”
Step 3: Identify possible outcomes – For “Conduct Market Research,” the outcomes are “Positive Results” and “Negative Results.” For “Direct Launch,” the outcomes are “Success” and “Failure.”
Step 4: Assign Probabilities – Let’s assume that you estimate there’s a 60% chance the market research will yield positive results, and a 40% chance for negative results. If you launch directly, based on your past experience, there’s a 50% chance of success and a 50% chance of failure.
Step 5: Assign Costs or Payoffs – The cost of market research is $20,000. If it gives positive results, you expect a net profit of $100,000 (overall gain of $80,000 after subtracting research cost). If it’s negative, you decide not to launch the product and just incur the cost of the study, i.e., a loss of $20,000. For the direct launch, a successful product leads to a profit of $80,000, and a failed product causes a loss of $50,000.
Step 6: Calculate Expected Monetary Value (EMV) – The EMV for each decision is calculated by multiplying the payoffs by their respective probabilities and summing them.
- For “Conduct Market Research”:
- EMV = (0.6 * $80,000) + (0.4 * -$20,000) = $48,000 – $8,000 = $40,000
- For “Direct Launch”:
- EMV = (0.5 * $80,000) + (0.5 * -$50,000) = $40,000 – $25,000 = $15,000
Step 7: Make the Decision – Based on the EMVs, the better decision would be to conduct market research before launching the product since it has a higher EMV ($40,000 vs. $15,000).
Step 8: Create the Decision Tree – The decision tree would start with the problem “New Product Launch?” branching into “Conduct Market Research” and “Direct Launch”. “Conduct Market Research” then branches into “Positive Results” (0.6 probability, $80,000 payoff) and “Negative Results” (0.4 probability, -$20,000 cost). “Direct Launch” branches into “Success” (0.5 probability, $80,000 payoff) and “Failure” (0.5 probability, -$50,000 cost).
Step 9: Review and Update – After you’ve conducted the research and made your decision about the product launch, you would then review and update your decision tree based on the results.
FAQs
How does a Decision Tree work?
A Decision Tree works by splitting a data set based on different conditions, creating branches (decisions), and nodes (outcomes). It continues to split the data until it reaches a condition where it cannot go any further, resulting in a leaf node, or a decision.
When is it appropriate to use a Decision Tree?
It’s appropriate to use a Decision Tree when making decisions that have multiple possible options and outcomes. They are particularly useful when the relationships between variables are not linear, when you want to understand the decision-making process, or when you want to conduct cost-benefit analysis.
What is a Decision Tree in Machine Learning?
In Machine Learning, a Decision Tree is a type of supervised learning algorithm that is mostly used in classification problems. It works by creating a model that predicts the value of a target variable by learning simple decision rules inferred from the data features.
What is the difference between random forests and Decision Trees?
A Decision Tree is a predictive model that maps features to conclusions about target values. A Random Forest, on the other hand, is an ensemble learning method that operates by constructing multiple Decision Trees and outputting the class that is the mode of the classes or mean prediction of the individual trees.
How are Decision Trees used in business?
Decision Trees are used in business for a variety of purposes, including decision analysis, strategic planning, and resource allocation. They are particularly useful in situations where complex business decisions need to be made, taking into account multiple possible outcomes, uncertain events, and competing alternatives.
What is information gain in Decision Trees?
Information gain is a statistical property that measures how well a given attribute separates the training examples according to their target classification. The attribute with the highest information gain is considered the best for making a decision.
What is ID3 algorithm in Decision Trees?
ID3 (Iterative Dichotomiser 3) is an algorithm used to generate a Decision Tree from a dataset, invented by Ross Quinlan. ID3 is the precursor to the C4.5 algorithm, and is typically used in the machine learning and natural language processing domains.
Are Decision Trees sensitive to outliers?
Yes, Decision Trees can be sensitive to outliers. Since each split in a Decision Tree is based on a single feature at a threshold, an outlier could potentially alter that threshold significantly.
What is a binary Decision Tree?
A binary Decision Tree is a type of Decision Tree in which each parent node splits into exactly two child nodes. This type of Decision Tree is commonly used in algorithms such as CART.
Are Decision Trees good for regression?
Yes, Decision Trees can be used for regression tasks, where they are known as Regression Trees. Regression Trees predict a numerical value instead of a categorical value.









![Free Printable Food Diary Templates [Word, Excel, PDF] 1 Food Diary](https://www.typecalendar.com/wp-content/uploads/2023/05/Food-Diary-1-150x150.jpg 150w, https://www.typecalendar.com/wp-content/uploads/2023/05/Food-Diary-1-1200x1200.jpg 1200w)
![Free Printable Credit Card Authorization Form Templates [PDF, Word, Excel] 2 Credit Card Authorization Form](https://www.typecalendar.com/wp-content/uploads/2023/06/Credit-Card-Authorization-Form-150x150.jpg)
![Free Printable Stock Ledger Templates [Excel,PDF, Word] 3 Stock Ledger](https://www.typecalendar.com/wp-content/uploads/2023/08/Stock-Ledger-150x150.jpg)
