Untangling the complex intricacies of any given process often requires a visual guide, a map that provides clarity amidst possible confusion. Cue in the indispensable tool known as the Process Flow Chart. With its symbology and directional arrows, it meticulously unravels the progression of tasks, decisions, and processes, converting seemingly daunting procedures into comprehensible steps. In this article, we explore the multi-faceted nature of these charts, their myriad applications, and the benefits they offer to various industries, from manufacturing and business to software development and healthcare.
Table of Contents
What is a process flow chart?

A Process Flow Chart, sometimes known as a process flow diagram, is a graphical representation used to illustrate the step-by-step progression of a procedure or system. This tool employs standardized symbols and shapes to depict the various stages involved in the process, the sequence of operations, the people or departments involved, and the flow of data or materials.
For instance, consider a book publishing process. A flow chart for this would include sequential steps such as manuscript submission, initial review, editorial process, layout and design, printing, and distribution. Each of these steps would be linked with arrows indicating the direction of process flow, and decision points (such as approval or rejection of the manuscript) might be depicted with diamond-shaped symbols. Through this visual medium, complex procedures become more comprehensible, enhancing decision-making, coordination, and efficiency.
Process Flow Chart Templates
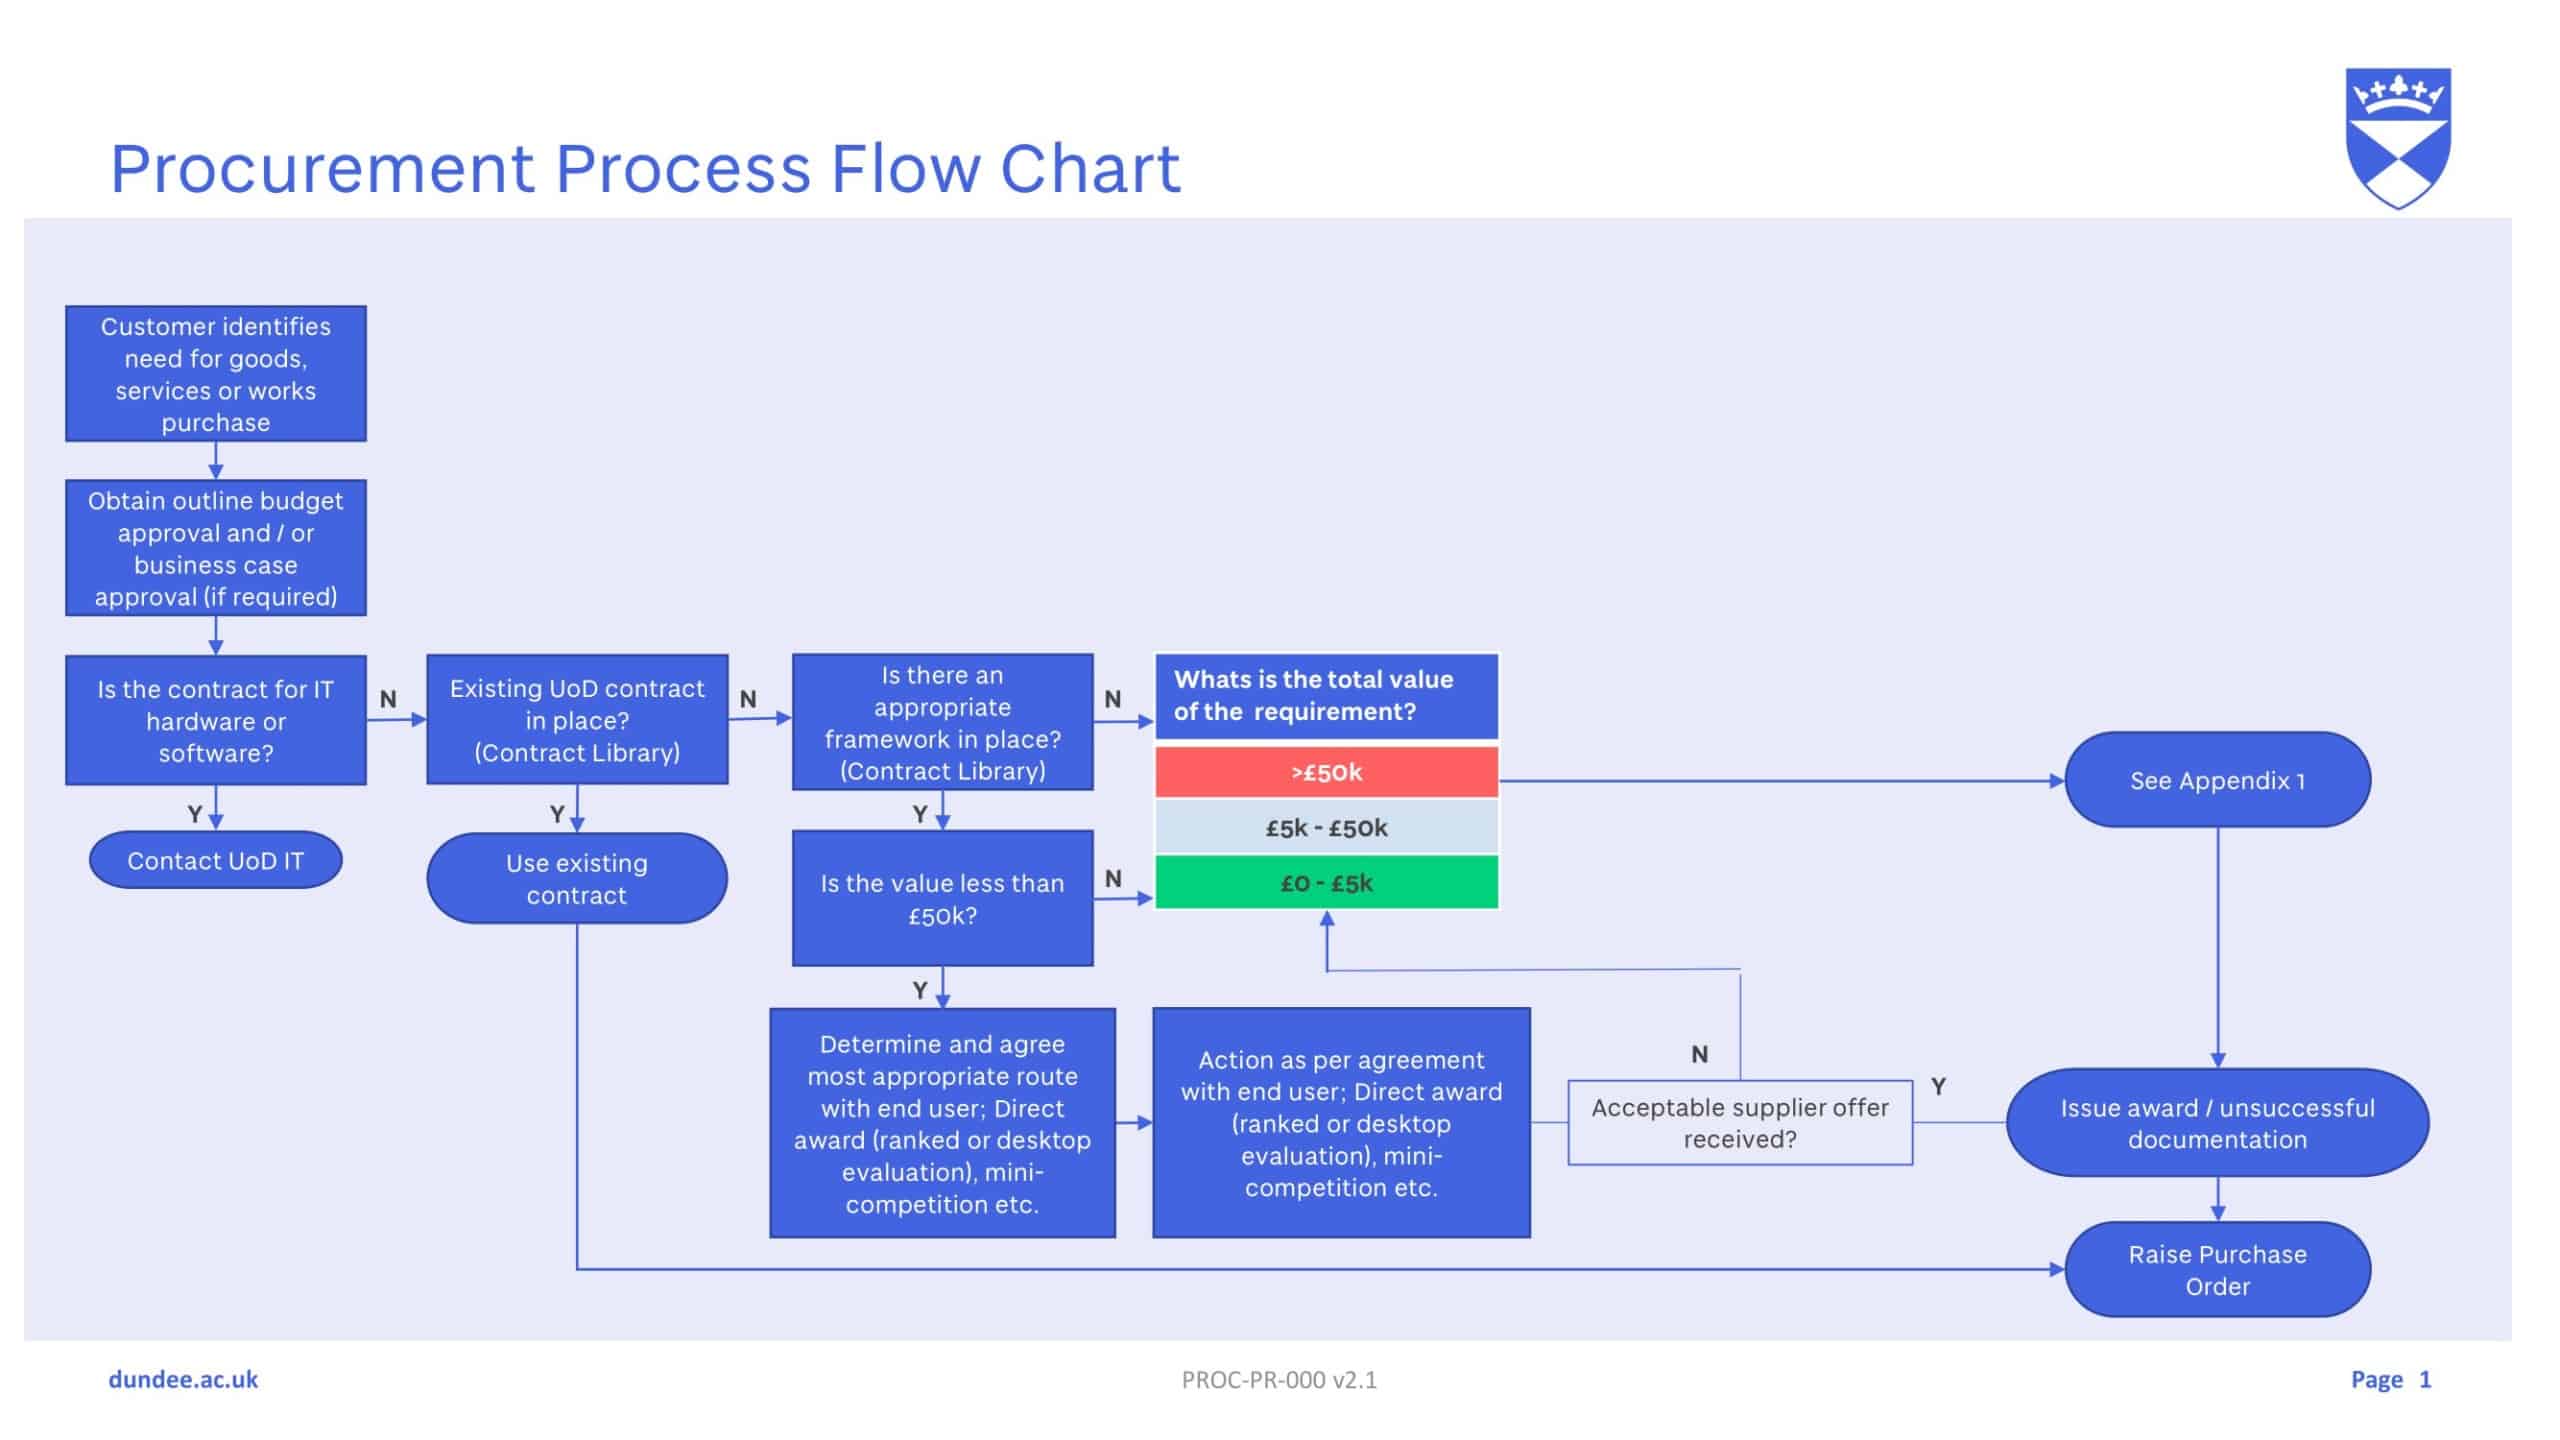
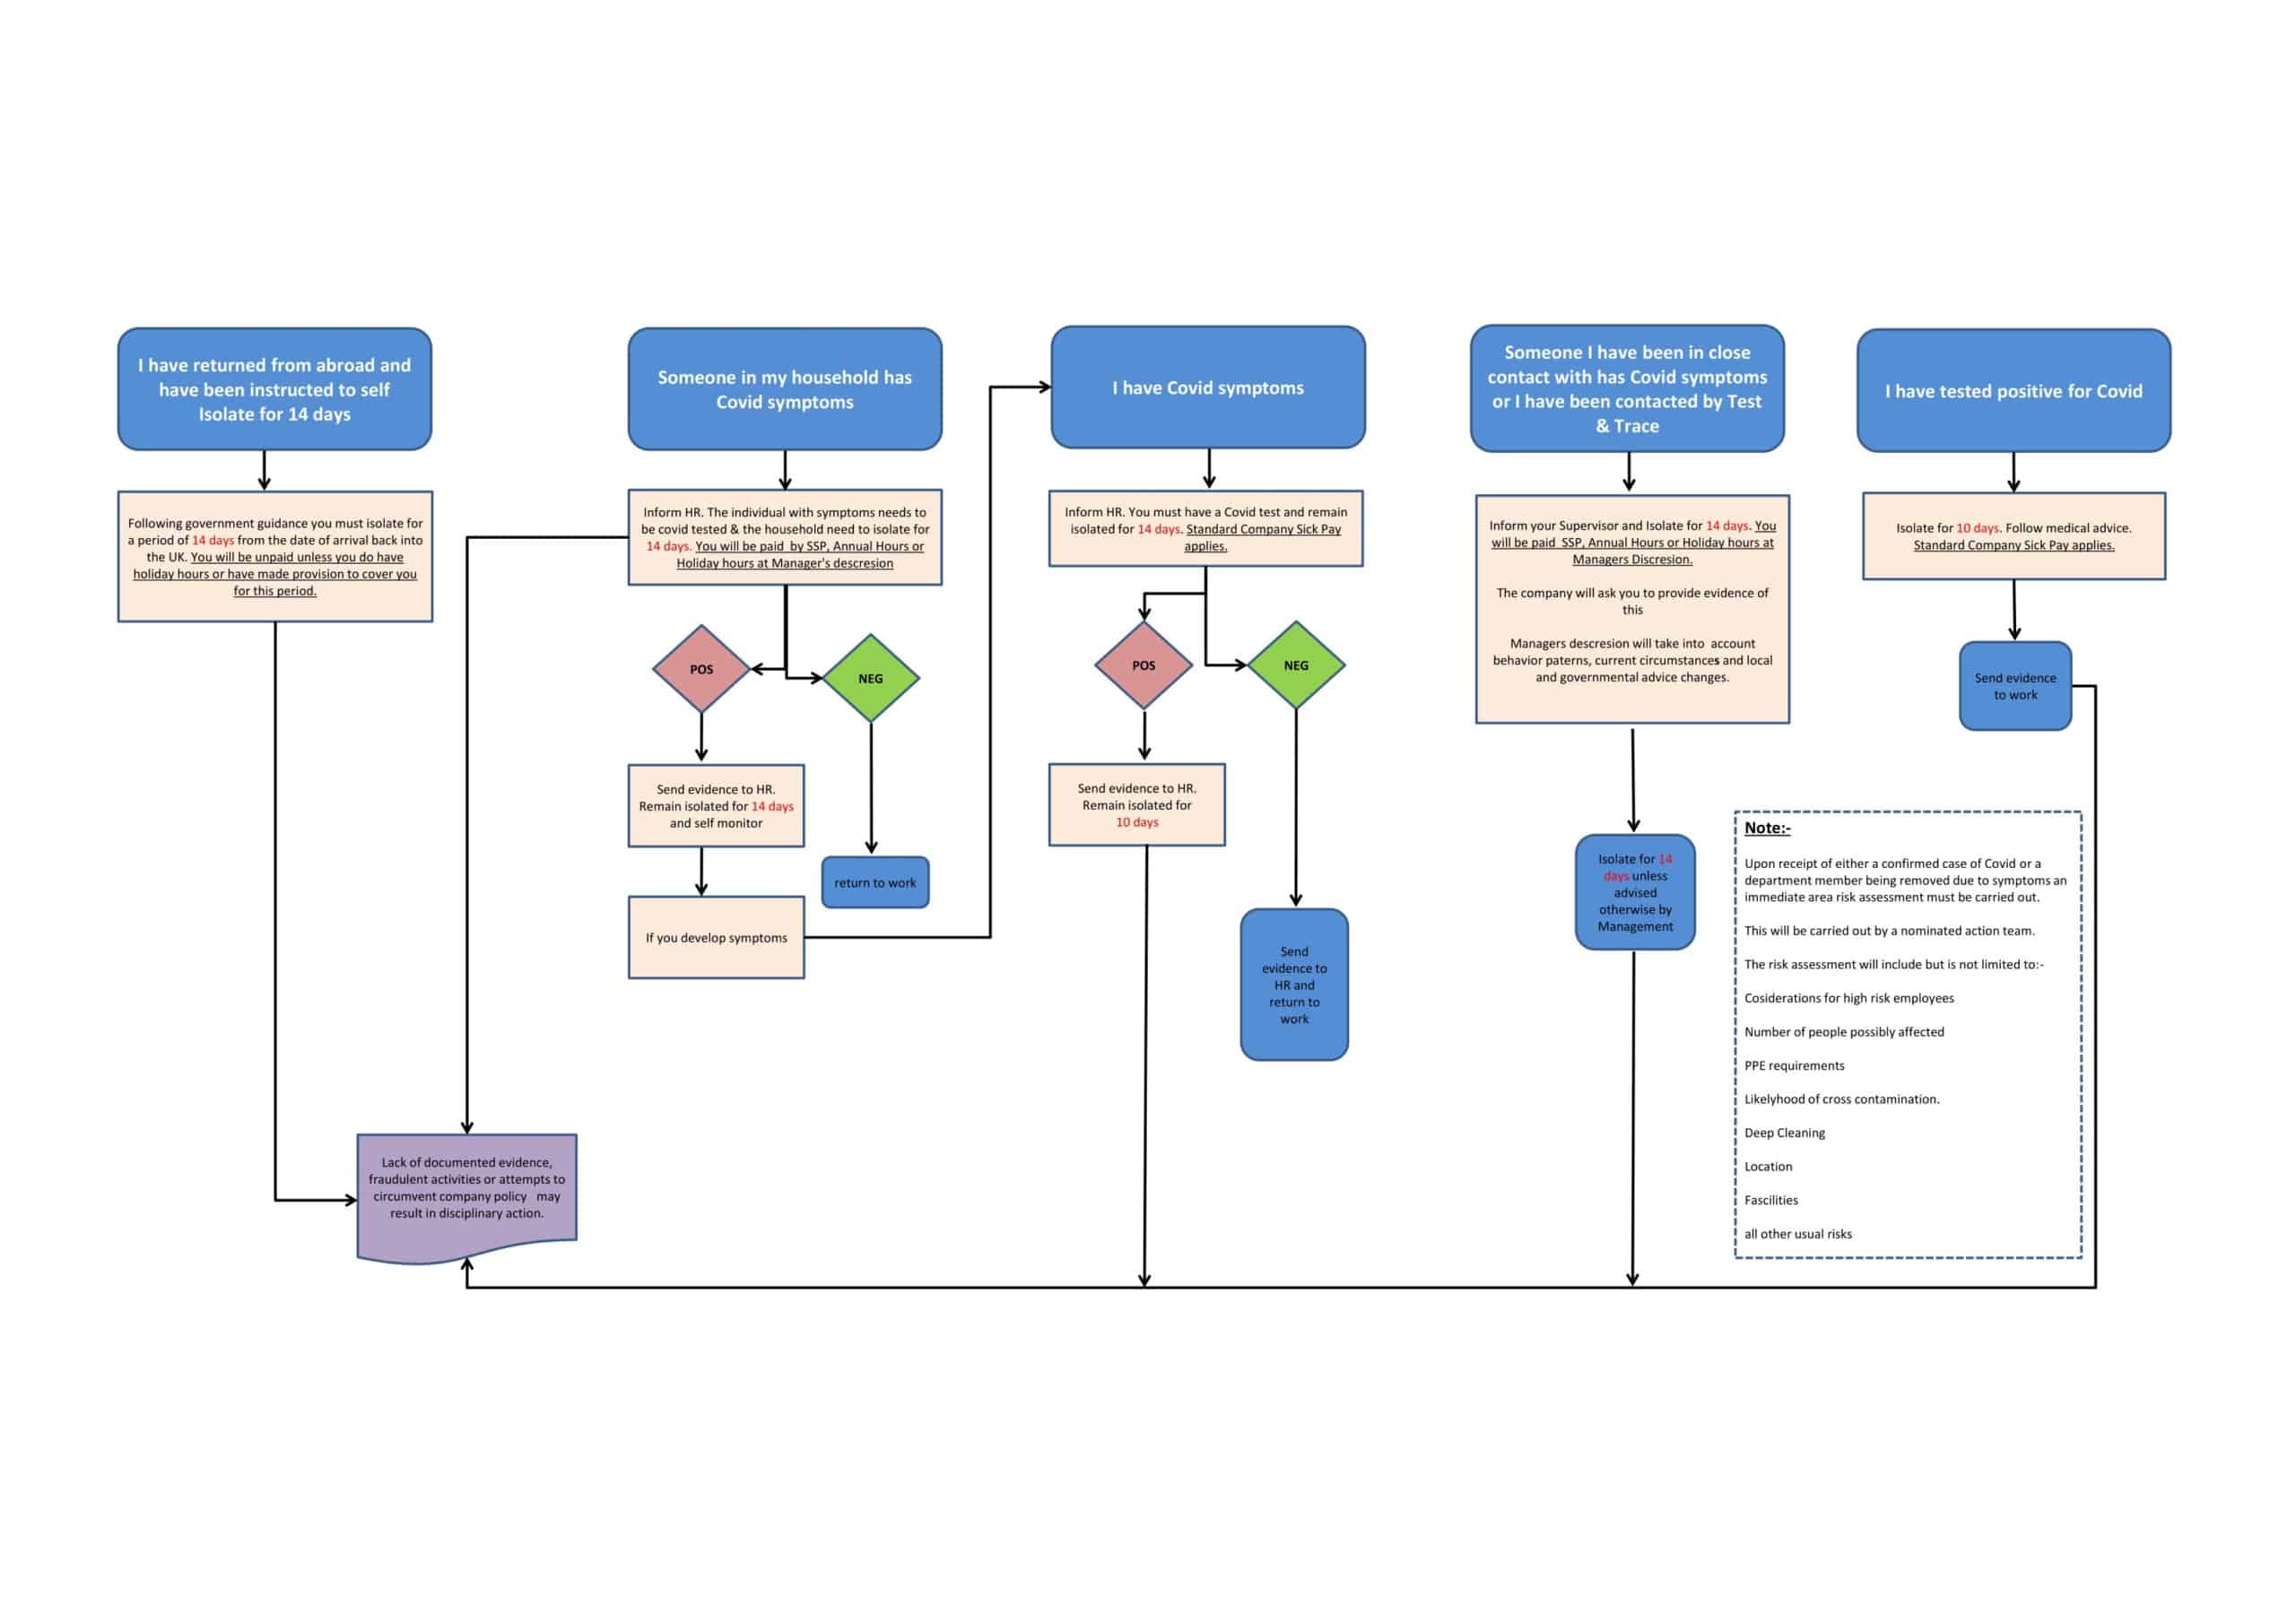
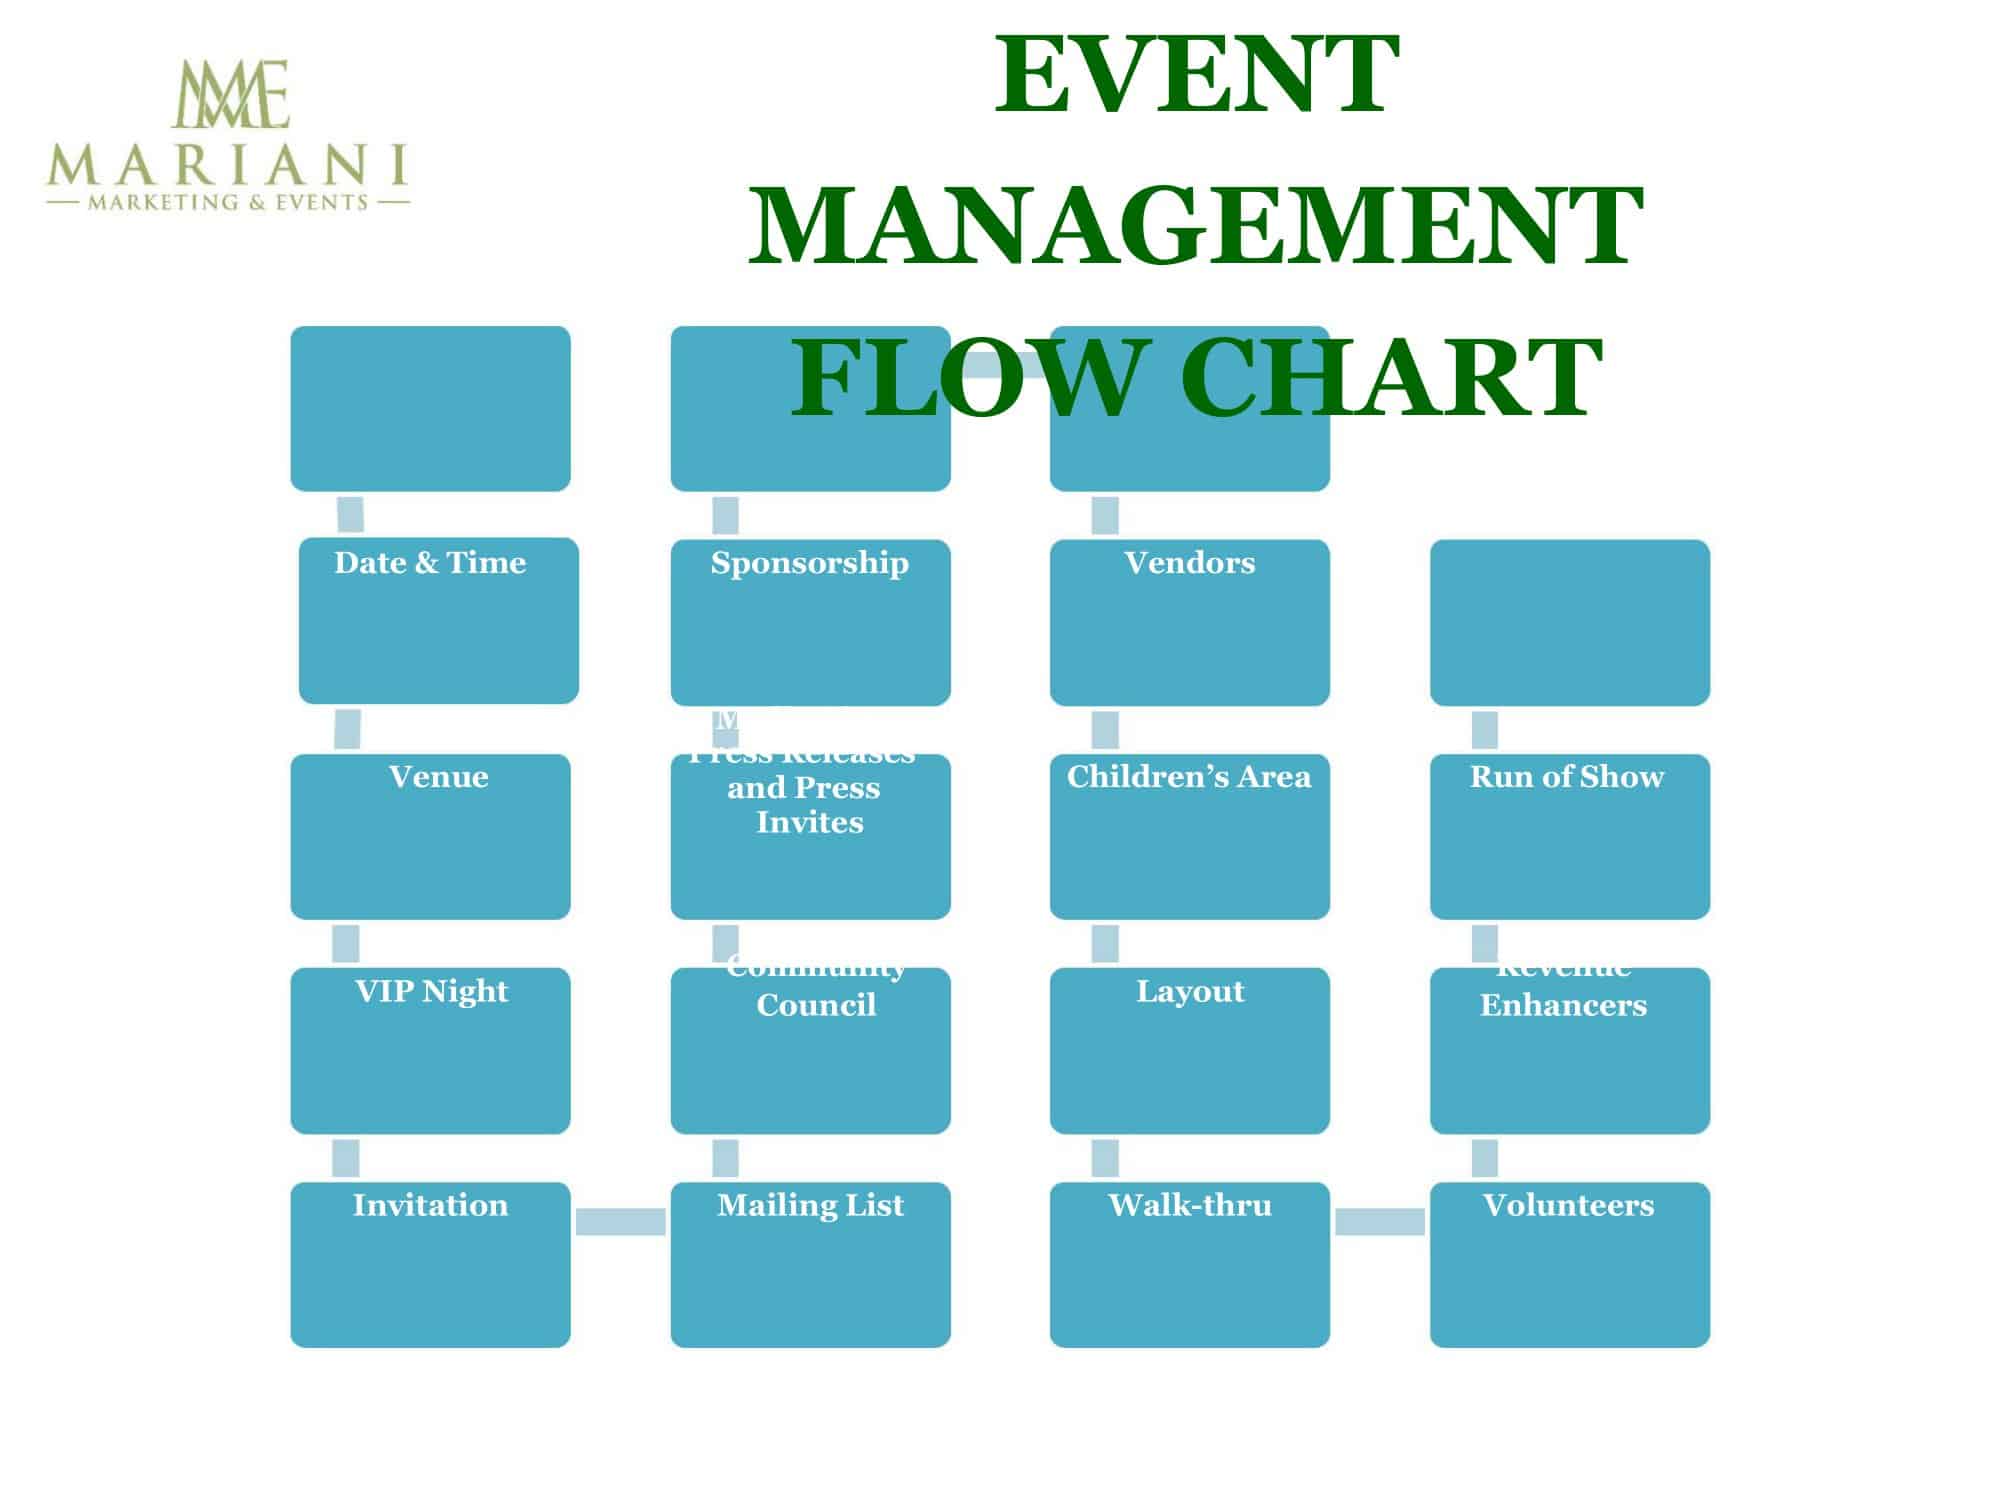
Documenting process flows is vital for analyzing procedures and systems. Process flow charts illustrate sequences visually using standard symbols. Process flow chart templates provide ready-made chart layouts to quickly create flow charts.
The templates contain commonly used process mapping shapes like ovals, arrows, diamonds, and rectangles. Lines and text boxes show sequence and flow direction. Templates auto-populate shapes when inserted, saving time over manual formatting. Some allow adding process details or color coding activities.
Process flow chart templates enable users to map flows by simply dragging and dropping shapes into the template. Details can be easily modified as processes change. Using templates alleviates the burden of manually designing flow chart aesthetics. With intuitive templates, businesses can improve processes by documenting current states, highlighting pain points, and brainstorming optimizations. Whether mapping business systems or personal workflows, process flow chart templates get users up and running fast.
Why do you need a process flow chart?
The use of a Process Flow Chart can offer a range of benefits across a multitude of scenarios. Here are some of the main reasons why Process Flow Charts are essential tools in various fields:
- Simplification of Complex Processes: A flow chart helps in breaking down complex processes into simple, understandable stages. By visually laying out the steps, a flow chart makes it easier for anyone involved to understand the entirety of the process, thereby reducing confusion and ambiguity.
- Visualize the Flow of Steps: Process flow charts allow users to easily visualize the sequence of steps or actions that make up a process. This enables people to see at a glance how the process moves from one stage to the next, which is particularly useful in understanding multi-step processes or workflows.
- Identify Bottlenecks and Potential Issues: A well-designed flow chart can help identify bottlenecks, inefficiencies, and potential issues in a process. These could include unnecessary steps, unproductive loops, or points where the process may slow down due to dependencies. Once identified, these can be addressed to improve the efficiency of the process.
- Standardization of Processes: Flow charts can be used to ensure that everyone follows the same process. This is particularly beneficial in larger organizations where multiple people or teams may be involved in the same process. By providing a standardized guideline, flow charts ensure consistency and uniformity in process execution.
- Improved Communication and Collaboration: Flow charts are an excellent communication tool. They provide a visual language that can be understood by all, irrespective of their role or level in the organization. By providing a common reference point, they facilitate better collaboration between teams and departments.
- Effective Training Resource: For new employees or team members, a flow chart serves as an effective training resource. It provides a clear picture of the workflow, making it easier for newcomers to understand their roles and responsibilities within the process.
- Aid in Process Analysis and Improvement: Flow charts can be used as a tool for process analysis and continuous improvement. By laying out the process visually, they make it easier to identify areas for improvement, test changes, and measure the impact of those changes.
- Facilitate Decision Making: In some processes, decisions need to be made at various points. Flow charts can help map out these decision points, highlighting where they occur and what action should be taken depending on the decision made.
- Compliance and Documentation: Flow charts also serve as a means of documenting processes, which can be important for compliance with various regulatory standards. They provide a clear, visual representation of the process as it is supposed to be carried out, which can be easily reviewed by auditors or regulatory bodies.
As an example, consider a customer service department in a company. A flow chart for handling customer complaints could begin with the receipt of the complaint, followed by categorization, assignment to a customer service agent, resolution process, and finally feedback collection. This chart would enable everyone in the department to understand the process, ensure consistency in handling complaints, quickly identify any issues or bottlenecks, and provide a clear reference for training new team members.
When to use a process flowchart
The use of a process flowchart can be applicable and advantageous in a multitude of scenarios, spanning various industries and departments. Here are some instances where implementing a process flowchart can significantly contribute to the efficiency and clarity of operations:
Understanding and Documenting a Process
Process flowcharts are often used when there’s a need to understand the intricacies of a complex process. They can break down the process into individual steps, illustrating how each part interacts with the others. This can be particularly beneficial in situations where a process is being documented for the first time or if the process is too complex to be described in a text format.
Improving a Process
If a process isn’t functioning as efficiently as it could, a flowchart can be invaluable. It allows users to visualize the process and makes it easier to identify bottlenecks, redundancies, or unnecessary steps. By removing or streamlining these parts of the process, the overall operation can be significantly improved.
Standardizing a Process
In large organizations or industries where standardization is critical, process flowcharts serve as the guideline for consistency. They ensure that the process is carried out the same way every time, reducing variation and ensuring a uniform output. This is particularly important in manufacturing or quality control scenarios.
Training Purposes
Flowcharts can serve as a key resource for training new team members or for teaching processes in an educational setting. A flowchart provides a visual representation of the process, making it easier for people to grasp and remember the sequence of steps.
Designing or Modifying a Process
When creating a new process or modifying an existing one, flowcharts can be an effective planning tool. They allow teams to map out the proposed process and visually work through the sequence of steps, making it easier to identify potential issues or inefficiencies before they’re implemented.
Problem Solving and Decision Making
Flowcharts can be used to map out various scenarios in decision making or problem-solving contexts. By visually laying out the possible outcomes and the sequence of steps leading to each, they can help teams choose the most effective course of action.
Compliance and Auditing
In industries where adherence to certain procedures is mandated by law or regulation, process flowcharts serve as an essential tool for demonstrating compliance. They provide a clear, visual explanation of the process which can be reviewed by auditors or regulatory bodies.
Communication
When teams or departments need to collaborate on a project or process, flowcharts can serve as a common language that everyone understands. They can foster better communication, as they clearly delineate roles, responsibilities, and the sequence of actions.
Types and of Flowcharts
Flowcharts are a versatile tool and can be represented in several forms based on their use case. Each type has a specific purpose and is used to represent different kinds of processes or workflows. Here are some of the most common types of flowcharts:
Process Flowchart
The most commonly used type of flowchart, a process flowchart, represents the sequence of steps in a process from start to finish. It utilizes simple geometric shapes to denote different types of actions or steps, and arrows to show the direction or sequence of these steps. Process flowcharts are used in a wide range of industries to document, analyze, and improve workflows.
For example, in a manufacturing setting, a process flowchart might outline the steps to assemble a product, from raw materials intake to the final assembly and quality inspection. Each step would be clearly marked, and the flow of materials through each step would be represented by arrows.
Data Flowchart
Data flowcharts are designed specifically to show the flow of data in a system. They represent how data moves between different parts of a system, such as input, processing, and output. Each process, data store, and external entity is represented by specific symbols, and arrows are used to indicate the flow of data.
For instance, in a software system, a data flowchart might illustrate how user input is processed and converted into output. The chart would show how data moves from the user interface to the backend, where it is processed, stored, or retrieved as needed, and then returned to the user as output.
Swimlane Flowchart
Swimlane flowcharts are used to show who does what in a process. They are called “swimlane” because the chart is divided into lanes, with each lane representing a person, group, or department involved in the process. These flowcharts are particularly useful in complex processes where multiple parties are involved, and it’s crucial to visualize responsibilities clearly.
An example of a swimlane flowchart might be the process for approving and implementing a new project in a business. The chart would have separate lanes for the project manager, team members, senior management, and any other departments involved like finance or legal. Each step of the process is placed in the appropriate lane based on who is responsible for it, making it clear who is responsible for what in the project’s workflow.
Decision Flowchart
Decision flowcharts are specifically designed to represent decision-making processes. They’re typically made up of diamond-shaped decision points with branching arrows that represent different possible outcomes or decisions. These flowcharts are ideal for processes that involve multiple decision points, or for illustrating decision trees in areas like business strategy or software development.
An example of a decision flowchart might be the technical support process in a company. The flowchart would start with the initial customer issue, followed by a series of decision points, such as “Did restarting the device solve the issue?” or “Is the issue hardware-related?”. Each decision point would lead to different paths based on the answer, guiding the support agent through the process of troubleshooting the issue.
Workflow Diagram
While similar to process flowcharts, workflow diagrams specifically focus on the flow of tasks and information between individuals or departments. They’re used to represent the sequence of tasks, who is responsible for each, and how information is passed along.
For example, a workflow diagram in a publishing company could outline the process from manuscript receipt to book publication. It would indicate the various stages—manuscript review, editing, design, printing, and distribution—and show how the manuscript or information about it is passed from one department to another throughout the process.
Flowchart Symbols
| Symbol | Name | Description |
| ▢ | Process | This symbol represents a step or action in the process. |
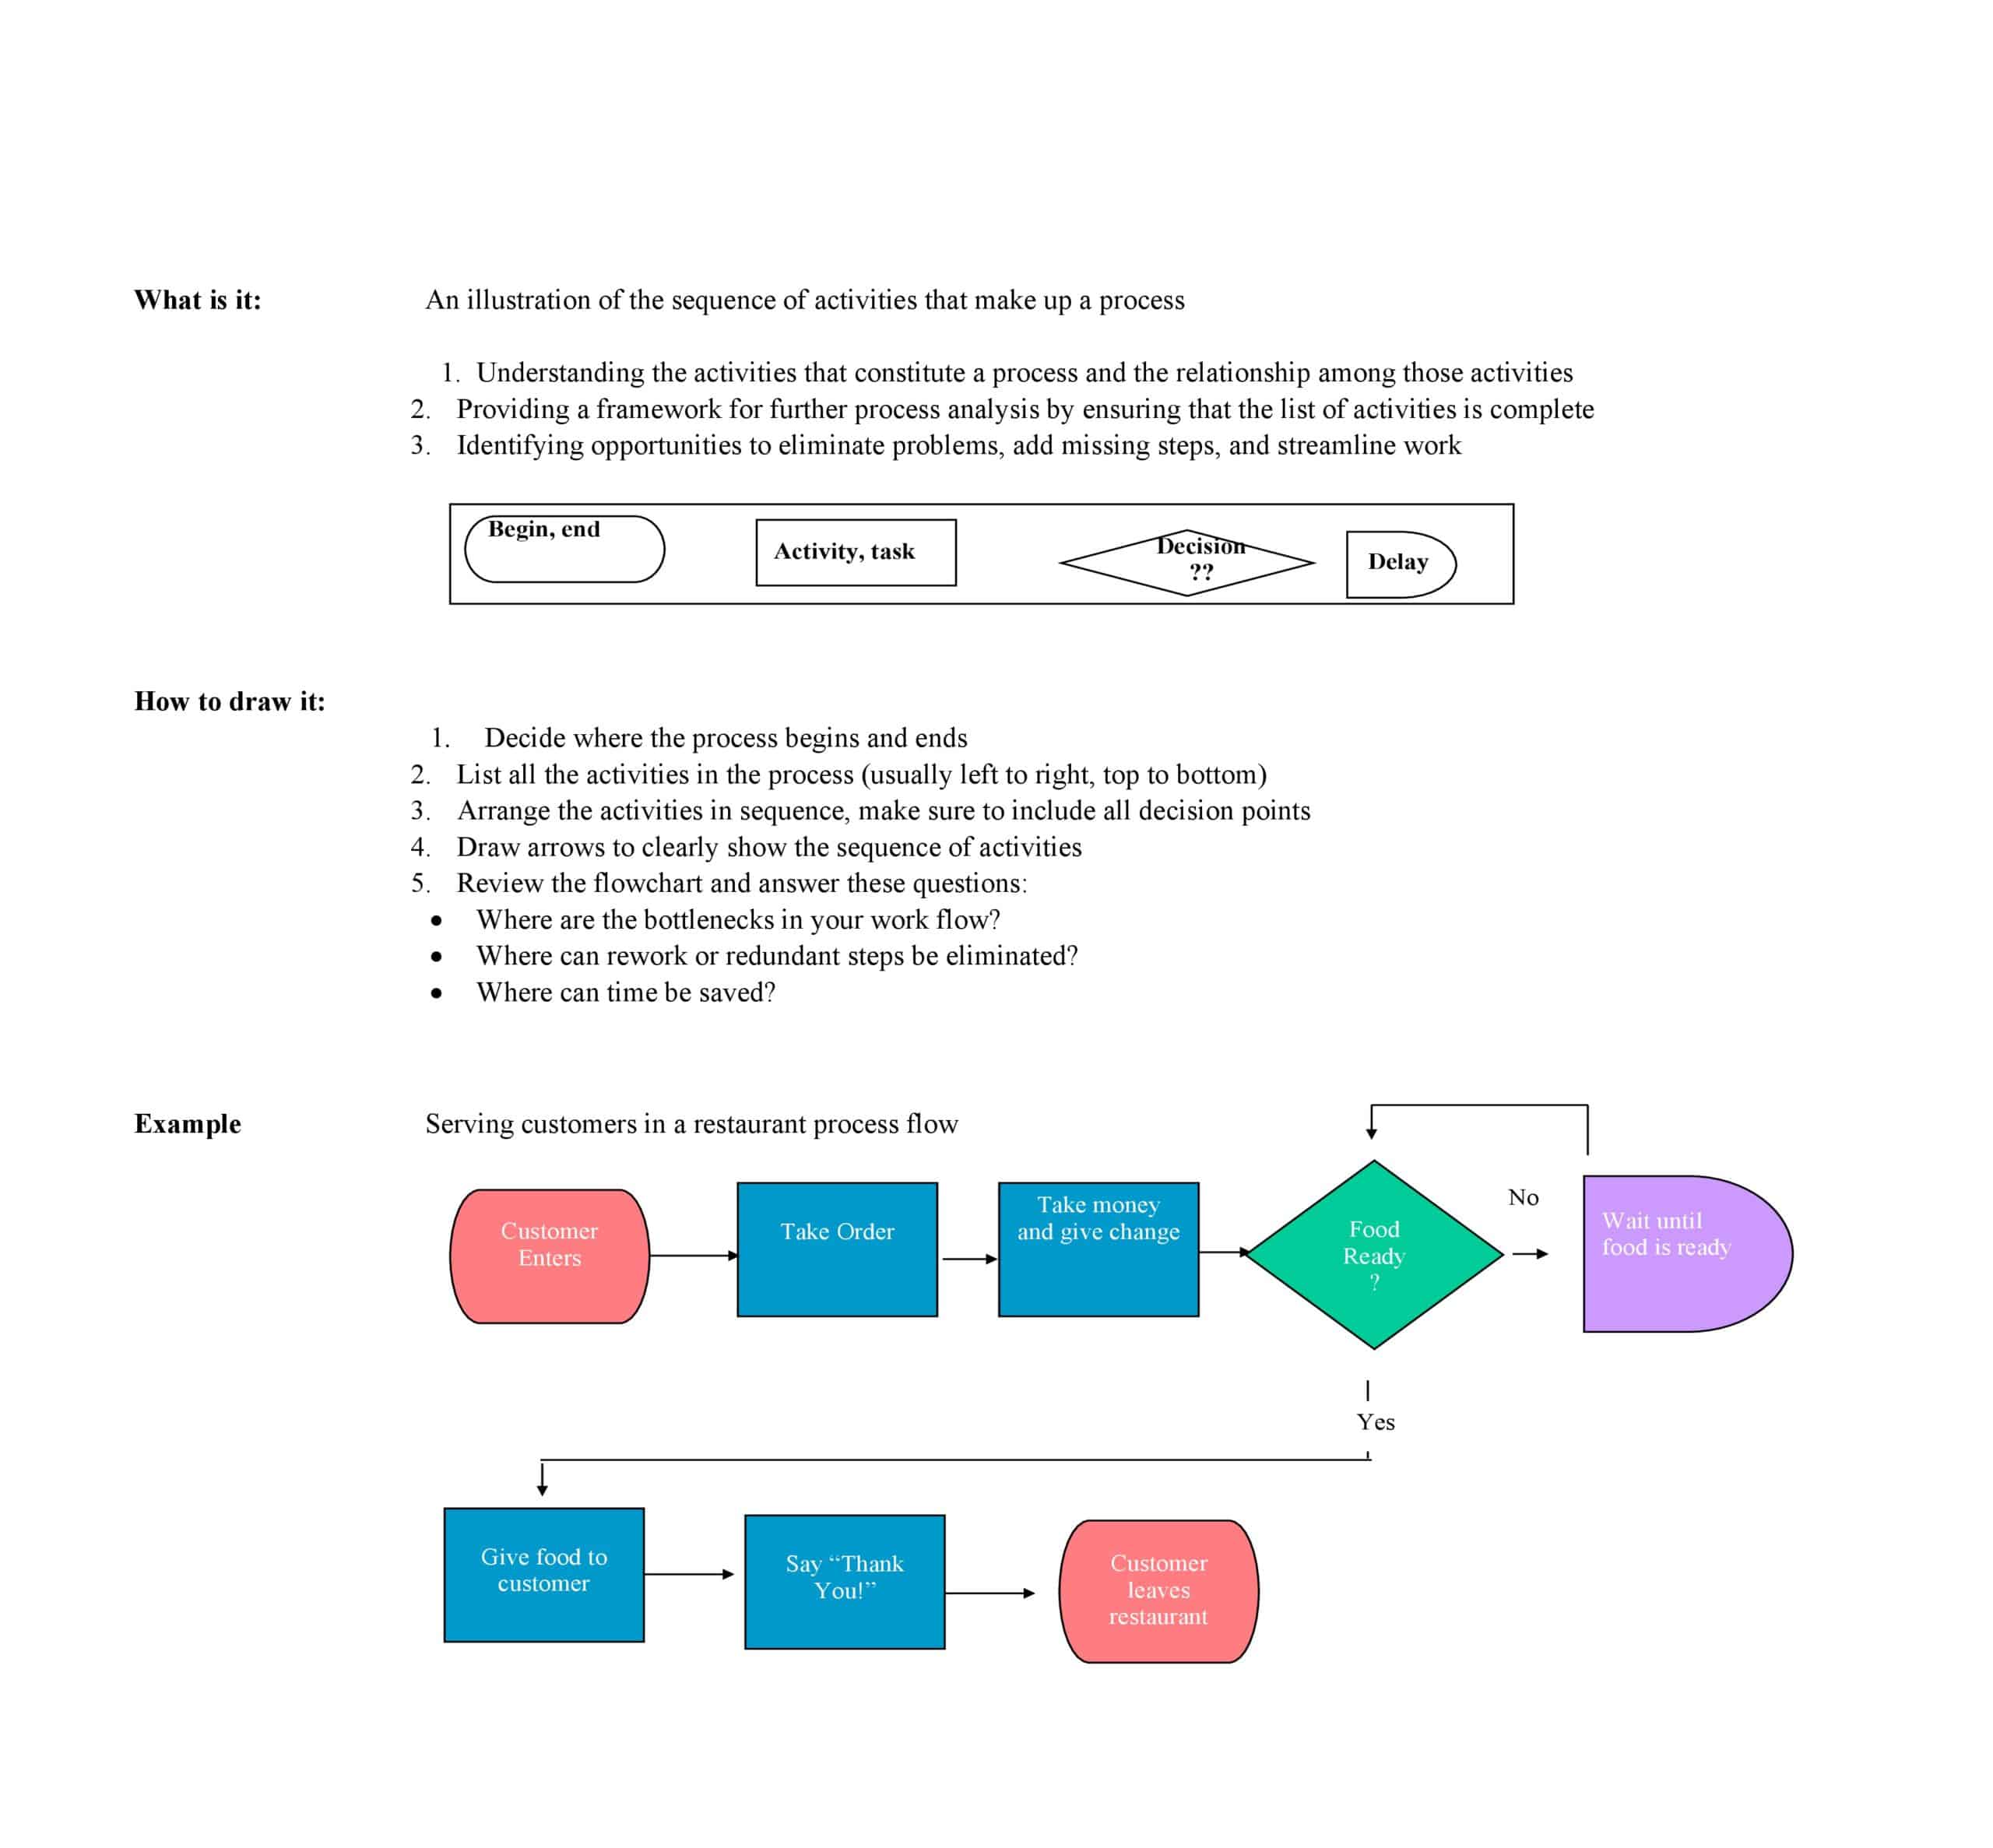
| ◇ | Decision | This symbol represents a point where a decision must be made, often a yes/no question or true/false test. |
| ◯ | Start/End | This symbol is used to represent the start or end point of the process. |
| ⏏ | Input/Output | This symbol is used to denote any form of input or output in the process. |
| ➤ | Flow | This symbol represents the flow or sequence of steps in the process. |
How to create a process flowchart
Creating a process flowchart may seem complex at first glance, but by following these systematic steps, it becomes a simpler and more manageable task:
Step 1: Identify the Process
First, you need to identify the process that you want to chart. This could be any procedure, workflow, or system that involves multiple steps or stages. It could be as simple as a customer service interaction or as complex as a manufacturing process.
Step 2: Define the Boundaries
Next, define the start and end points of the process. These boundaries will guide what is included in your flowchart. Anything that happens before your defined starting point or after your defined ending point will be left out of the chart.
Step 3: Understand the Process
Before you start drawing your chart, take the time to thoroughly understand the process. Talk to the people involved in the process, observe the process as it’s being performed, or review any existing documentation. This will help you capture all the necessary steps in your flowchart.
Step 4: List Out the Steps
Now, list all the steps involved in the process in chronological order. For each step, indicate what happens, who is involved, and any decisions that must be made. Be as detailed as possible. This list will serve as the basis for your flowchart.
Step 5: Start Drawing Your Flowchart
Begin drawing your flowchart using appropriate symbols for each step. A rectangle usually represents a step or action in the process, a diamond represents a decision point, and arrows indicate the flow or sequence of steps. Begin with a “Start” symbol, then represent each step based on your list, and finish with an “End” symbol.
Step 6: Indicate Decision Points
In the process, there may be steps where a decision has to be made that will determine the next step. These are represented by diamond symbols, with each possible decision leading to a different part of the process. The question that prompts the decision is written inside the diamond, and each outgoing arrow from the diamond should be labeled with a possible answer.
Step 7: Test the Flowchart
Once you’ve drawn your initial flowchart, test it by running through the process with the help of the flowchart. Check that every step is included and correctly ordered, and that all decision points lead to the right subsequent steps. This is your opportunity to verify the flowchart’s accuracy and make any necessary adjustments.
Step 8: Review and Revise
Share the flowchart with the people who perform the process and other relevant stakeholders. They may be able to provide additional insights or point out errors or omissions. Use their feedback to revise and refine your flowchart.
Step 9: Finalize and Distribute
After revising, finalize your flowchart and distribute it to all relevant parties. This may involve printing physical copies, sharing digital files, or using dedicated flowchart or workflow software. Make sure everyone who uses the process has access to the flowchart and knows how to read it.
Step 10: Regularly Update Your Flowchart
Over time, processes can change due to new tools, rules, or roles. Therefore, it’s important to review and update your flowchart regularly to ensure it always accurately represents the current process. Schedule periodic reviews of your flowchart and make updates as necessary.
Examples of a process flowchart
Let’s explore a few examples of how process flowcharts might be used in different scenarios, shedding light on the different steps and decision points involved.
1. Order Fulfillment Process Flowchart in E-commerce
Let’s say we’re looking at the process of fulfilling an order in an e-commerce business.
- Start
- Customer places an order on the website
- Order details sent to warehouse
- Is the item in stock?
- If no, the customer is notified of the delay and the item is reordered from the supplier, then go back to order details being sent to the warehouse.
- If yes, the order is picked from the shelves.
- Order is packed for shipping.
- Order is shipped via courier.
- Is the order delivered successfully?
- If no, customer service is notified, and they reach out to the customer to resolve the issue, then go back to order being shipped via courier.
- If yes, confirmation of successful delivery is sent to customer.
- End
2. Hiring Process Flowchart
Here’s an example of how a flowchart might be used to map out a company’s hiring process.
- Start
- Job vacancy is identified
- Job description is created and approved
- Job is advertised on various platforms
- Applications are received
- Are there suitable applicants?
- If no, re-advertise the job and then go back to applications being received.
- If yes, shortlist suitable candidates.
- Interviews are conducted.
- Is a suitable candidate found?
- If no, re-advertise the job, and then go back to applications being received.
- If yes, offer is made to selected candidate.
- Did the candidate accept the offer?
- If no, offer the job to the next suitable candidate, then go back to the question “Did the candidate accept the offer?”.
- If yes, onboarding process begins.
- End
3. Software Development Process Flowchart
This is a simplified version of a software development process. Real-world software development processes can be much more complex, but this gives a basic idea of how a flowchart might be used.
- Start
- Identify the need for new software
- Define the software requirements
- Create a software design
- Is the design approved?
- If no, modify the design, then go back to the question “Is the design approved?”.
- If yes, begin coding.
- Test the software.
- Are there any bugs?
- If yes, fix the bugs, then go back to the question “Are there any bugs?”.
- If no, the software is ready for deployment.
- Deploy the software.
- End
FAQs
How do you create a flowchart for a Process?
To create a process flowchart, map out the sequential steps using standard flowcharting shapes (rectangles, ovals, diamonds, arrows) connected by lines depicting progress. Include short text descriptions in each shape outlining key actions, inputs, decision points and outputs across the end-to-end process mapped visually.
Is there a flow chart template in Word?
Yes, Microsoft Word provides downloadable flow chart templates featuring commonly used process mapping shapes ready for entering descriptive text detailing the operational process steps. Word inserts the preformatted alignment and sizing structures.
How do I create a Process chart in Excel?
In Excel, go to “Insert” tab then click the diagram option to open pre-structured SmartArt chart examples such as the process category. Choose a template style then input concise explanatory text describing process steps by clicking into shape boxes. Resize or color code enhancements to customize.
How do I create a flow chart template?
To build a flow chart template, draft shapes for each standard action, decision and termination symbols, add arrows connecting, present multiple save options like: cross-functional macro process version outlining organization-wide workflow or drilled down micro steps within assigned groups for modular processes.
Can I create process flow chart in Excel?
Excel allows creating process flow charts through its diagrams functionality inserting pre-made chart template options then entering step descriptions into shapes of various workflows mapped out. Connect shapes with arrowed lines or color code background schematic enhancements customizable for departments or industries.
Is it easier to create a flowchart in Word or Excel?
Flow charts creation tends to be easier starting in Word, leveraging pre-defined templates helping expedite drafting steps or decision trees. Excel affords more collaborative, easily sharable chart editing capabilities once template groundwork completed. Both integrate well together for enterprise process documentation needs.










![Free Printable Credit Card Authorization Form Templates [PDF, Word, Excel] 1 Credit Card Authorization Form](https://www.typecalendar.com/wp-content/uploads/2023/06/Credit-Card-Authorization-Form-150x150.jpg)
![Free Printable Stock Ledger Templates [Excel,PDF, Word] 2 Stock Ledger](https://www.typecalendar.com/wp-content/uploads/2023/08/Stock-Ledger-150x150.jpg)
![Free Printable Financial Projections Templates [Excel, PDF] 3 Financial Projection](https://www.typecalendar.com/wp-content/uploads/2023/05/Financial-Projection-1-150x150.jpg)
