The Project Evaluation and Review Technique (PERT) chart is a time-tested tool in the world of project management, bridging the gap between project conception and completion. This powerful visual representation method offers a comprehensive view of task dependencies, project timelines, and potential bottlenecks.
Yet, despite its utilitarian facade, it carries a certain aesthetic charm, harkening back to the dawn of modern project management in the 1950s. This article aims to delve into the intricate workings of PERT charts, decoding their complexity and shedding light on their valuable role in facilitating effective project planning and execution.
Table of Contents
PERT Chart Templates
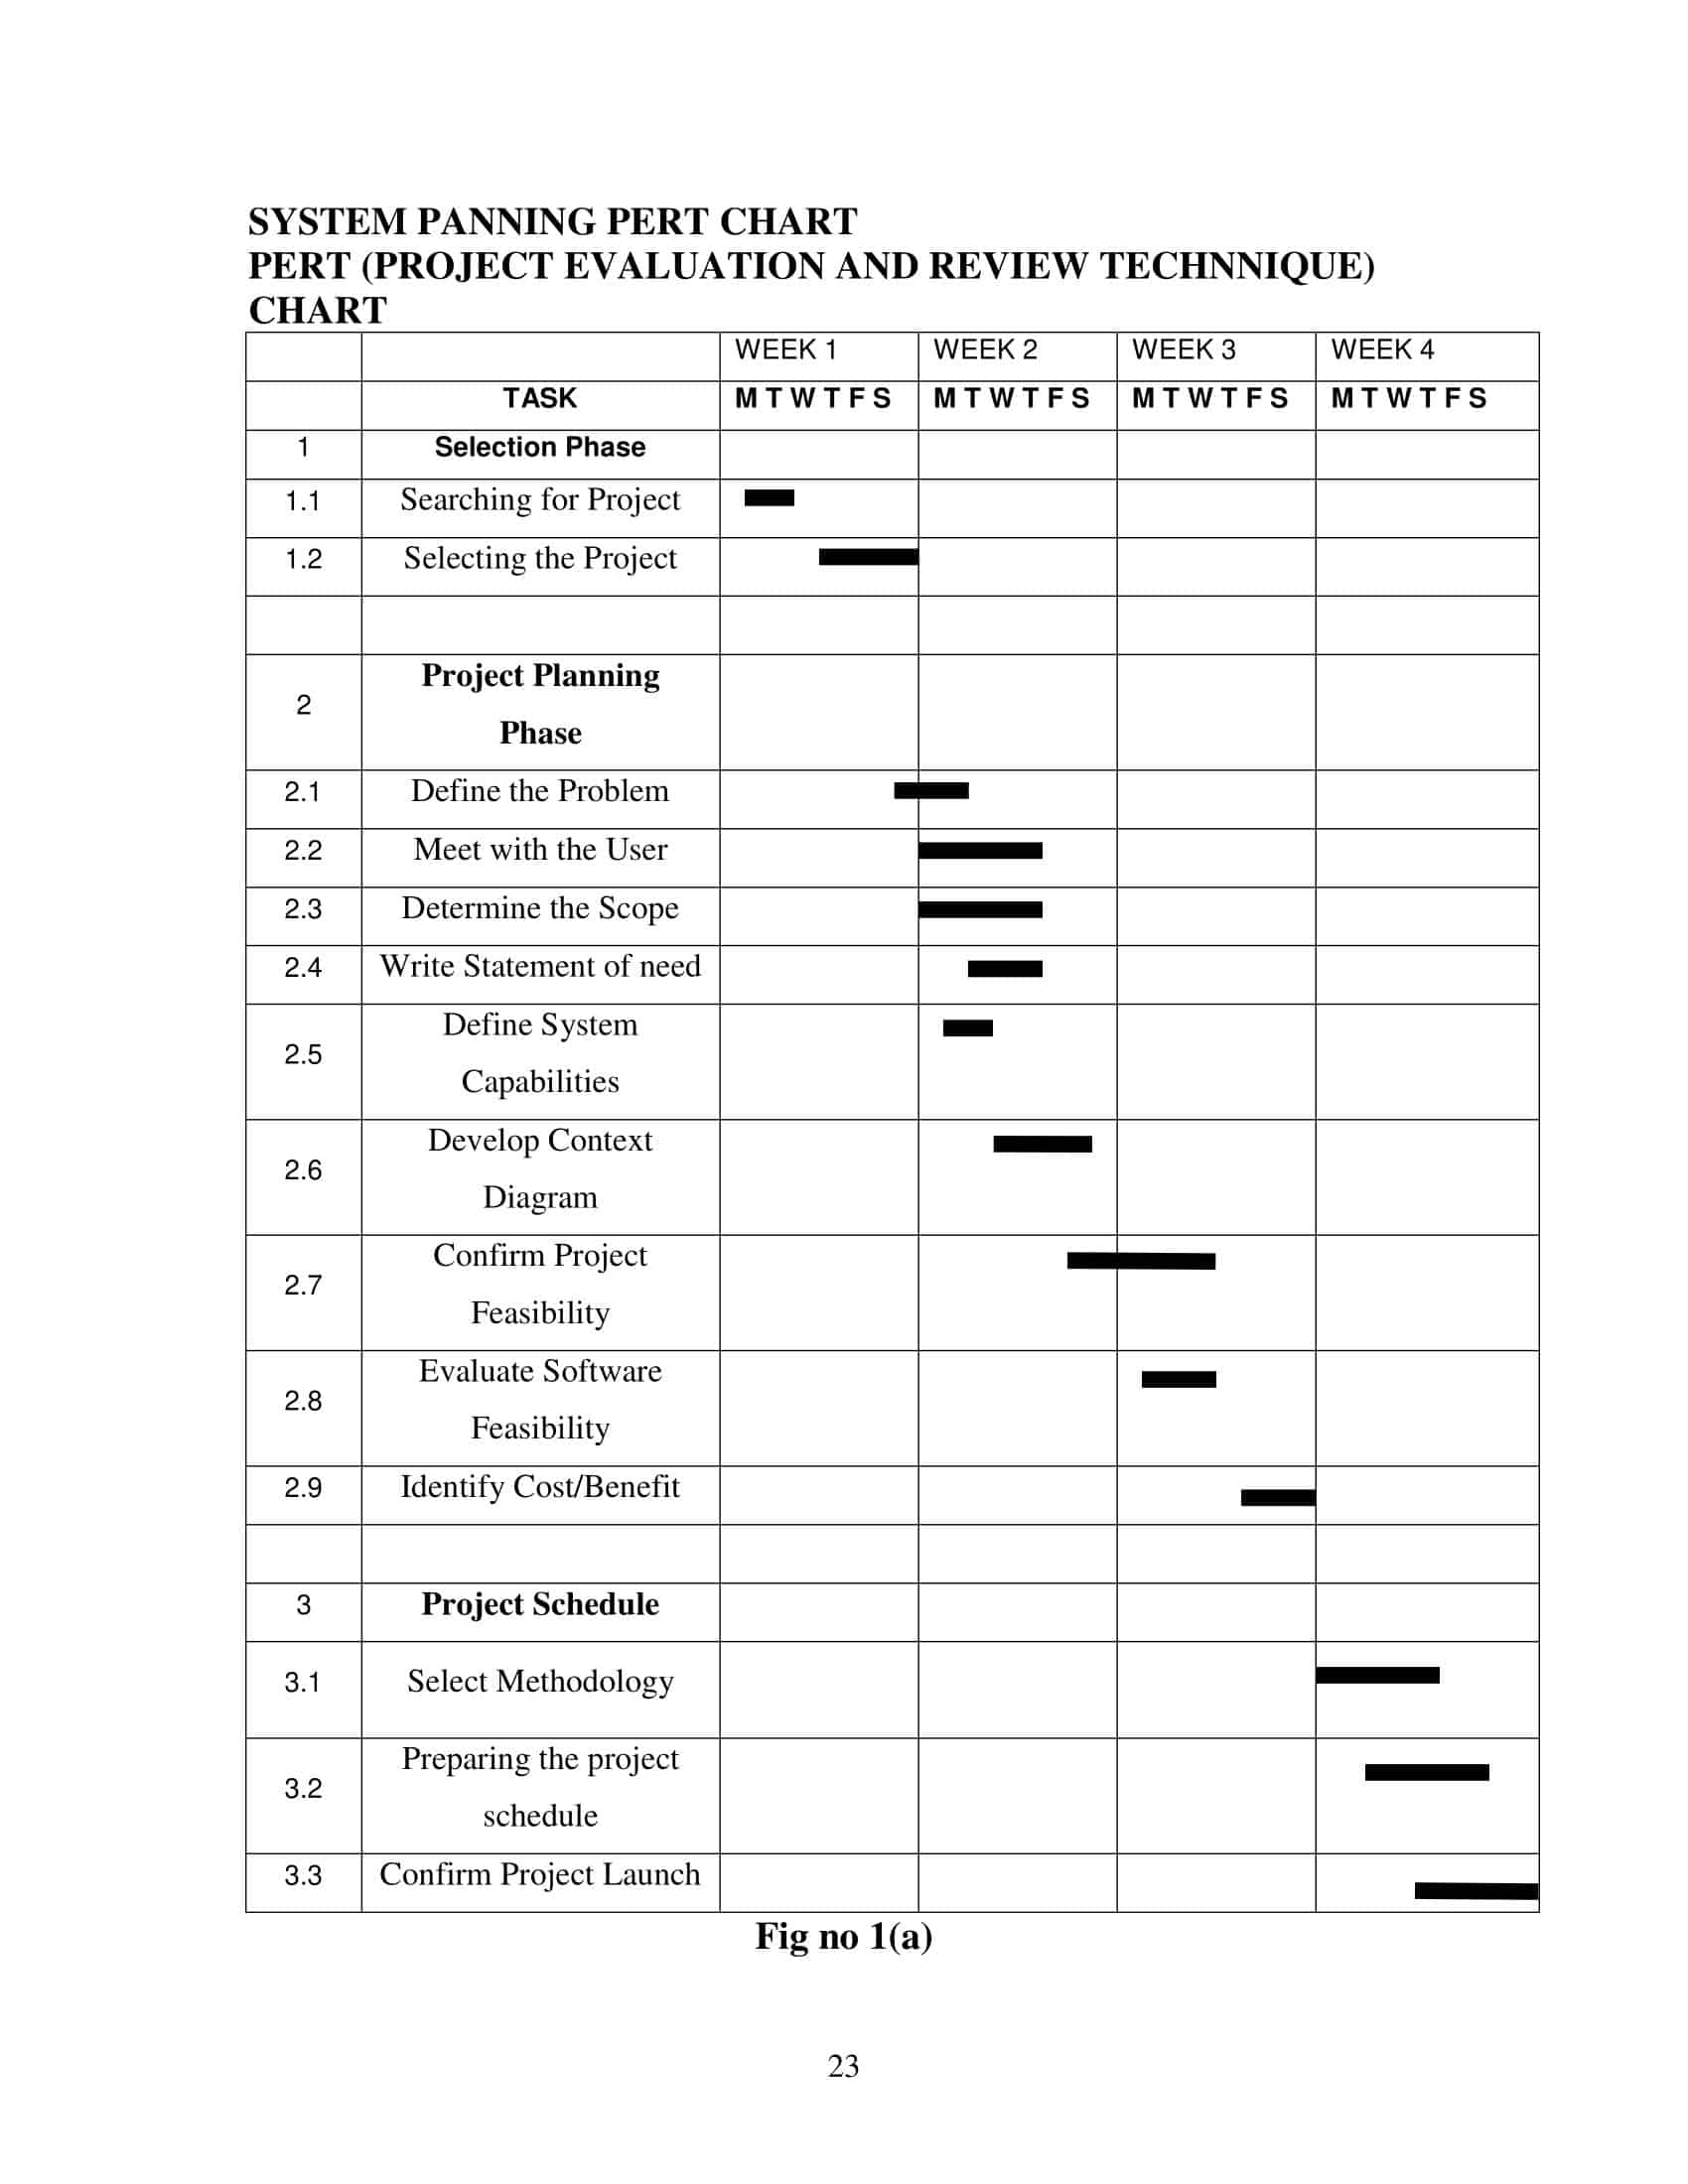
PERT (Program Evaluation and Review Technique) chart templates are valuable project management tools used to visually represent and organize complex tasks and their dependencies. They offer a comprehensive overview of a project’s timeline, critical milestones, and interrelated activities.
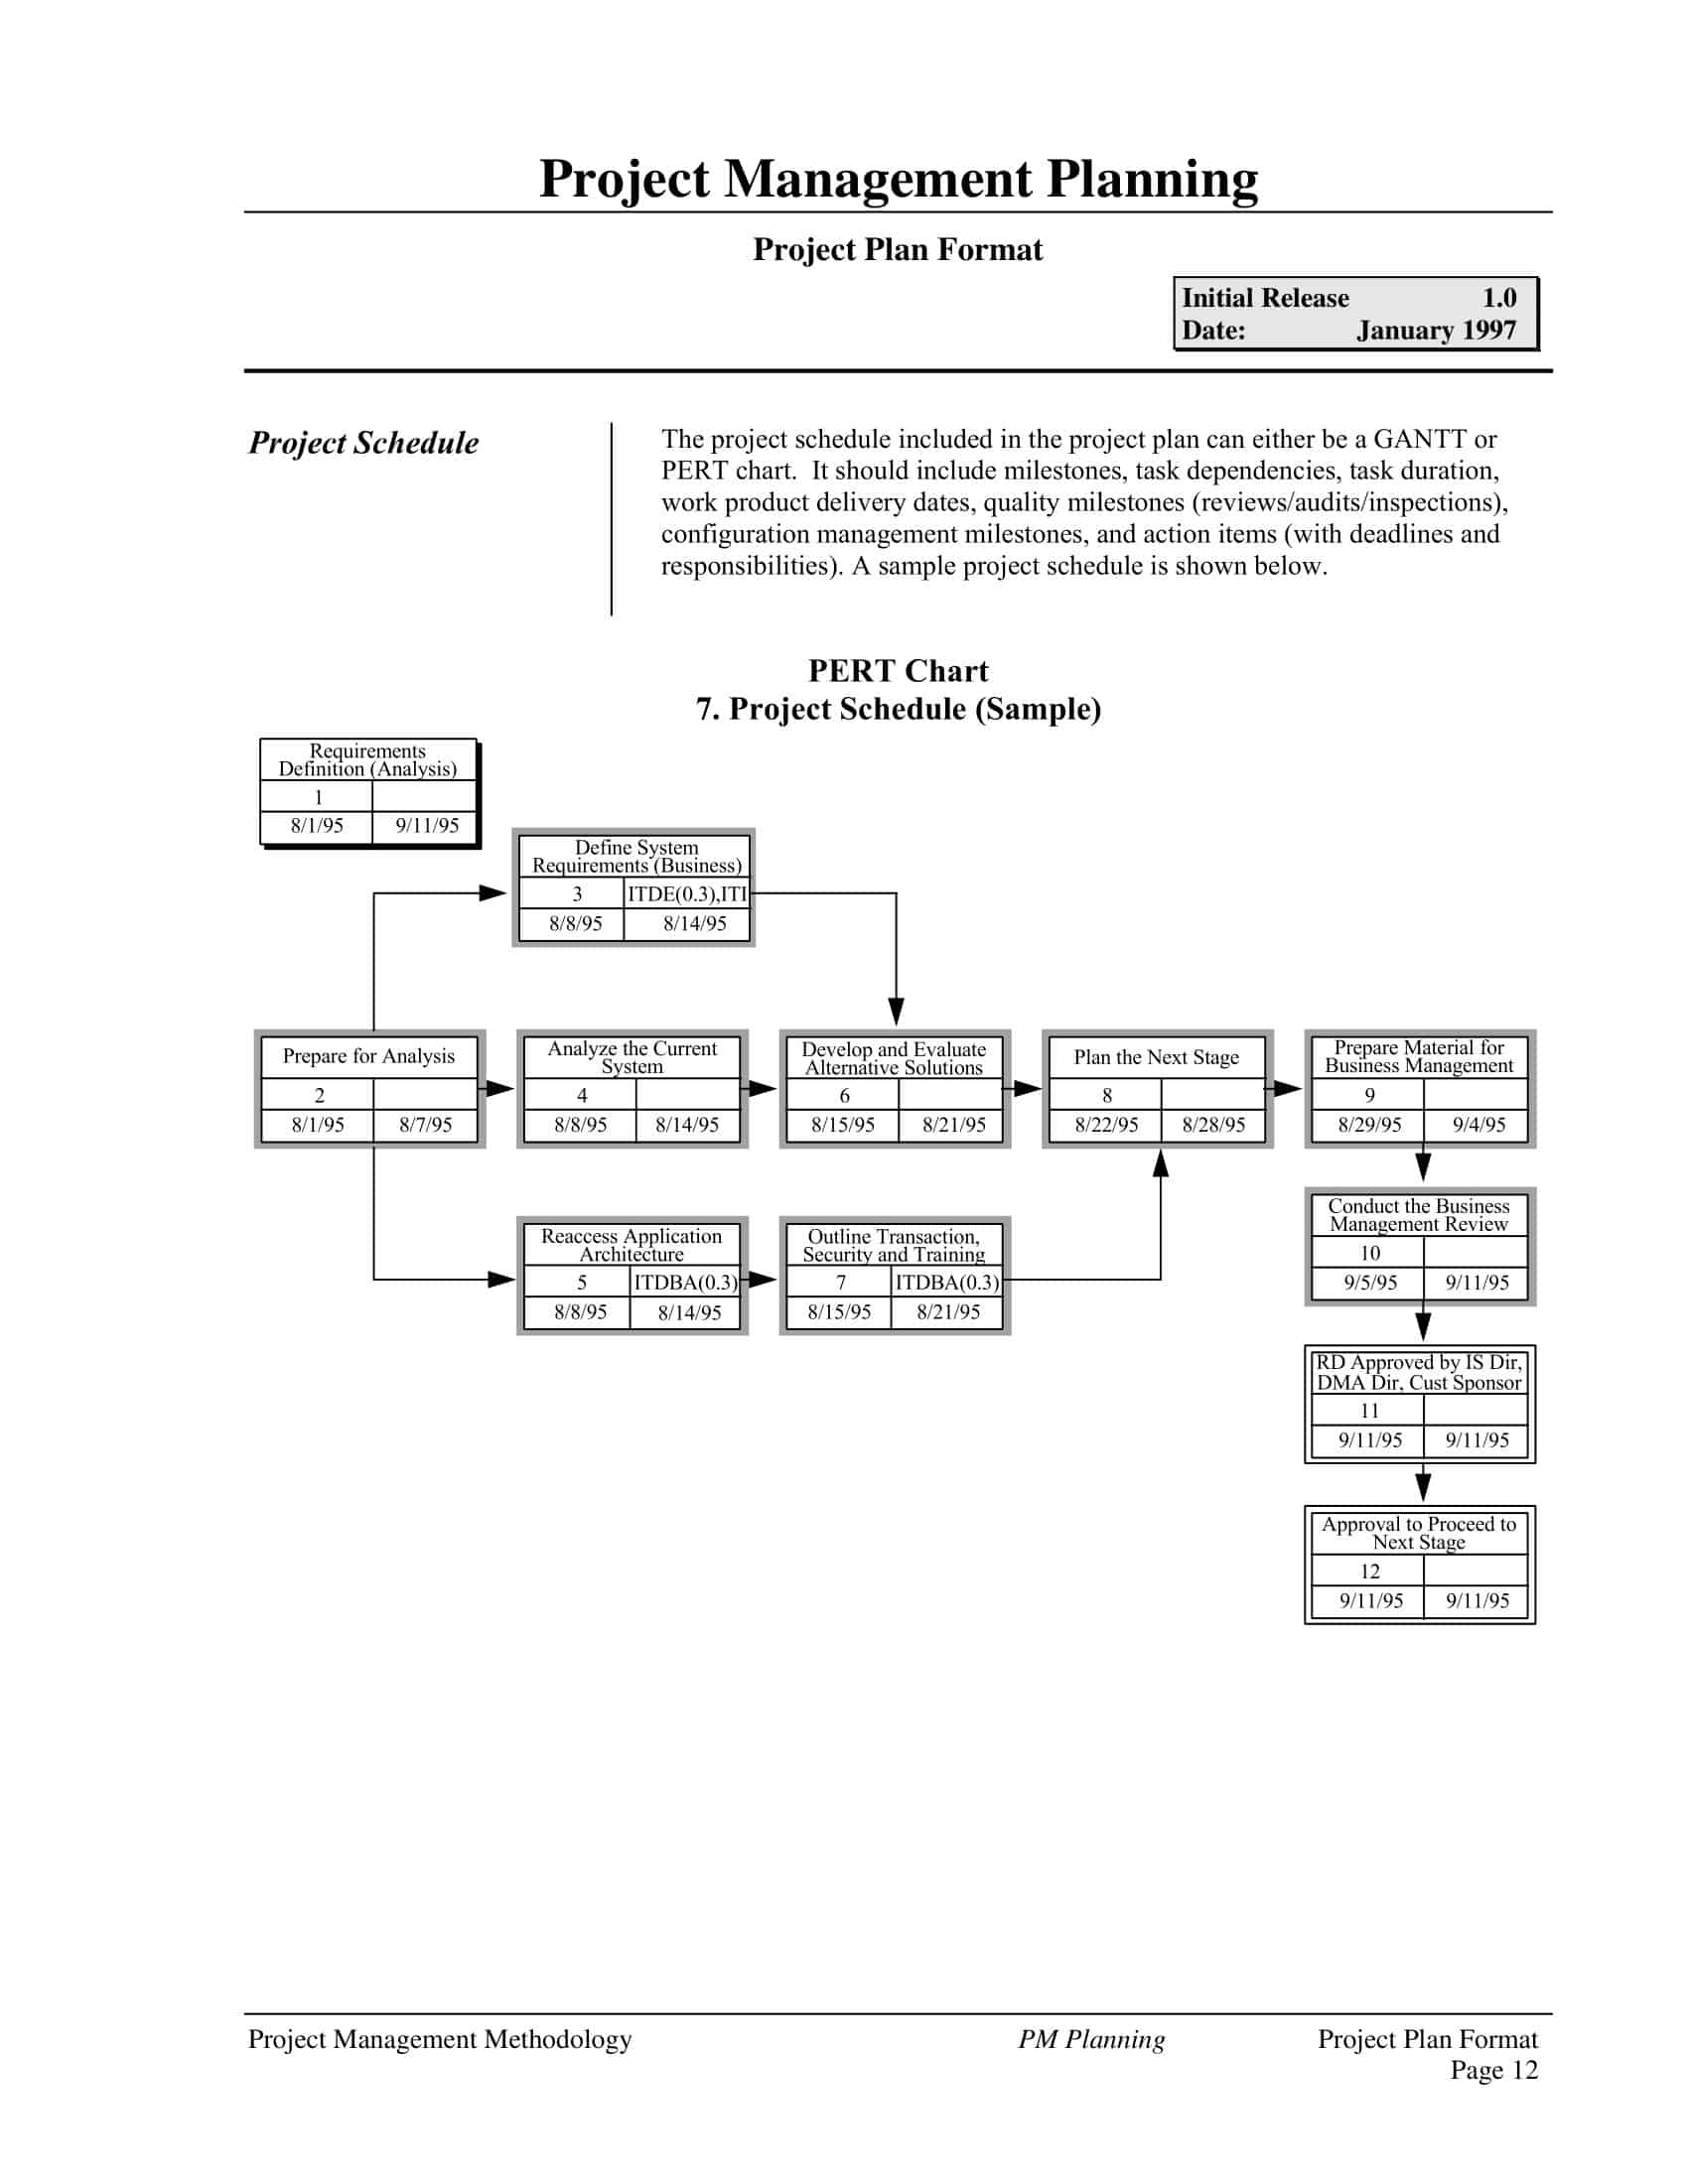
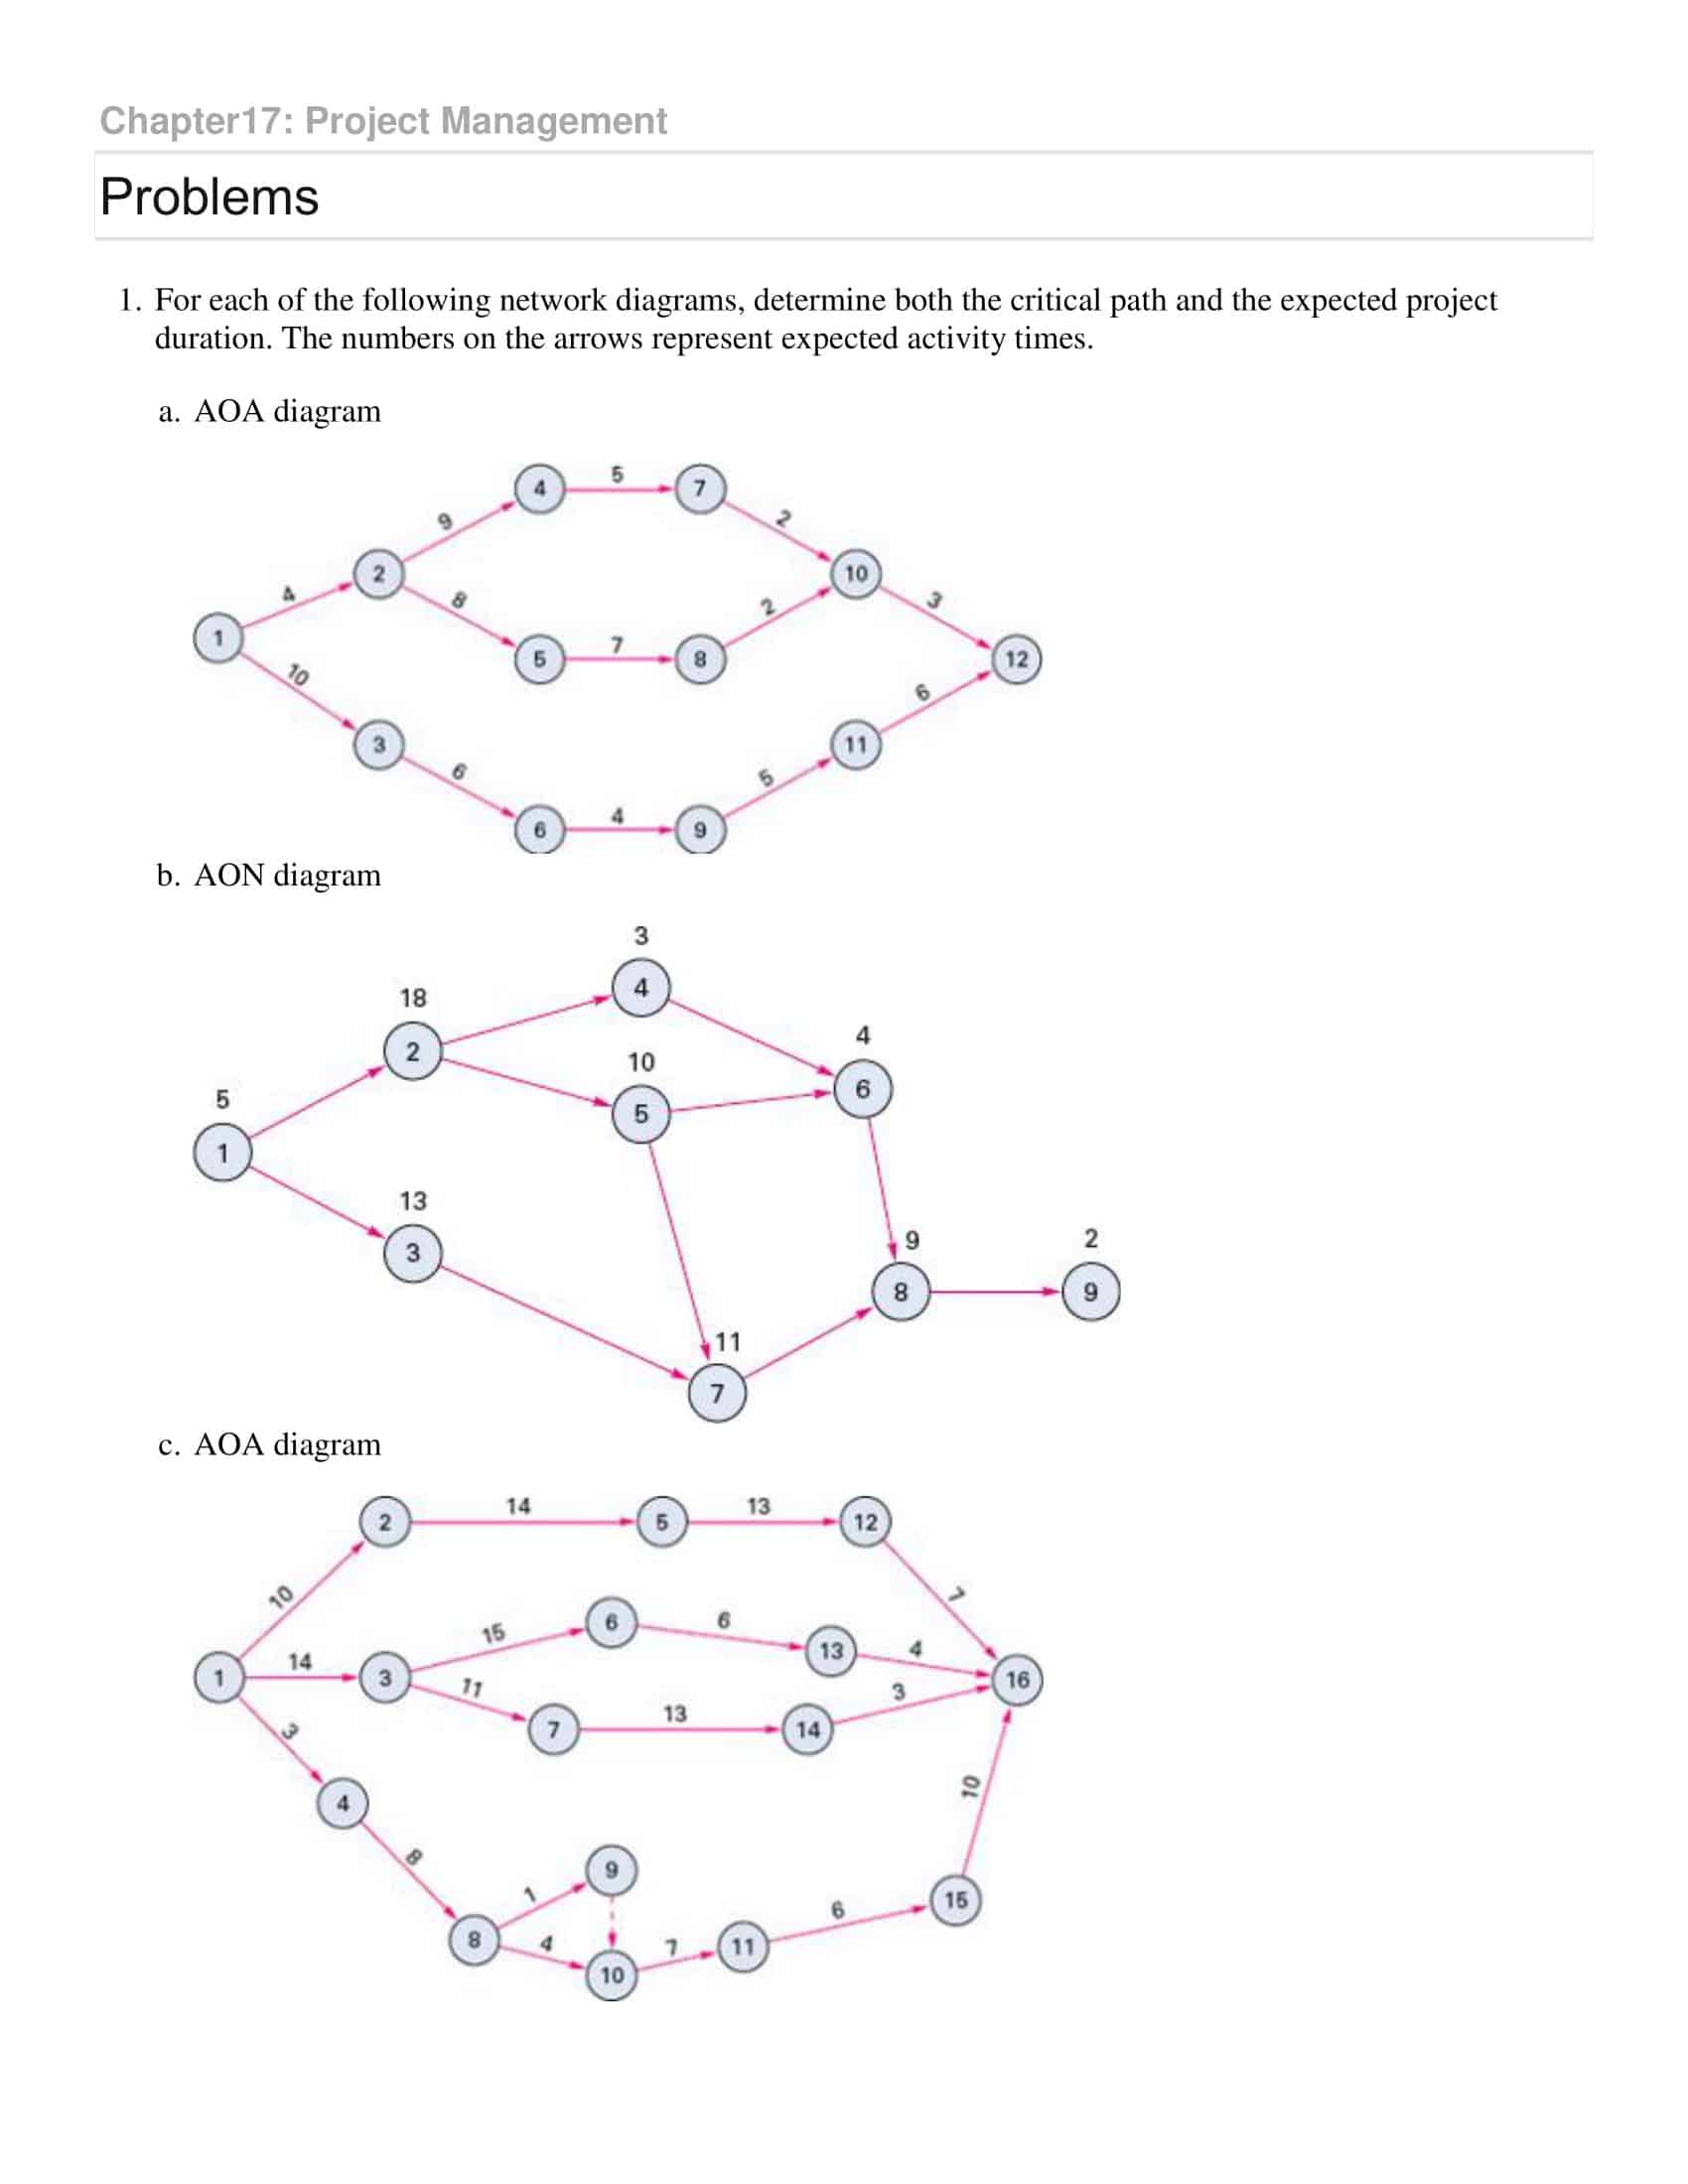
The PERT chart templates consist of interconnected nodes and arrows, with each node representing a specific task or event within the project. The arrows denote the relationships and dependencies between tasks, indicating the flow and sequence in which they must be completed. This visual representation allows project managers and team members to understand the project’s structure and identify the critical path—the sequence of tasks that determine the project’s overall duration.
What Is a PERT Chart?

A PERT (Project Evaluation and Review Technique) Chart is a graphical tool used in project management to represent and analyze the tasks involved in completing a given project. Developed in the 1950s during the planning of the U.S. Navy’s Polaris submarine missile project, the PERT chart is designed to depict the dependencies between tasks and the time required to complete each one.
When Should I Use a PERT Chart?
A PERT (Project Evaluation Review Technique) chart can be used in various situations during the project management process. Here are some scenarios where you might find it beneficial to use a PERT chart:
Complex Projects
PERT charts are particularly useful for complex projects with many interconnected tasks that need to be executed in a specific sequence. The chart will visualize the dependencies and sequence of activities, making it easier to understand the project’s flow.
Uncertain Time Estimates
If you’re not sure about the time estimates for tasks, a PERT chart can help. It allows for the incorporation of uncertainty by including optimistic, pessimistic, and most likely time estimates for each activity.
Managing Deadlines
If your project has a fixed deadline, a PERT chart can be used to determine the project’s critical path (the sequence of tasks that cannot be delayed without delaying the project). This can be very useful for managing the timeline effectively and ensuring the project is completed on time.
Managing Resources
PERT charts can also be useful when you’re managing resources across multiple tasks. By identifying the critical path and analyzing task dependencies, you can better plan and allocate resources to ensure that tasks are completed in the most efficient way possible.
Risk Management
A PERT chart helps identify which tasks are critical and which have slack time (extra time that could be used without delaying the project). This can assist in risk management, as it helps identify where there is flexibility in the schedule, where there isn’t, and where resources may need to be reallocated in case of problems.
Communicating Project Plan
A PERT chart provides a visual representation of the project timeline, making it easier to communicate the plan to stakeholders, including team members, clients, or executives.
How Does a PERT Chart Work?
A PERT (Program Evaluation Review Technique) chart is a project management tool that helps visualize and manage tasks in a project. It helps to estimate the minimum time needed to complete a project along with managing the dependencies between tasks. Here’s a step-by-step guide on how it works:
Identify the Specific Activities and Milestones
The first step in the PERT planning process is to identify the specific activities and milestones that make up the project. Activities are the tasks required to complete the project, and milestones are the major project goals and their deadlines.
Determine the Sequence of Activities
Once you’ve listed all the activities, you’ll need to determine the order in which they need to happen. Some tasks will depend on others to be completed before they can start, these are called dependent tasks. On the other hand, some tasks can run independently or in parallel.
Construct a Network Diagram
Now it’s time to begin constructing the PERT chart. The chart is a network diagram that represents the project’s activities and the dependencies between them. Each activity is represented as a node or an arrow, with the nodes being the dependent points and the arrows representing the activities. The direction of the arrows shows the sequence of tasks.
Estimate the Time for Each Activity
For each activity, make three time estimates:
- The optimistic time estimate (O) – the minimum possible time required to accomplish a task, assuming everything proceeds better than is normally expected.
- The pessimistic time estimate (P) – the maximum possible time required to accomplish a task, assuming everything goes wrong (but excluding major catastrophes).
- The most likely time estimate (M) – the best estimate of the time required to accomplish a task, assuming everything proceeds as normal.
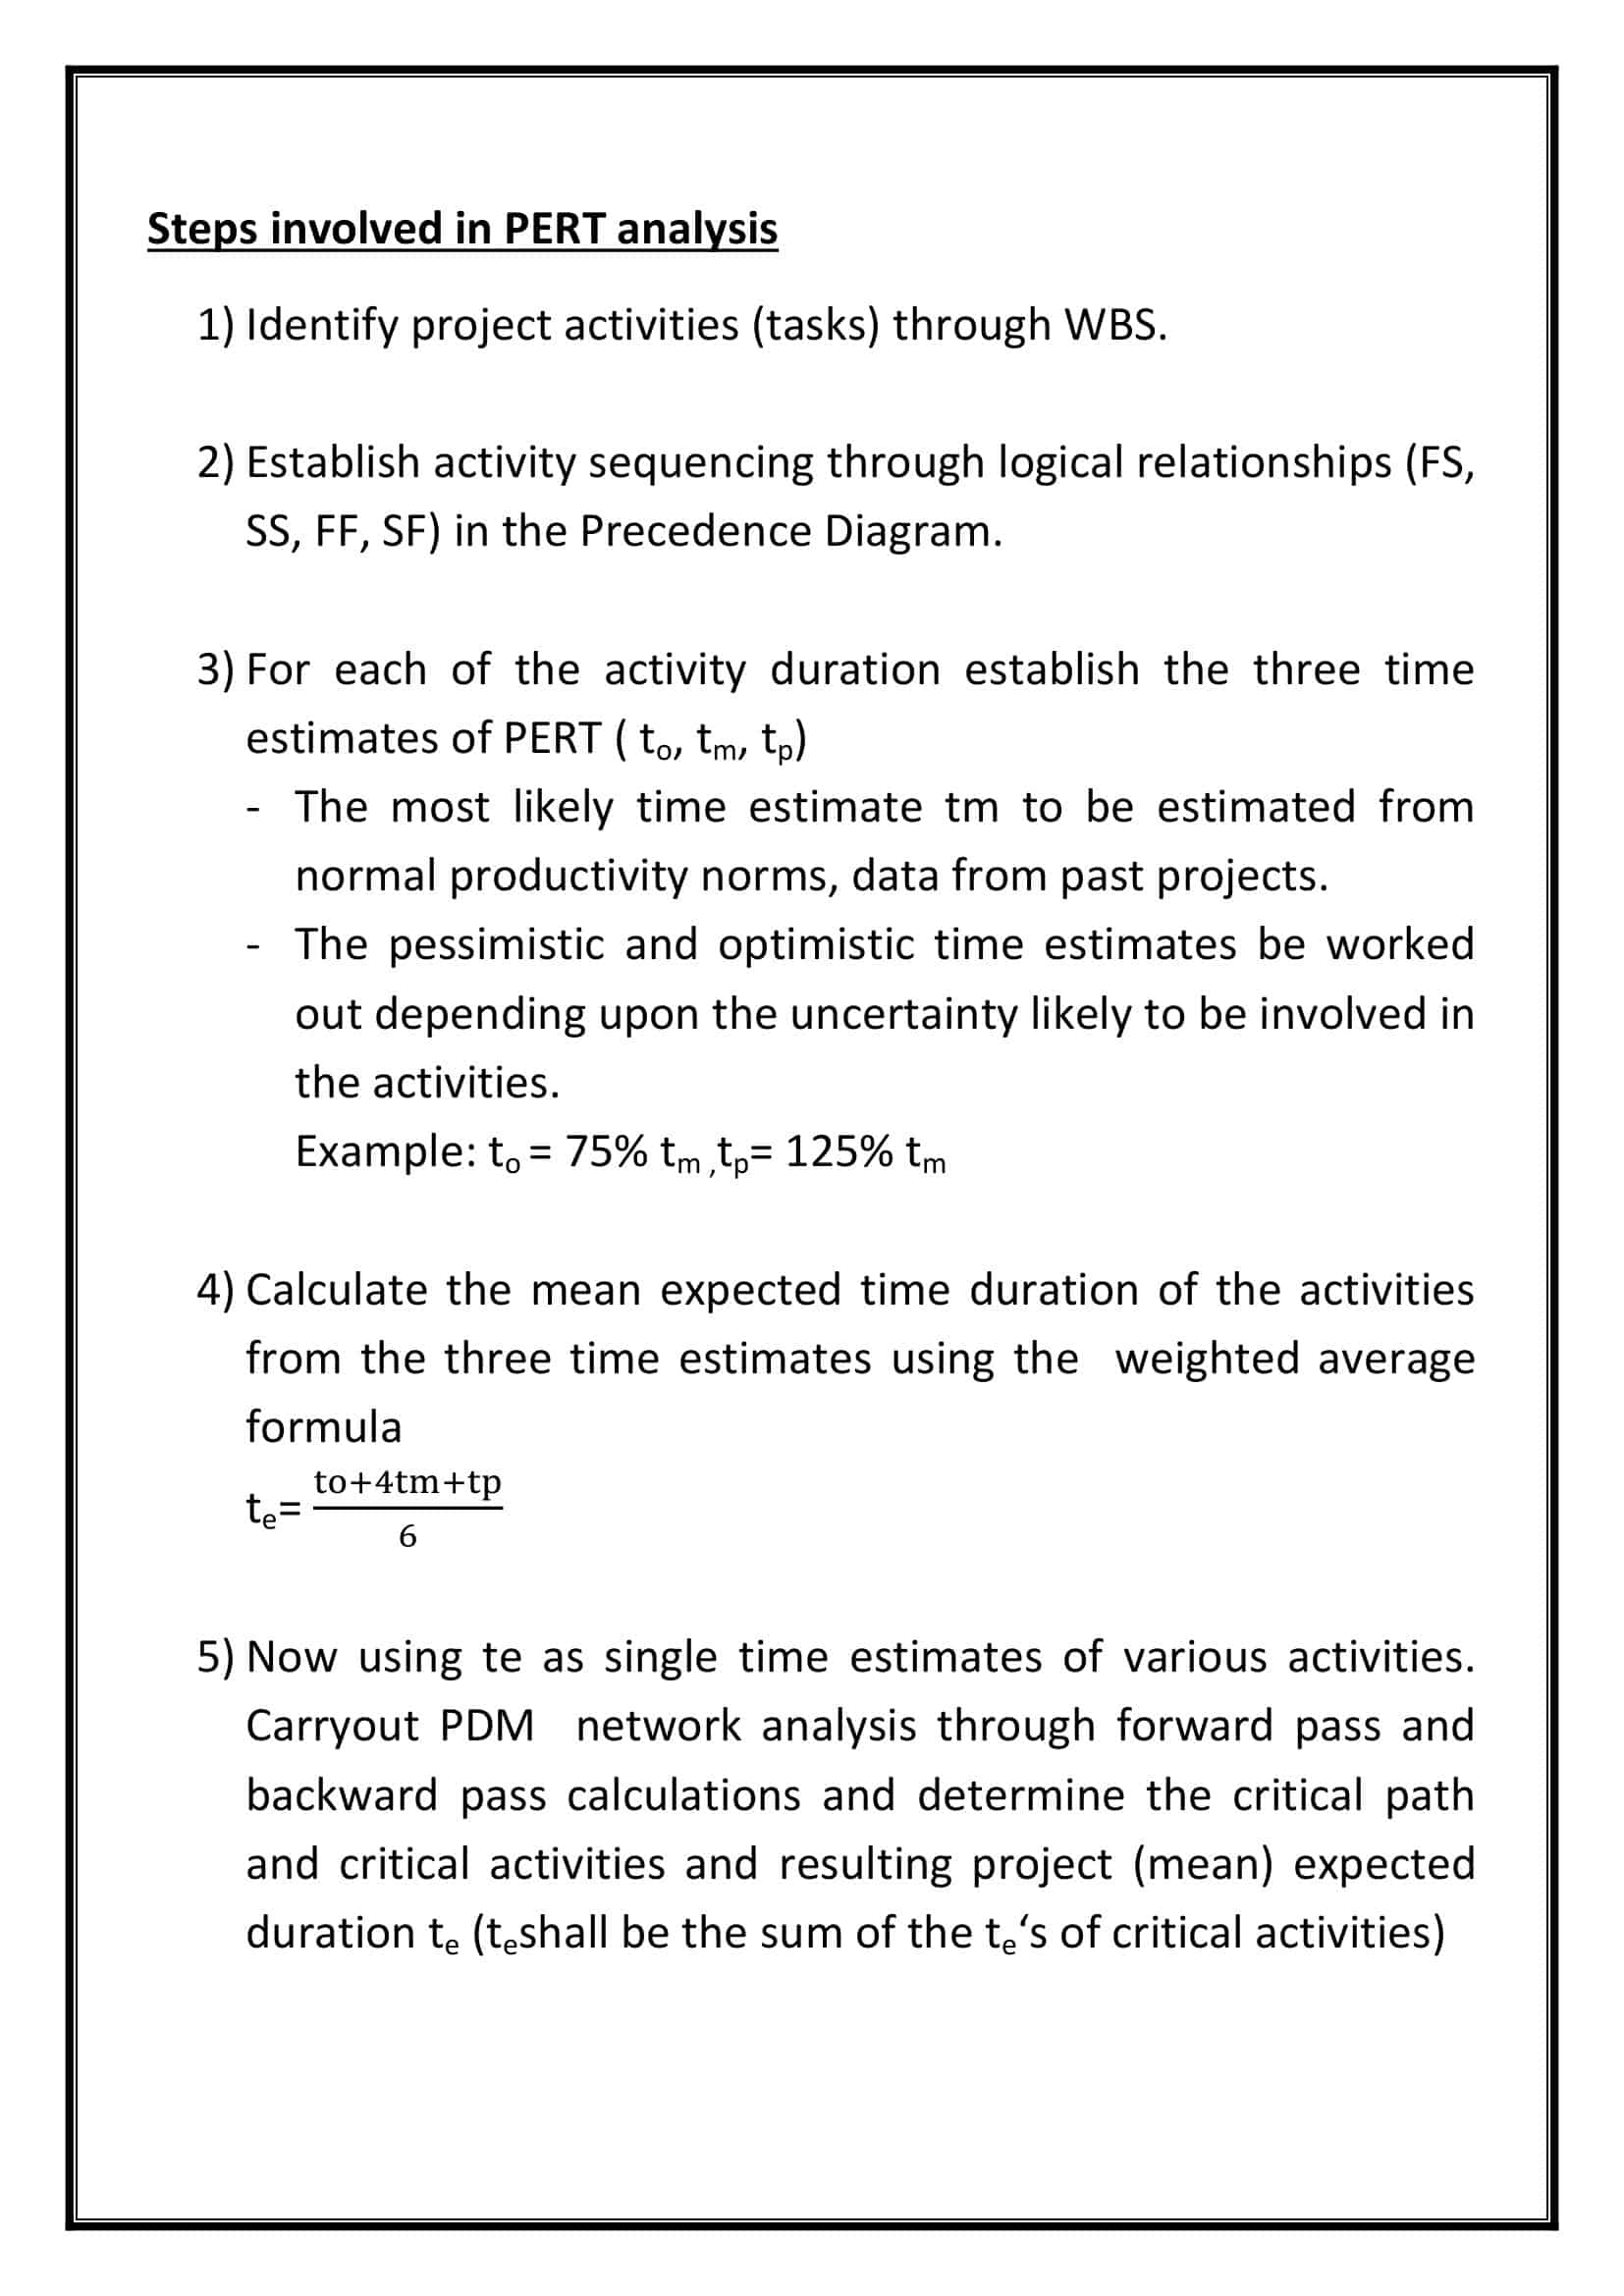
- The expected time (T) for each task can then be calculated using the formula: T = (O + 4M + P) / 6.
Identify the Critical Path
The critical path is the longest path from the start to the end of the project, passing through all the critical tasks. It determines the total time to complete the project. If any task on the critical path is delayed, it will delay the entire project. It’s called ‘critical’ because it shows the tasks that are critical to keeping the project on schedule.
Update the PERT Chart as the Project Progresses
Once the project is underway, the PERT chart should be updated with the actual times it takes to complete tasks. This will help you track the project’s progress, and if necessary, adjust the project’s schedule or reallocate resources.
What Should a PERT Chart Template Include?
A PERT (Project Evaluation Review Technique) Chart template should include the following key components:
Activities/Tasks
These are the various tasks required to complete the project. Each task should be labeled for easy identification. Task names should be short but descriptive enough for anyone to understand.
Dependencies
Dependencies indicate how tasks are related. For example, some tasks may not begin until others are complete. The dependencies between tasks should be clearly illustrated with arrows in the PERT chart.
Timeline
The timeline gives an idea of how long each task will take and when it should begin and end. For a PERT chart, the timeline isn’t usually represented as a straight line but can be deduced from the sequence of tasks and their estimated times.
Milestones
Milestones are significant points or goals in the project. They serve as markers to help you track your progress.
Task Duration
Each task should have the estimated duration associated with it. In PERT charts, usually, three estimates are included: optimistic, most likely, and pessimistic.
Nodes
In the diagrammatic representation, nodes are used to represent events within the project’s lifecycle. This might be the start or end of tasks, or key stages in the project.
Critical Path
This is the longest path from the start to the end of the project, passing through all the critical tasks. Any delay in tasks on this path will result in a delay of the entire project. This path should be clearly identified.
Start and End Points
The chart should clearly define where the project begins and ends.
Slack Time
The chart should also indicate the slack time, or float, which is the amount of time that you can delay a task without delaying the project. Tasks on the critical path have zero slack time.
Task Owners/Responsibilities
It’s often helpful to indicate who is responsible for each task. This ensures everyone knows their responsibilities and can update the progress of their tasks.
Advantages and Disadvantages of PERT Charts
PERT (Project Evaluation Review Technique) charts are valuable tools for project planning and control. However, as with any tool, they have both advantages and disadvantages.
Advantages of PERT Charts:
Clarity: PERT charts provide a clear and graphical representation of the project. This makes it easier to understand the sequence of tasks, the dependencies between them, and the overall flow of the project.
Critical Path Identification: One of the key advantages of PERT charts is that they make it easy to identify the critical path of the project. The critical path is the sequence of tasks that determines the total time required for the project. By identifying the critical path, managers can focus their resources and attention on the tasks that will have the biggest impact on the project schedule.
Helps in Time Management: PERT charts can help with time estimation and management. They provide a structure for estimating the time required for each task and the project as a whole. This can be useful for setting realistic deadlines and managing expectations.
Uncertainty and Risk Management: PERT charts allow for the inclusion of uncertainty in the project schedule. By using three time estimates for each task (optimistic, most likely, and pessimistic), PERT charts can provide a range of possible completion times and help manage risk.
Improved Coordination and Communication: By providing a visual representation of the project schedule, PERT charts can improve coordination and communication between team members and stakeholders. They make it easier for everyone to understand the project timeline and their role in it.
Disadvantages of PERT Charts:
Time Consuming and Complex: PERT charts can be time-consuming to create and maintain, particularly for large and complex projects. They require detailed information about the tasks and dependencies, which may not be available at the start of the project. Furthermore, updating the chart as the project progresses can also be a significant task.
Based on Estimates: The times used in PERT charts are estimates. While the use of three time estimates can help manage uncertainty, it is still possible that the actual times will be different. This means that PERT charts do not provide a definitive schedule.
Doesn’t Deal Well with Changes: PERT charts are static and do not deal well with changes. If a task takes longer than expected or if there are changes in dependencies, the entire chart may need to be redrawn.
Focus on Time, Not Resources: PERT charts focus on the time required for tasks, not the resources required to complete them. This means they might not provide a complete picture of what is needed for the project.
Overemphasis on Critical Path: While identifying the critical path is important, PERT charts can lead to an overemphasis on these tasks. This could potentially lead to the neglect of other tasks that, while not on the critical path, are still important to the success of the project.
In summary, PERT charts are a powerful tool for project planning and control, but they are not without their limitations. They should be used as part of a comprehensive project management approach, and their use should be adapted to the specific needs and constraints of the project.
PERT Chart vs. Gantt Chart
PERT (Program Evaluation Review Technique) Charts and Gantt Charts are both popular project management tools used to schedule, organize, and coordinate tasks within a project. While they share some similarities, they have significant differences and are used for different purposes. Let’s compare them based on several key factors:
Visualization of Dependencies
PERT Chart: Provides a visual representation of the tasks and their dependencies in a network diagram. This makes it easy to see which tasks need to be completed before others can start.
Gantt Chart: Show dependencies between tasks as well, but not as clearly as PERT charts. The horizontal bar chart format is more suited to showing the duration of tasks and their placement in time.
Representation of Time
PERT Chart: Focuses more on the sequence and interdependencies of tasks rather than the exact timeline. Time estimates are used, but the visual emphasis is on the order of operations rather than on exact dates.
Gantt Chart: Clearly represents the start date, end date, and duration of each task on a timeline. This makes it easy to see at a glance when each task will take place.
Critical Path
PERT Chart: One of the key features of a PERT chart is the ability to clearly identify the critical path, which is the sequence of tasks that determines the minimum time needed to complete the project.
Gantt Chart: Although Gantt charts can also show the critical path, this is not their primary purpose, and the critical path is not as clearly highlighted as in a PERT chart.
Management of Uncertainty
PERT Chart: It handles uncertainty by allowing for three time estimates (optimistic, most likely, and pessimistic) for each task. This can provide a more realistic view of the project timeline when there is uncertainty about task durations.
Gantt Chart: Gantt charts typically use a single time estimate for each task. This makes them less suited to dealing with uncertainty, but simpler to understand and manage.
Updating and Revising
PERT Chart: Can be complex to update and revise, particularly for large projects with many tasks and dependencies.
Gantt Chart: Generally easier to update and revise. Many project management software tools provide easy-to-use features for updating Gantt charts.
In summary, both PERT and Gantt charts are useful tools in project management, but they serve different purposes. PERT charts are great for planning and scheduling complex projects with many interrelated tasks and uncertainties. Gantt charts, on the other hand, are excellent for tracking project progress over time and providing a clear and easy-to-understand visualization of the project timeline. It’s not uncommon for project managers to use both in conjunction, leveraging the strengths of each for different aspects of project management.
Understanding a PERT chart symbols, notations, and terminology
In the field of project management, a PERT (Project Evaluation Review Technique) chart is a useful tool for visualizing and managing tasks within a project. It helps project managers estimate the minimum time required to complete a project, determine the critical path, and understand task dependencies.
The PERT chart uses specific symbols, notations, and terminology. Let’s examine some of these in detail:
Tasks or Activities: These are the actual steps or work packages that need to be completed for the project. In a PERT chart, tasks are usually represented as arrows. Each arrow is labeled with the task’s name or identifier, and possibly additional information like estimated time and responsible person or team.
Events or Milestones: These are specific points in the project that typically mark the start or end of tasks. In a PERT chart, events are represented as nodes or circles and are connected by the task arrows. Each node is usually assigned a number for identification purposes.
Predecessors and Successors: These terms refer to tasks that must be completed before (predecessors) or after (successors) a given task. The direction of the arrows in a PERT chart indicates the sequence of tasks.
Dependency: This is a relationship between tasks where one task relies on another to start or finish. Dependencies are represented by the arrows connecting nodes in a PERT chart.
Critical Path: This is the longest sequence of tasks in the project from start to finish, which determines the minimum completion time for the project. If any task on the critical path is delayed, it will delay the whole project. On a PERT chart, the critical path is often highlighted or marked in some way to distinguish it from other paths.
Slack Time or Float: This is the amount of time that a task can be delayed without affecting the project completion time. Tasks on the critical path have zero slack time, while tasks not on the critical path have some slack time. Slack time may be indicated on a PERT chart alongside the tasks.
Early Start (ES) and Early Finish (EF): These are the earliest times a task can start and finish based on task dependencies and the project start time. They are calculated for all tasks during the forward pass through the PERT chart.
Late Start (LS) and Late Finish (LF): These are the latest times a task can start and finish without delaying the project. They are calculated for all tasks during the backward pass through the PERT chart.
Duration (D): This is the estimated time it takes to complete a task. In a PERT chart, three time estimates are usually used: optimistic time (O), most likely time (M), and pessimistic time (P). The expected time (TE) can be calculated using the formula TE = (O + 4M + P) / 6.
How to Make a PERT Chart
A PERT (Program Evaluation and Review Technique) chart is a project management tool used to plan and visualize the tasks and activities involved in a project. It helps in identifying dependencies, estimating timelines, and managing the critical path. Here is a comprehensive step-by-step guide on how to make a PERT chart:
Step 1: Identify the Project Scope and Objective
Define the scope and objective of your project. Determine what needs to be accomplished and the desired outcome.
Step 2: Identify Key Tasks and Activities
Break down your project into smaller tasks and activities. Identify the major milestones and activities that need to be completed to achieve your project objective.
Step 3: Determine Task Dependencies
Identify the dependencies between tasks. Determine which tasks need to be completed before others can start. This will help you understand the logical flow of the project.
Step 4: Determine Task Durations
Estimate the time required to complete each task. Consider factors such as resources available, skill levels, and potential risks. You can use historical data or consult with subject matter experts to make accurate estimates.
Step 5: Determine the Critical Path
Identify the critical path, which is the sequence of tasks that will take the longest time to complete. The critical path determines the overall project timeline.
Step 6: Create a PERT Chart Template
Draw a PERT chart template on a whiteboard, a flip chart, or using specialized software or tools. A PERT chart typically consists of nodes (representing tasks) and arrows (representing dependencies).
Step 7: Add Nodes and Task Details
For each task, add a node to the PERT chart. Label each node with a unique identifier and include a brief description of the task. You can use shapes like rectangles or circles for nodes.
Step 8: Connect Nodes with Arrows
Draw arrows to represent the dependencies between tasks. Connect the nodes in the order in which they need to be completed. Arrows should flow from the predecessor task to the successor task.
Step 9: Add Task Durations and Milestones
Assign estimated durations to each task. Write the duration next to the task node. Additionally, identify any significant milestones in the project and mark them on the chart. Milestones represent key events or accomplishments.
Step 10: Identify the Critical Path
Analyze the dependencies and task durations to determine the critical path. The critical path is the longest path through the PERT chart and represents the minimum time required to complete the project.
Step 11: Review and Refine the PERT Chart
Carefully review the PERT chart to ensure that all tasks and dependencies are accurately represented. Make adjustments if necessary, taking into account any feedback or changes from stakeholders.
Step 12: Communicate and Share the PERT Chart
Share the PERT chart with project stakeholders, team members, and anyone involved in the project. It provides a visual representation of the project plan and helps in coordinating efforts and managing expectations.
Step 13: Update and Maintain the PERT Chart
As the project progresses, update the PERT chart to reflect any changes, delays, or new tasks. Regularly review and maintain the chart to ensure its accuracy and relevance throughout the project lifecycle.
FAQs
What software or tools can I use to create a PERT chart?
There are various software tools available for creating PERT charts, such as Microsoft Project, Primavera P6, and online project management platforms like Asana, Trello, and SmartDraw.
Can I use a PERT chart for agile project management?
While PERT charts are commonly used for traditional project management, they can also be adapted for agile methodologies by incorporating iterations, sprints, and user stories.
Are PERT charts suitable for all types of projects?
PERT charts are particularly useful for projects with complex task dependencies and where understanding critical paths and timelines is crucial. However, for smaller, less complex projects, a simpler task list or a Kanban board may be more appropriate.
Are PERT charts suitable for all industries?
Yes, PERT charts can be used in various industries such as construction, software development, manufacturing, event planning, and research projects. They are applicable to any project that involves multiple tasks and dependencies.
Are there any limitations or challenges associated with using PERT charts?
Some challenges include the complexity of managing large-scale projects with numerous tasks, dependencies, and changing requirements. Additionally, PERT charts rely on accurate task duration estimates, which can be difficult to obtain in certain situations.
What happens if there is a change in task dependencies during a project?
If there is a change in task dependencies, the PERT chart should be updated accordingly. The change may affect the critical path, project timelines, and resource allocation. By updating the chart, project managers can assess the impact of the change and make necessary adjustments.
Can a PERT chart help with resource management?
Yes, a PERT chart can assist in resource management by identifying the tasks that are critical and require close monitoring and allocation of resources. It helps in optimizing resource utilization and avoiding bottlenecks.





![Free Printable Pie Chart Templates [Excel, PDF, Word] Maker 1 Pie Chart](https://www.typecalendar.com/wp-content/uploads/2023/06/Pie-Chart-150x150.jpg 150w, https://www.typecalendar.com/wp-content/uploads/2023/06/Pie-Chart-1200x1200.jpg 1200w)
![Free Printable Reward Chart Templates [Word, PDF] Teachers 2 Reward Chart](https://www.typecalendar.com/wp-content/uploads/2023/03/Reward-Chart-150x150.jpg 150w, https://www.typecalendar.com/wp-content/uploads/2023/03/Reward-Chart-1200x1200.jpg 1200w)
![Free Printable Roommate Agreement Templates [Word, PDF] 3 Roommate Agreement](https://www.typecalendar.com/wp-content/uploads/2023/06/Roommate-Agreement-150x150.jpg)
