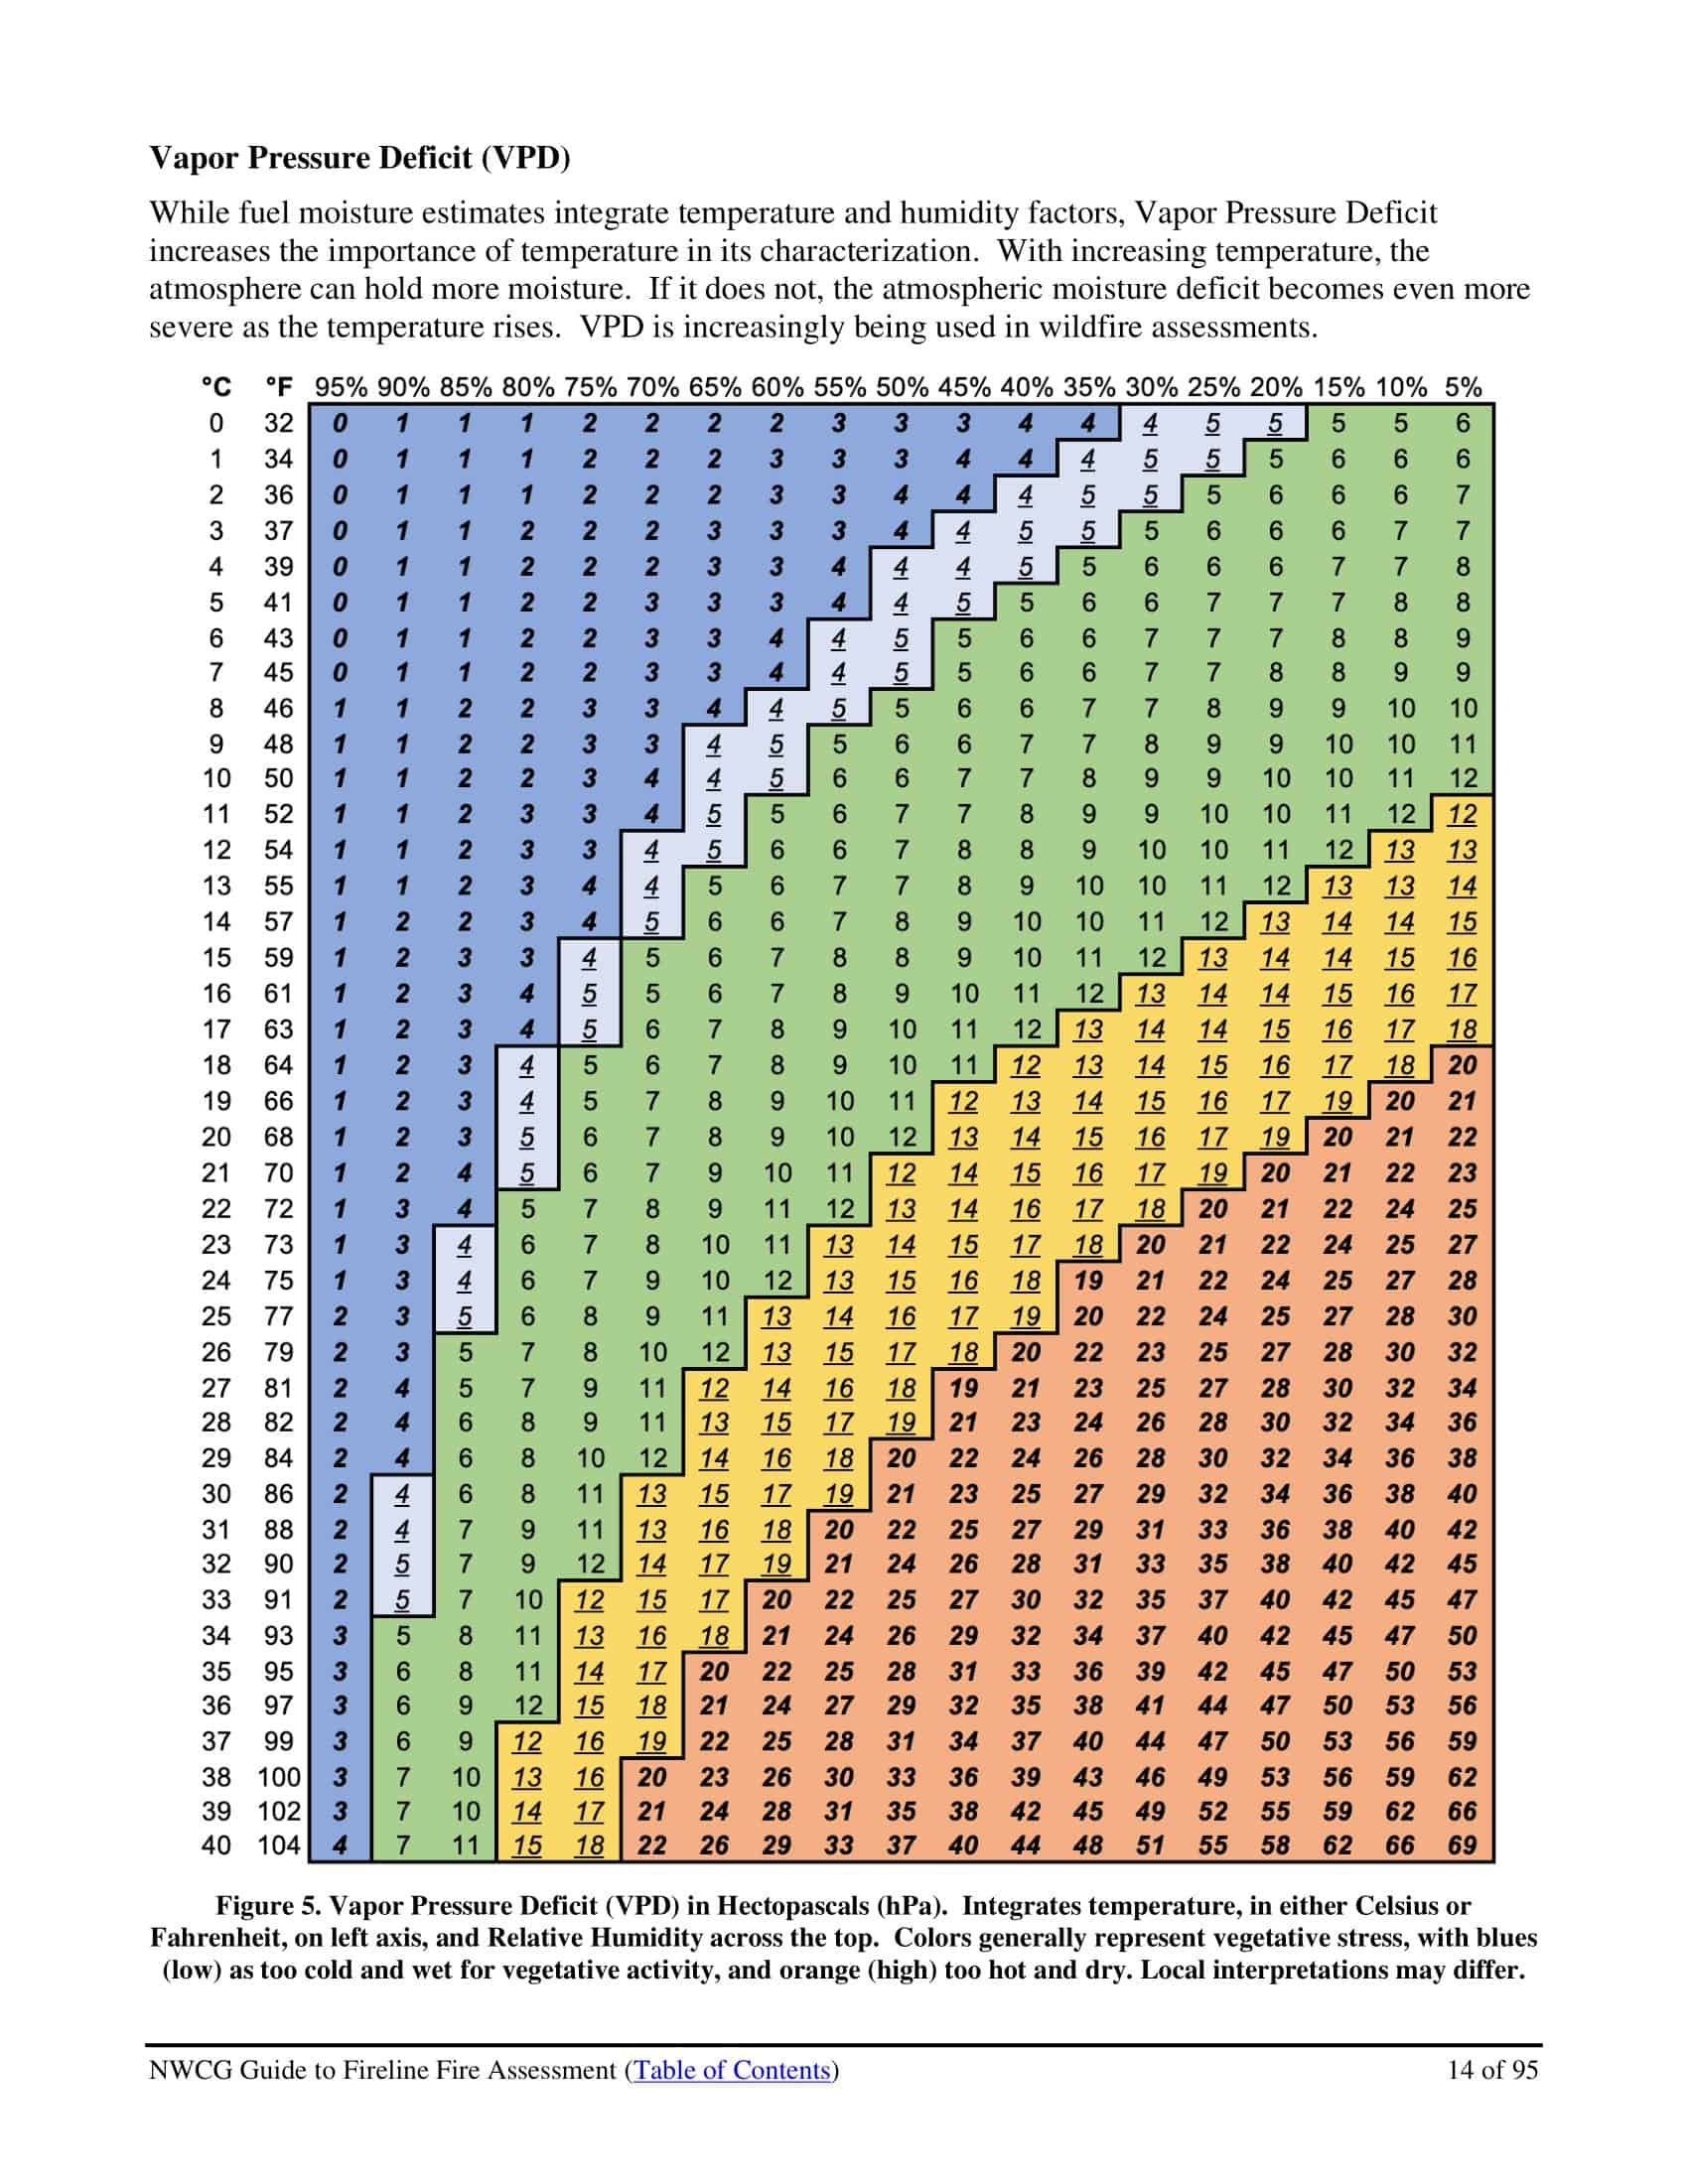
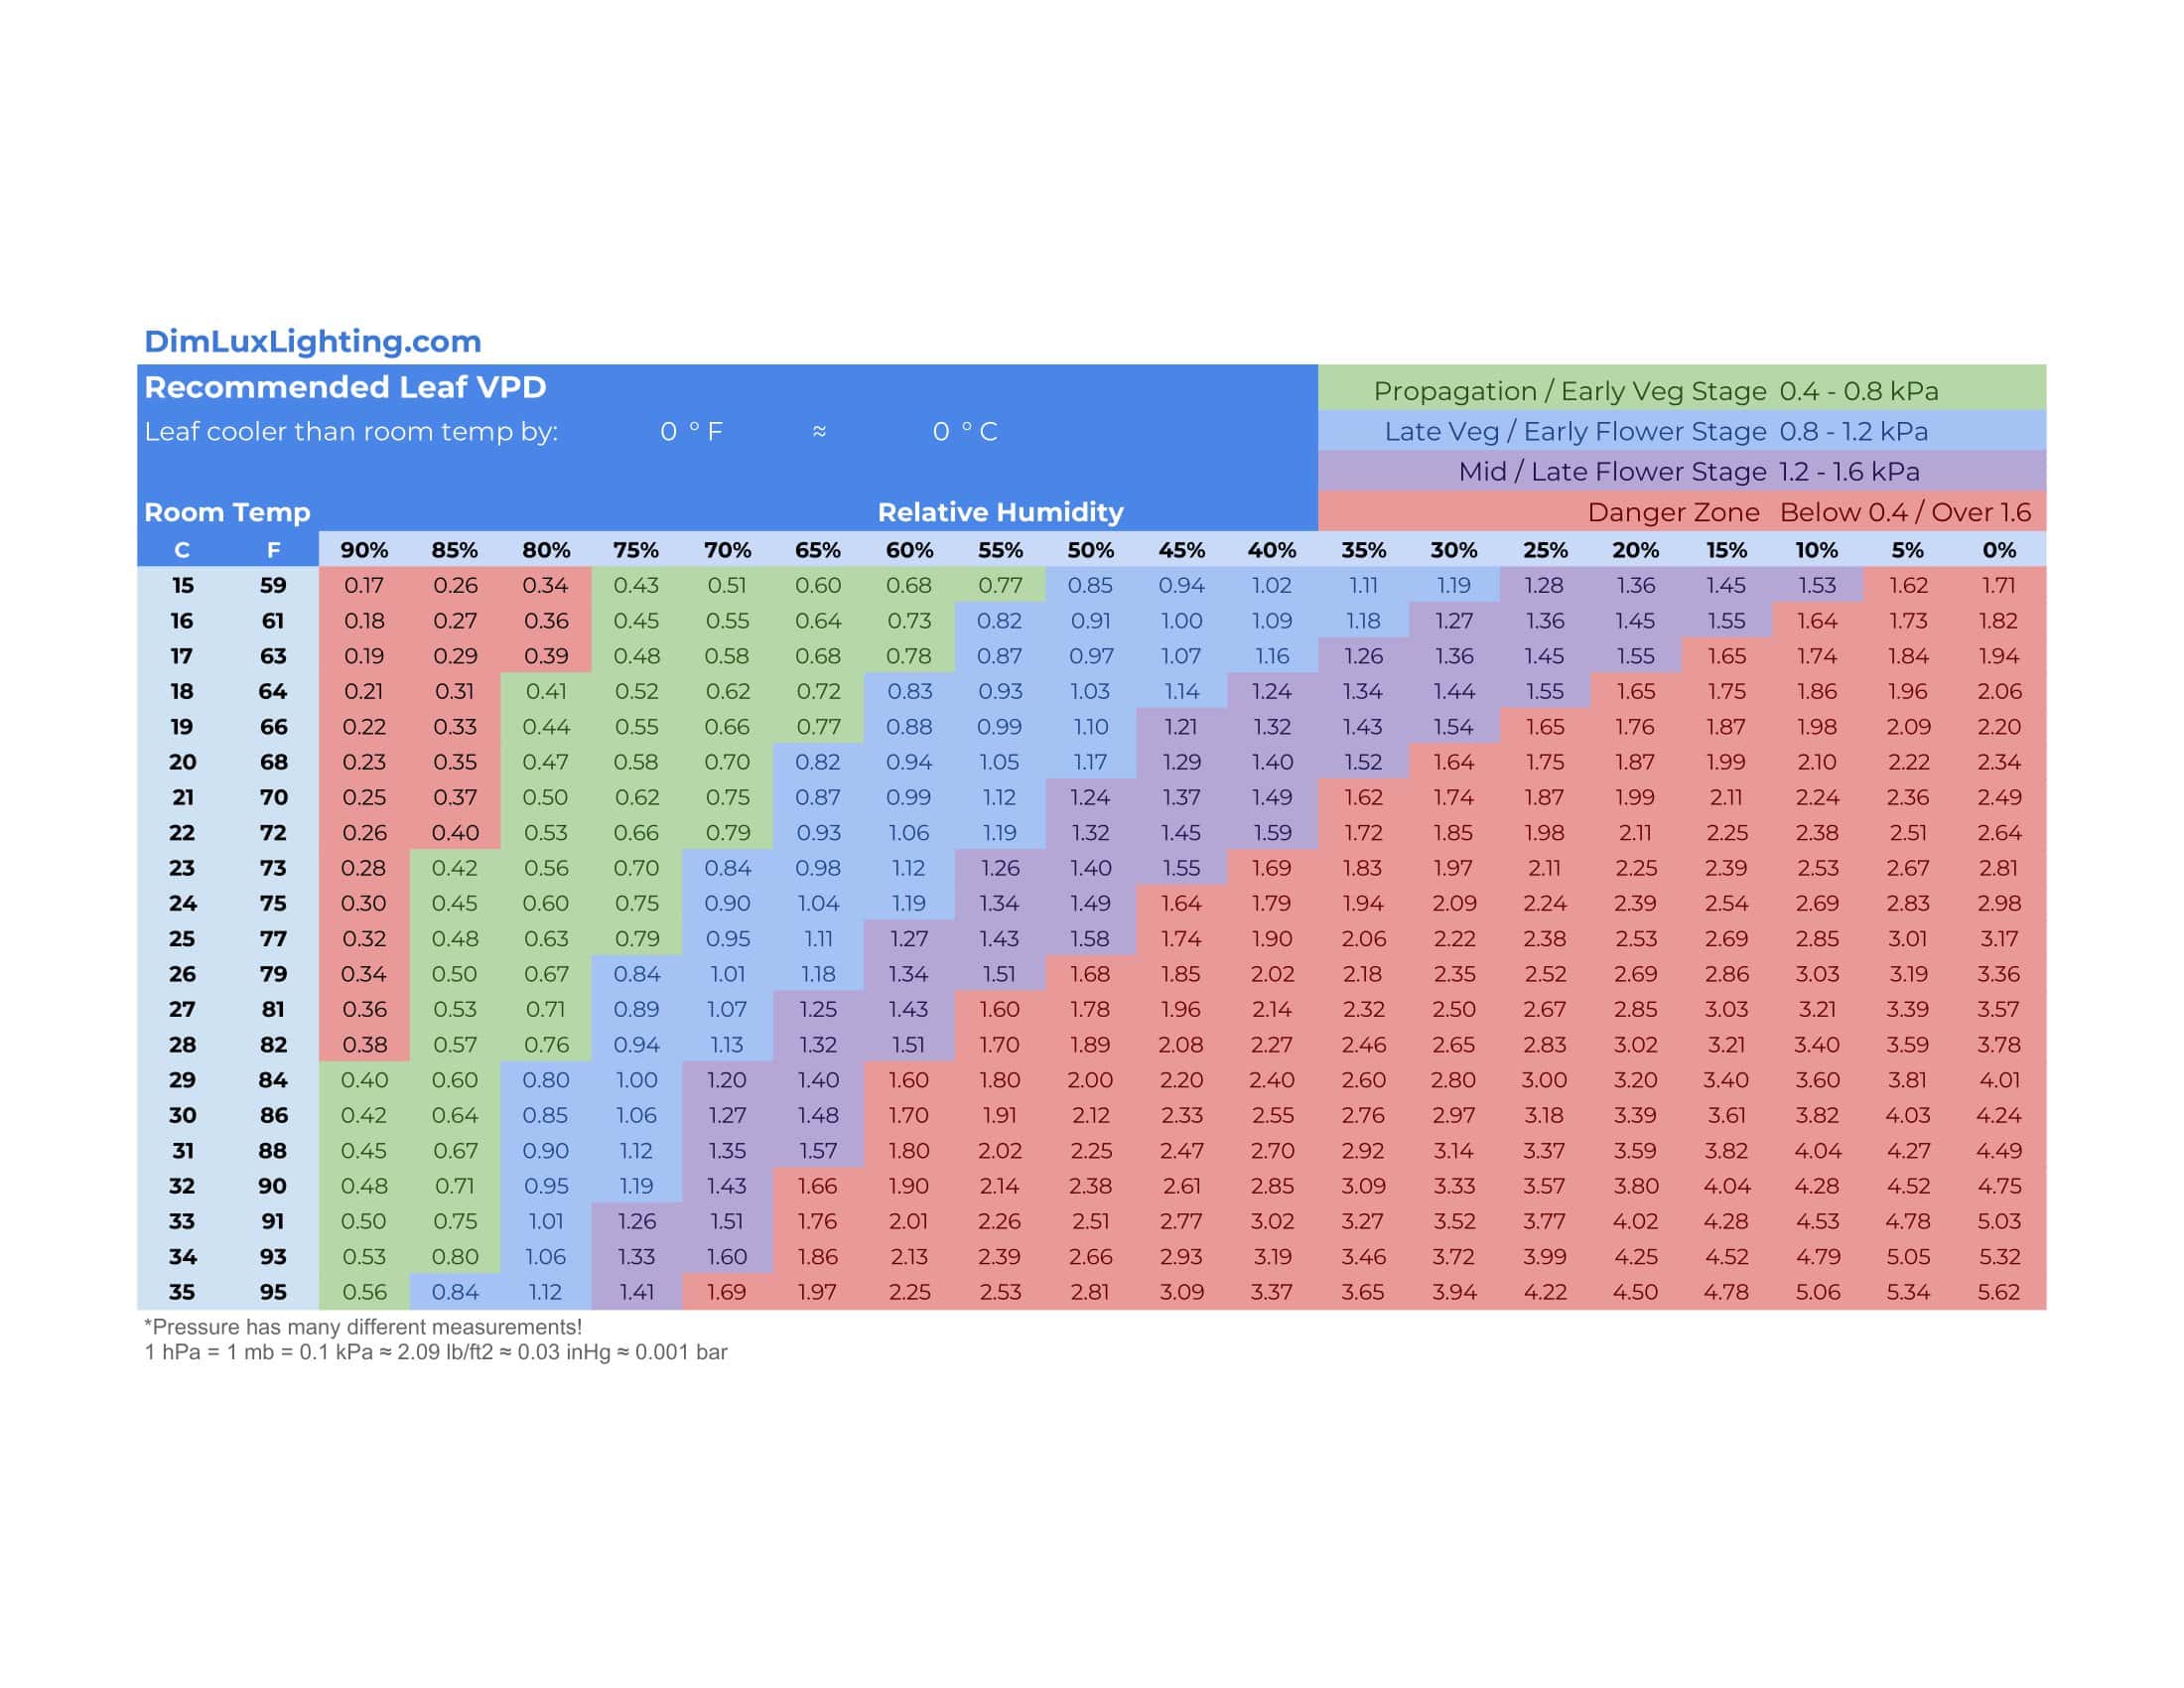
Although the greenhouse temperature remains constant, a shift in humidity around the leaf surface can leave plants dehydrated or susceptible to fungal diseases. The Vapor Pressure Deficit (VPD) is what describes this exact balance.

The correct VPD range opens the leaf’s stomata wide and maximizes the rate of photosynthesis, while the wrong range wastes the roots’ water intake. More than 25 VPD Chart PDF’s prepared by TypeCalendar show combinations of temperature from 15 °C to 35 °C, relative humidity from 20% to 90% with color blocks, presenting the “sweating comfort zone of the plant” at a glance.
Table of Contents
VPD Charts Printable
File Formats
Print‑ready PDF versions are available in A4 and US‑Letter sizes at 300 dpi resolution, with yellow warning tape indicating the ‘stress zone’, green ‘ideal hook’, and blue ‘disease risk’ range. In Word (.docx) versions, color codes are fixed and note fields are unlocked; you can add your weekly irrigation or fertilizer regimen line by line.
Google Docs replicas allow live editing with teammates, and when your humidity sensor changes the %RH value, the color blocks in the table are updated with automatic conditional formatting. Full vector SVG files are quickly recolorized to your brand palette in Illustrator or Canva, producing pixel-free graphics for a social media newsletter or e‑commerce blog.vector SVG files are quickly recolorized to your brand palette in Illustrator or Canva, producing pixel-free graphics for a sociation.
Application Scenarios — From Germination to Harvest
Hobby greenhouse owners can laminate the PDF and hang it next to the irrigation valve to read the morning readings in seconds. Hydroponic producers create an integrated control table by linking pH and EC values to VPD color in the Excel version. Botany teachers have students enter temperature‑humidity values each day in Google Docs charts, which automatically generate a day by day VPD series. Organic farmers working in windy outdoor environments can convert the SVG file to a 1080 × 1920 px vertical PNG and save it to their mobile phone, making the reference ready instantly.
Design Details
The temperature is listed in the left vertical axis of the table in 5 °C intervals, and the relative humidity is listed in the upper horizontal axis in 10% steps. Instead of sharp borders, color blocks with pastel transitions were chosen, so that color saturation differences on the monitor or printer do not affect readability. A small “kPa” label is printed on each cell, so the experienced grower can directly compare the value on the sensor screen. The QR code in the lower left corner directs you to the Cornell Controlled Environment Agriculture VPD guide, providing detailed academic data at your fingertips.
Download and Perfect Your VPD Control
Download TypeCalendar’s VPD Chart templates pack now and print the PDF, hang it next to the sensor, attach your fertilizer plan in Word or edit and share the SVG to suit your brand. With the right vapor pressure deficit, leaves can breathe and roots can draw water effortlessly, increasing efficiency is just a few clicks away.


![Free Printable Morse Code Charts [Numbers, Alphabet] 1 Morse Code Chart](https://www.typecalendar.com/wp-content/uploads/2023/09/Morse-Code-Chart-150x150.jpg)

![43+ Free Printable 134A PT Charts [Download PDF] 3 134A PT Chart](https://www.typecalendar.com/wp-content/uploads/2023/09/134A-PT-Chart-150x150.jpg)
