Increased waste on the production line, a wave of recurring customer service complaints, and endless software deployment errors all signal the same thing: a deeper problem. Whatever the symptom, our first reaction is to ask, “Why did it happen?” yet behind that single question lies a branching network of causes.
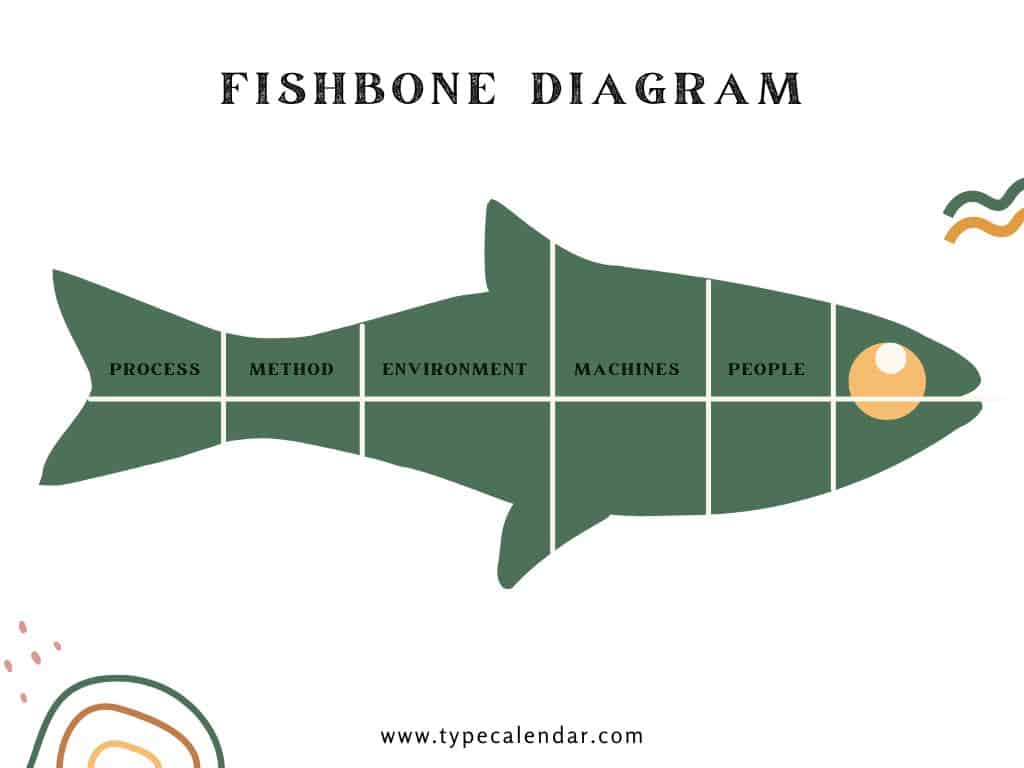
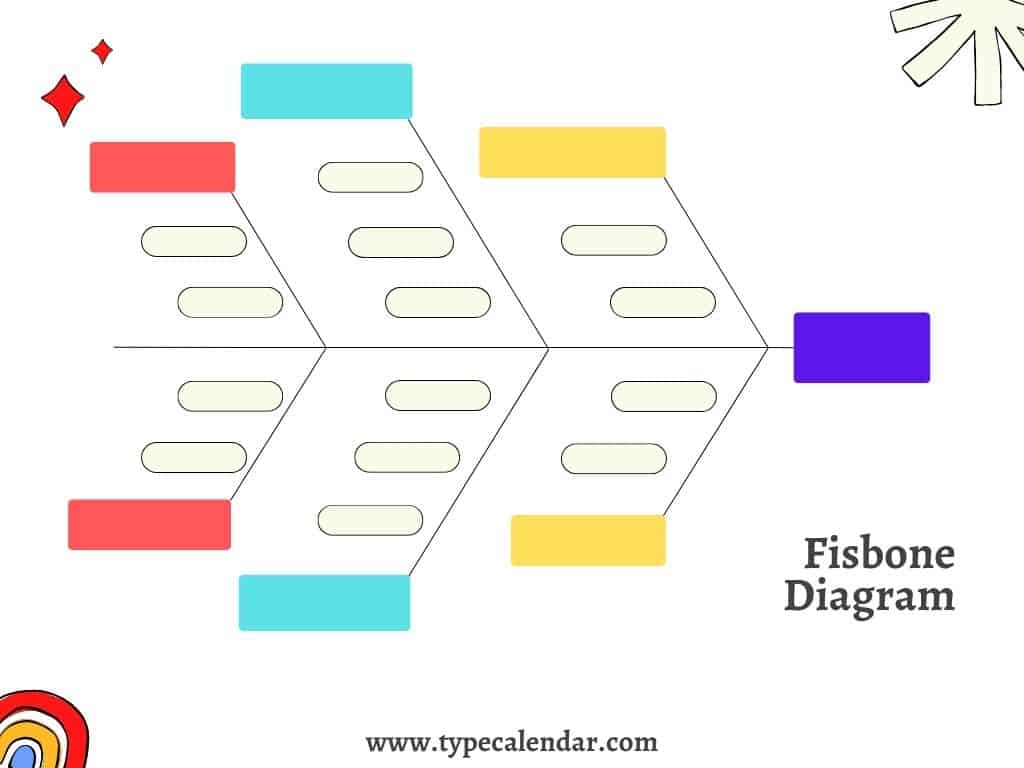
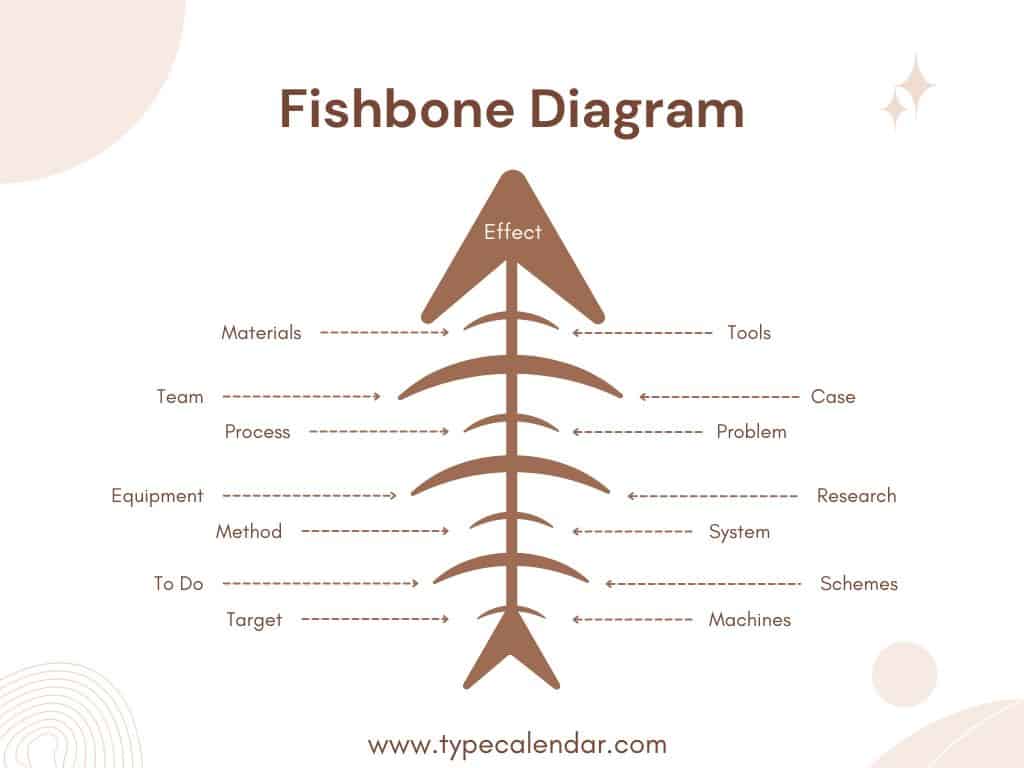
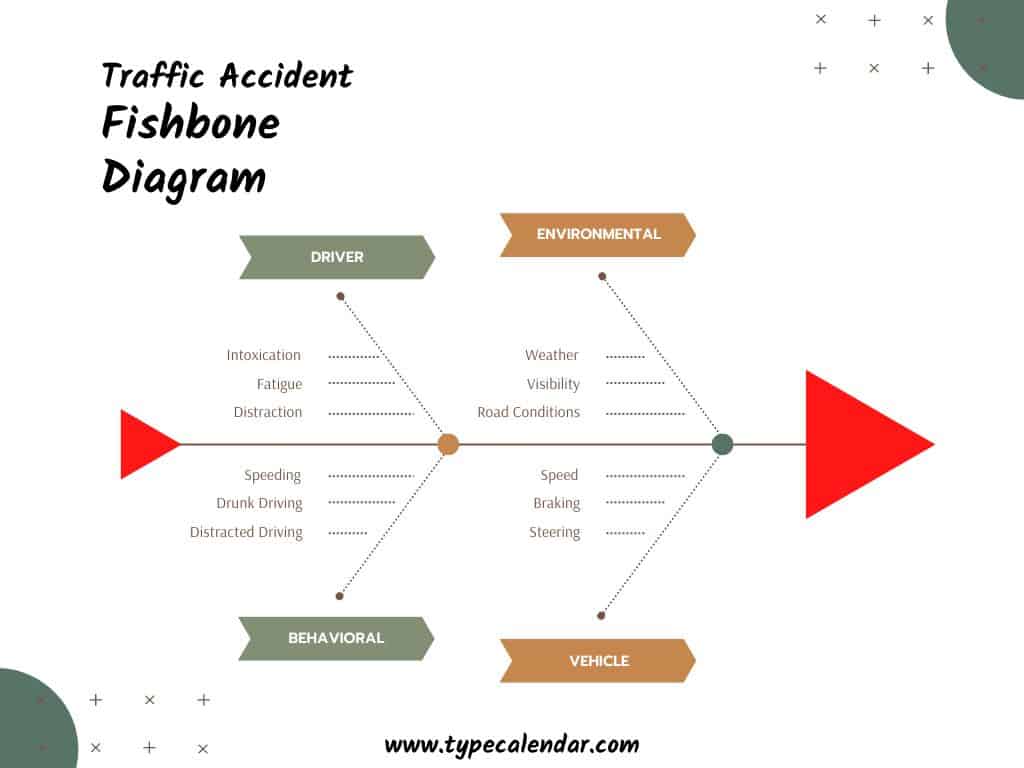
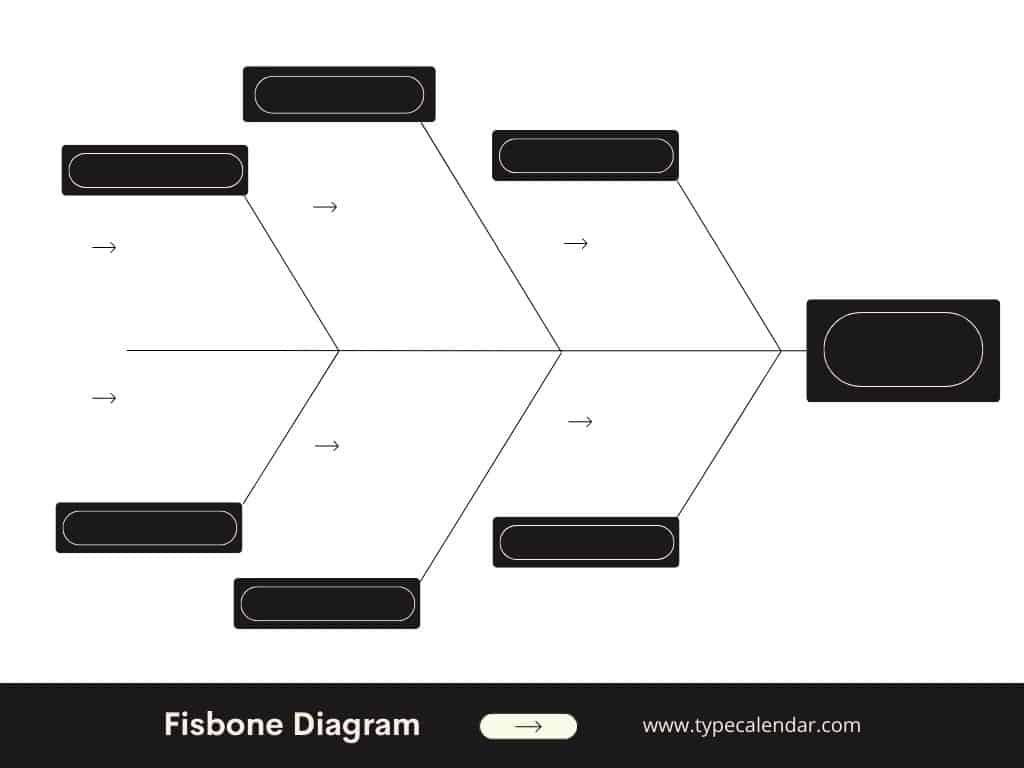
The Fishbone Diagram (Ishikawa diagram) visualizes this network and systematizes brainstorming: the sub-factors placed in the bone branches such as “Human”, “Machine”, “Method”, “Material”, “Environment” and “Measurement” reveal the path to the root cause. TypeCalendar offers 20+ Fishbone templates covering manufacturing, software, healthcare, and logistics. Each one turns chaotic brainstorming into an organized map.
Table of Contents
Editable Fishbone Templates

The standard PDFs are A4 and US‑Letter at 300 dpi, formatted so lines print edge‑to‑edge on any office printer. In the Word (.docx) and Google Docs files, branch end text boxes are unlocked, so you can drop in personnel shortages under “People,” or procedure gaps under “Method,” in seconds.
Because the Excel and Google Sheets versions tie each branch to a cell, sub reasons auto group in a pivot table, and a summary report is ready the moment the meeting ends. Scalable SVG and PowerPoint templates adapt to any corporate palette and stay perfectly crisp in executive slides.
For remote first teams, every package includes a live Miro board where participants can add virtual sticky notes in real time.
Fishbone Diagram Templates
Visual Design Tweaks that Speed Root Cause Analysis
Each main branch has its own color (e.g., Materials = pale green, Machinery = steel blue), making recurring sub‑causes easy to spot during the session. A definition block captures date, impact, and measurable loss, giving you the raw data for classic 5 W + 1 H questioning. A 0.5 mm dotted ruler runs down the left margin of every PDF, keeping scale consistent if you add extra tabs mid meeting.
How to Run a Fishbone Session Step by Step
To start a Fishbone session, simply open a blank template.First, state the problem’s impact on the diagram’s spine: “Monthly production waste has risen to 12 %.” Next, read each branch title aloud, place your sub‑causes along the lines, and add new bones as needed using the PDF’s guide. At the end of the meeting, fill in the “Corrective Action – Responsible – Target Date” boxes in the Word version; the automatic gantt view in the Excel version speeds up the weekly follow-up of actions.
20+ Ready Made Fishbone Diagram Templates You Can Use Right Now
TypeCalendar’s 20+ Fishbone templates are ready to download; fill in one line and you have a finished root cause map. Because every format PDF, Word, Google Docs, Excel, SVG, PowerPoint, and Miro ships in one pack, you can begin in seconds, whether you print a shop floor poster or open a Zoom whiteboard. Pick a template, flesh out the branches with your team, then print the diagram or export it to PDF root cause clarity and durable fixes are only a download and a few keystrokes away.












![Free Printable Roommate Agreement Templates [Word, PDF] 1 Roommate Agreement](https://www.typecalendar.com/wp-content/uploads/2023/06/Roommate-Agreement-150x150.jpg)
![Free Printable Credit Card Authorization Form Templates [PDF, Word, Excel] 2 Credit Card Authorization Form](https://www.typecalendar.com/wp-content/uploads/2023/06/Credit-Card-Authorization-Form-150x150.jpg)
![Free Printable Stock Ledger Templates [Excel,PDF, Word] 3 Stock Ledger](https://www.typecalendar.com/wp-content/uploads/2023/08/Stock-Ledger-150x150.jpg)
