A break-even analysis is a tool that helps businesses determine the point at which their revenues are equal to their costs. At this point, the business is said to have “broken even,” meaning that it is neither making a profit nor incurring a loss. Break-even analysis is often used to determine the minimum price that a business must charge for its products or services in order to cover its costs and make a profit.
It can also be used to calculate the minimum level of production or sales that a business must achieve in order to break even. By understanding the relationship between costs, revenues, and profits, businesses can make informed decisions about pricing, production, and other factors that affect their bottom line.
Table of Contents
Break-Even Analysis Templates
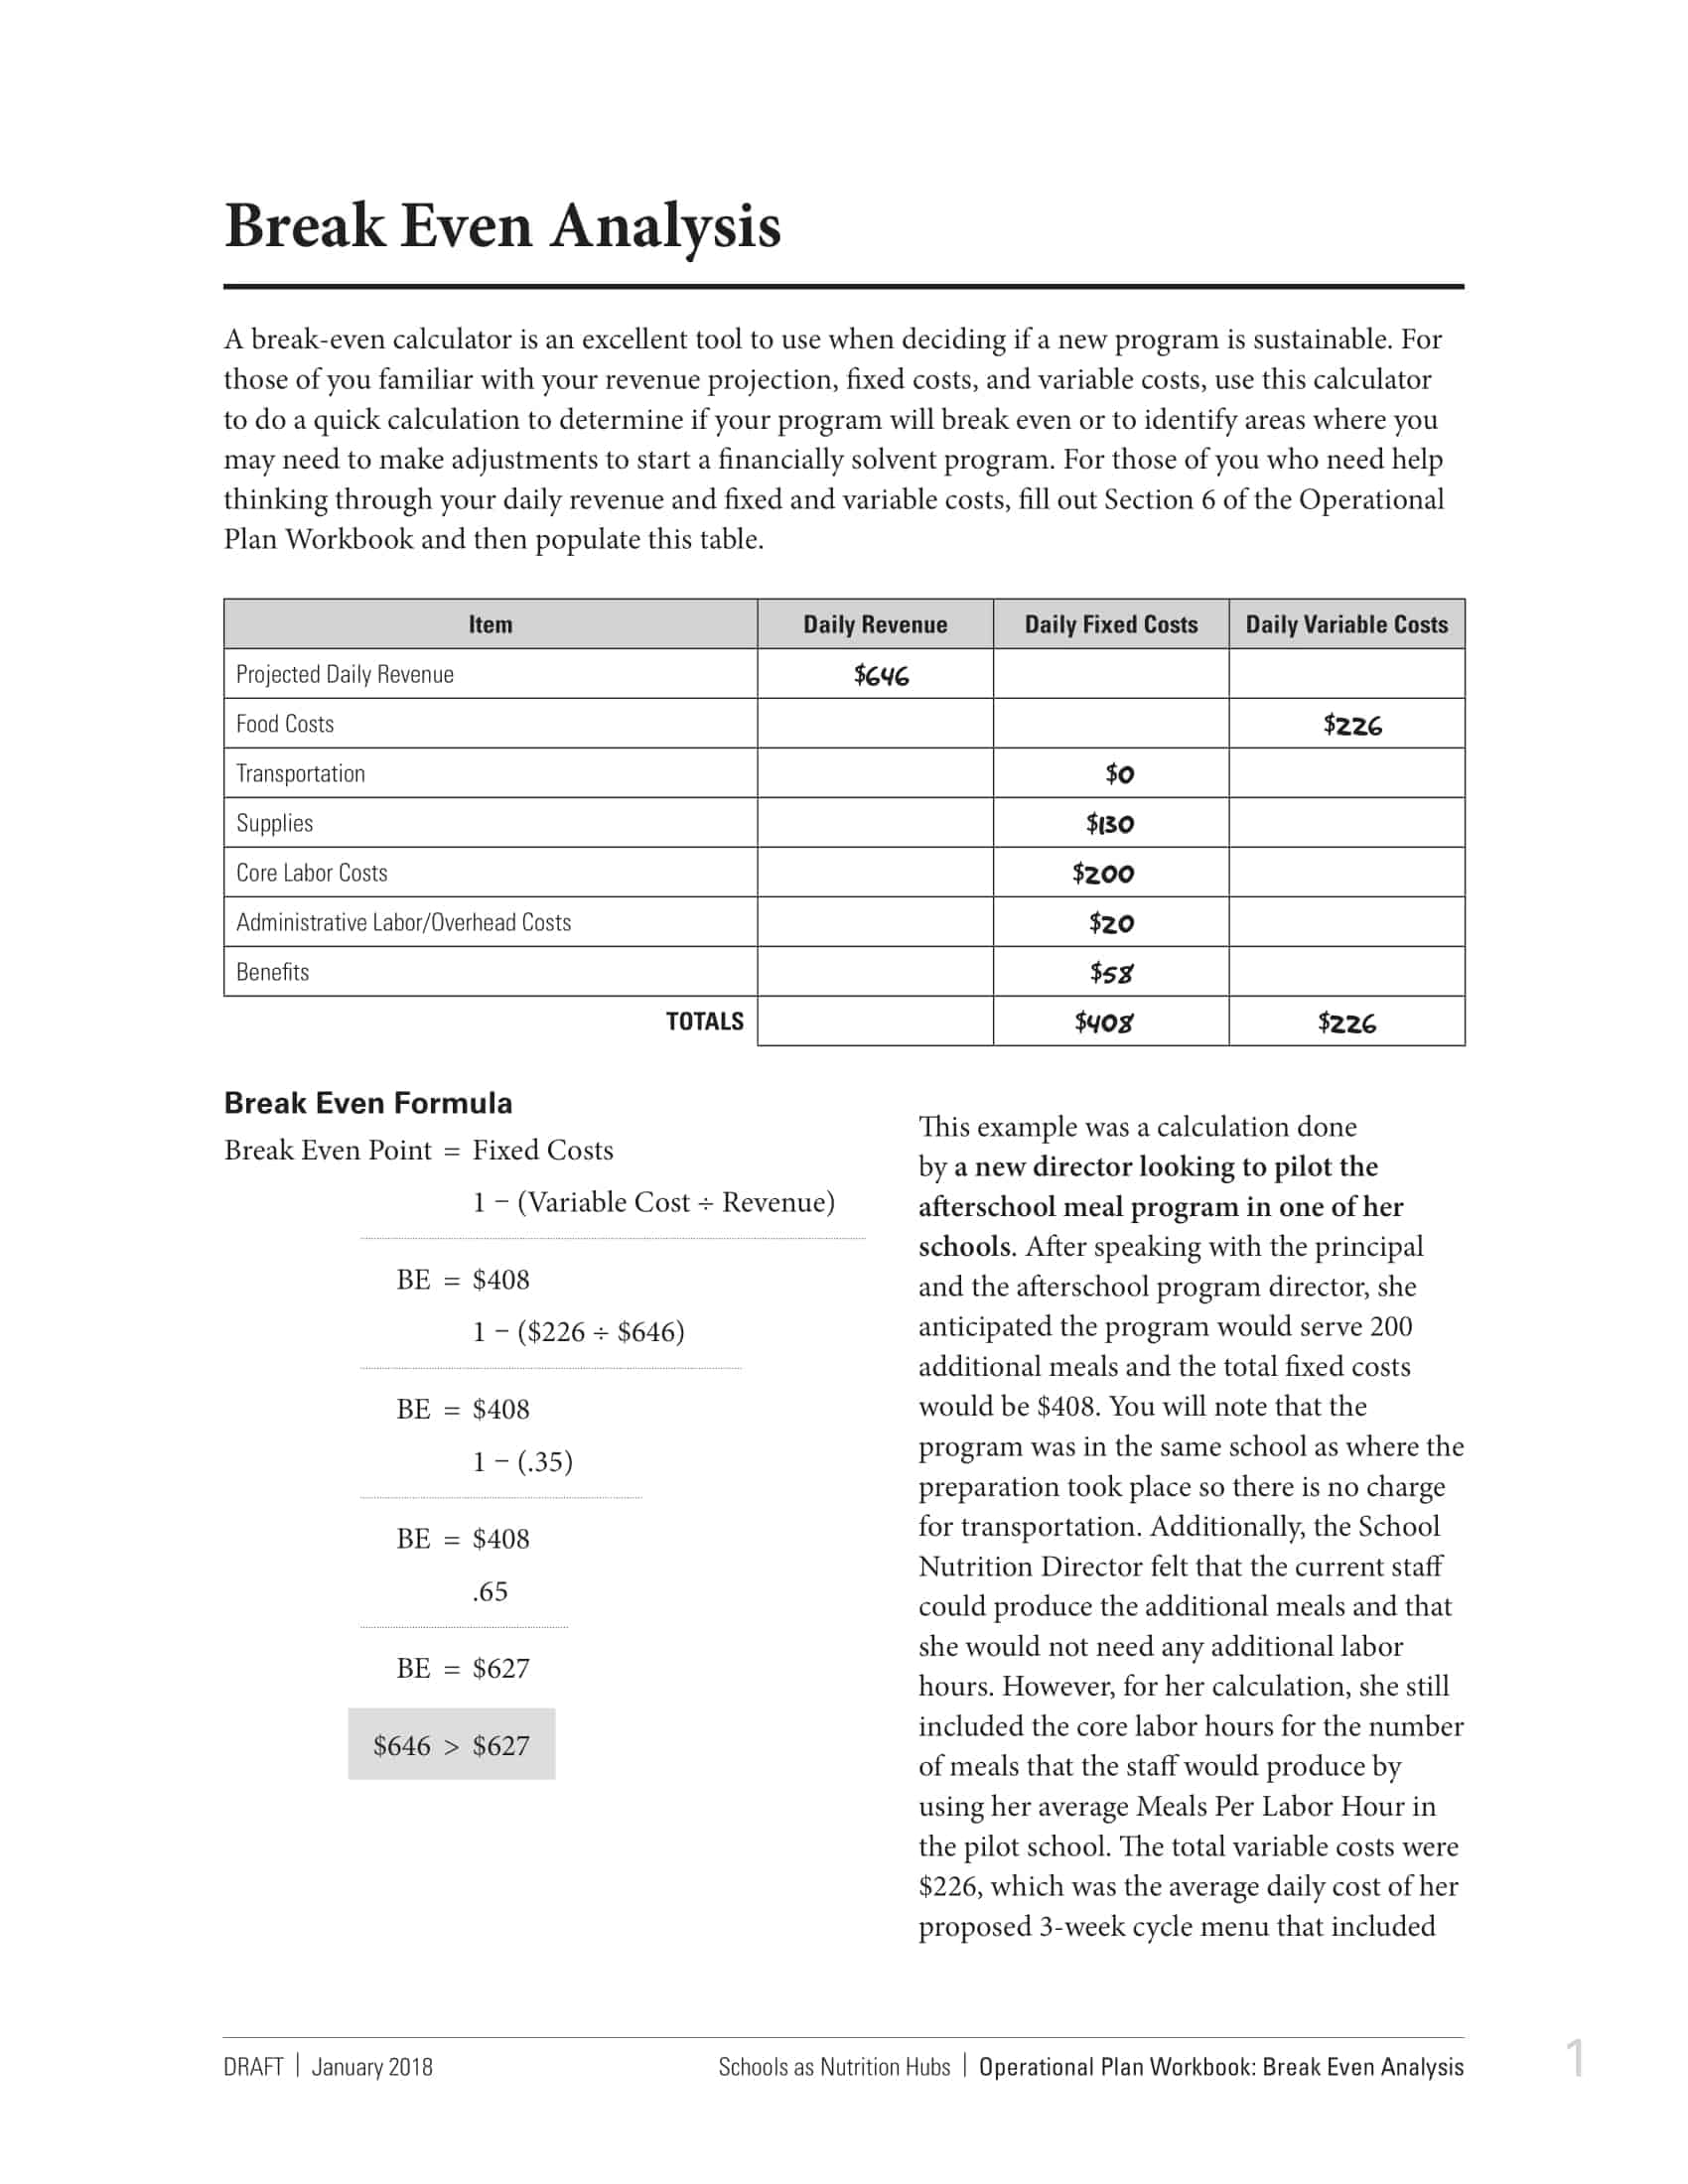
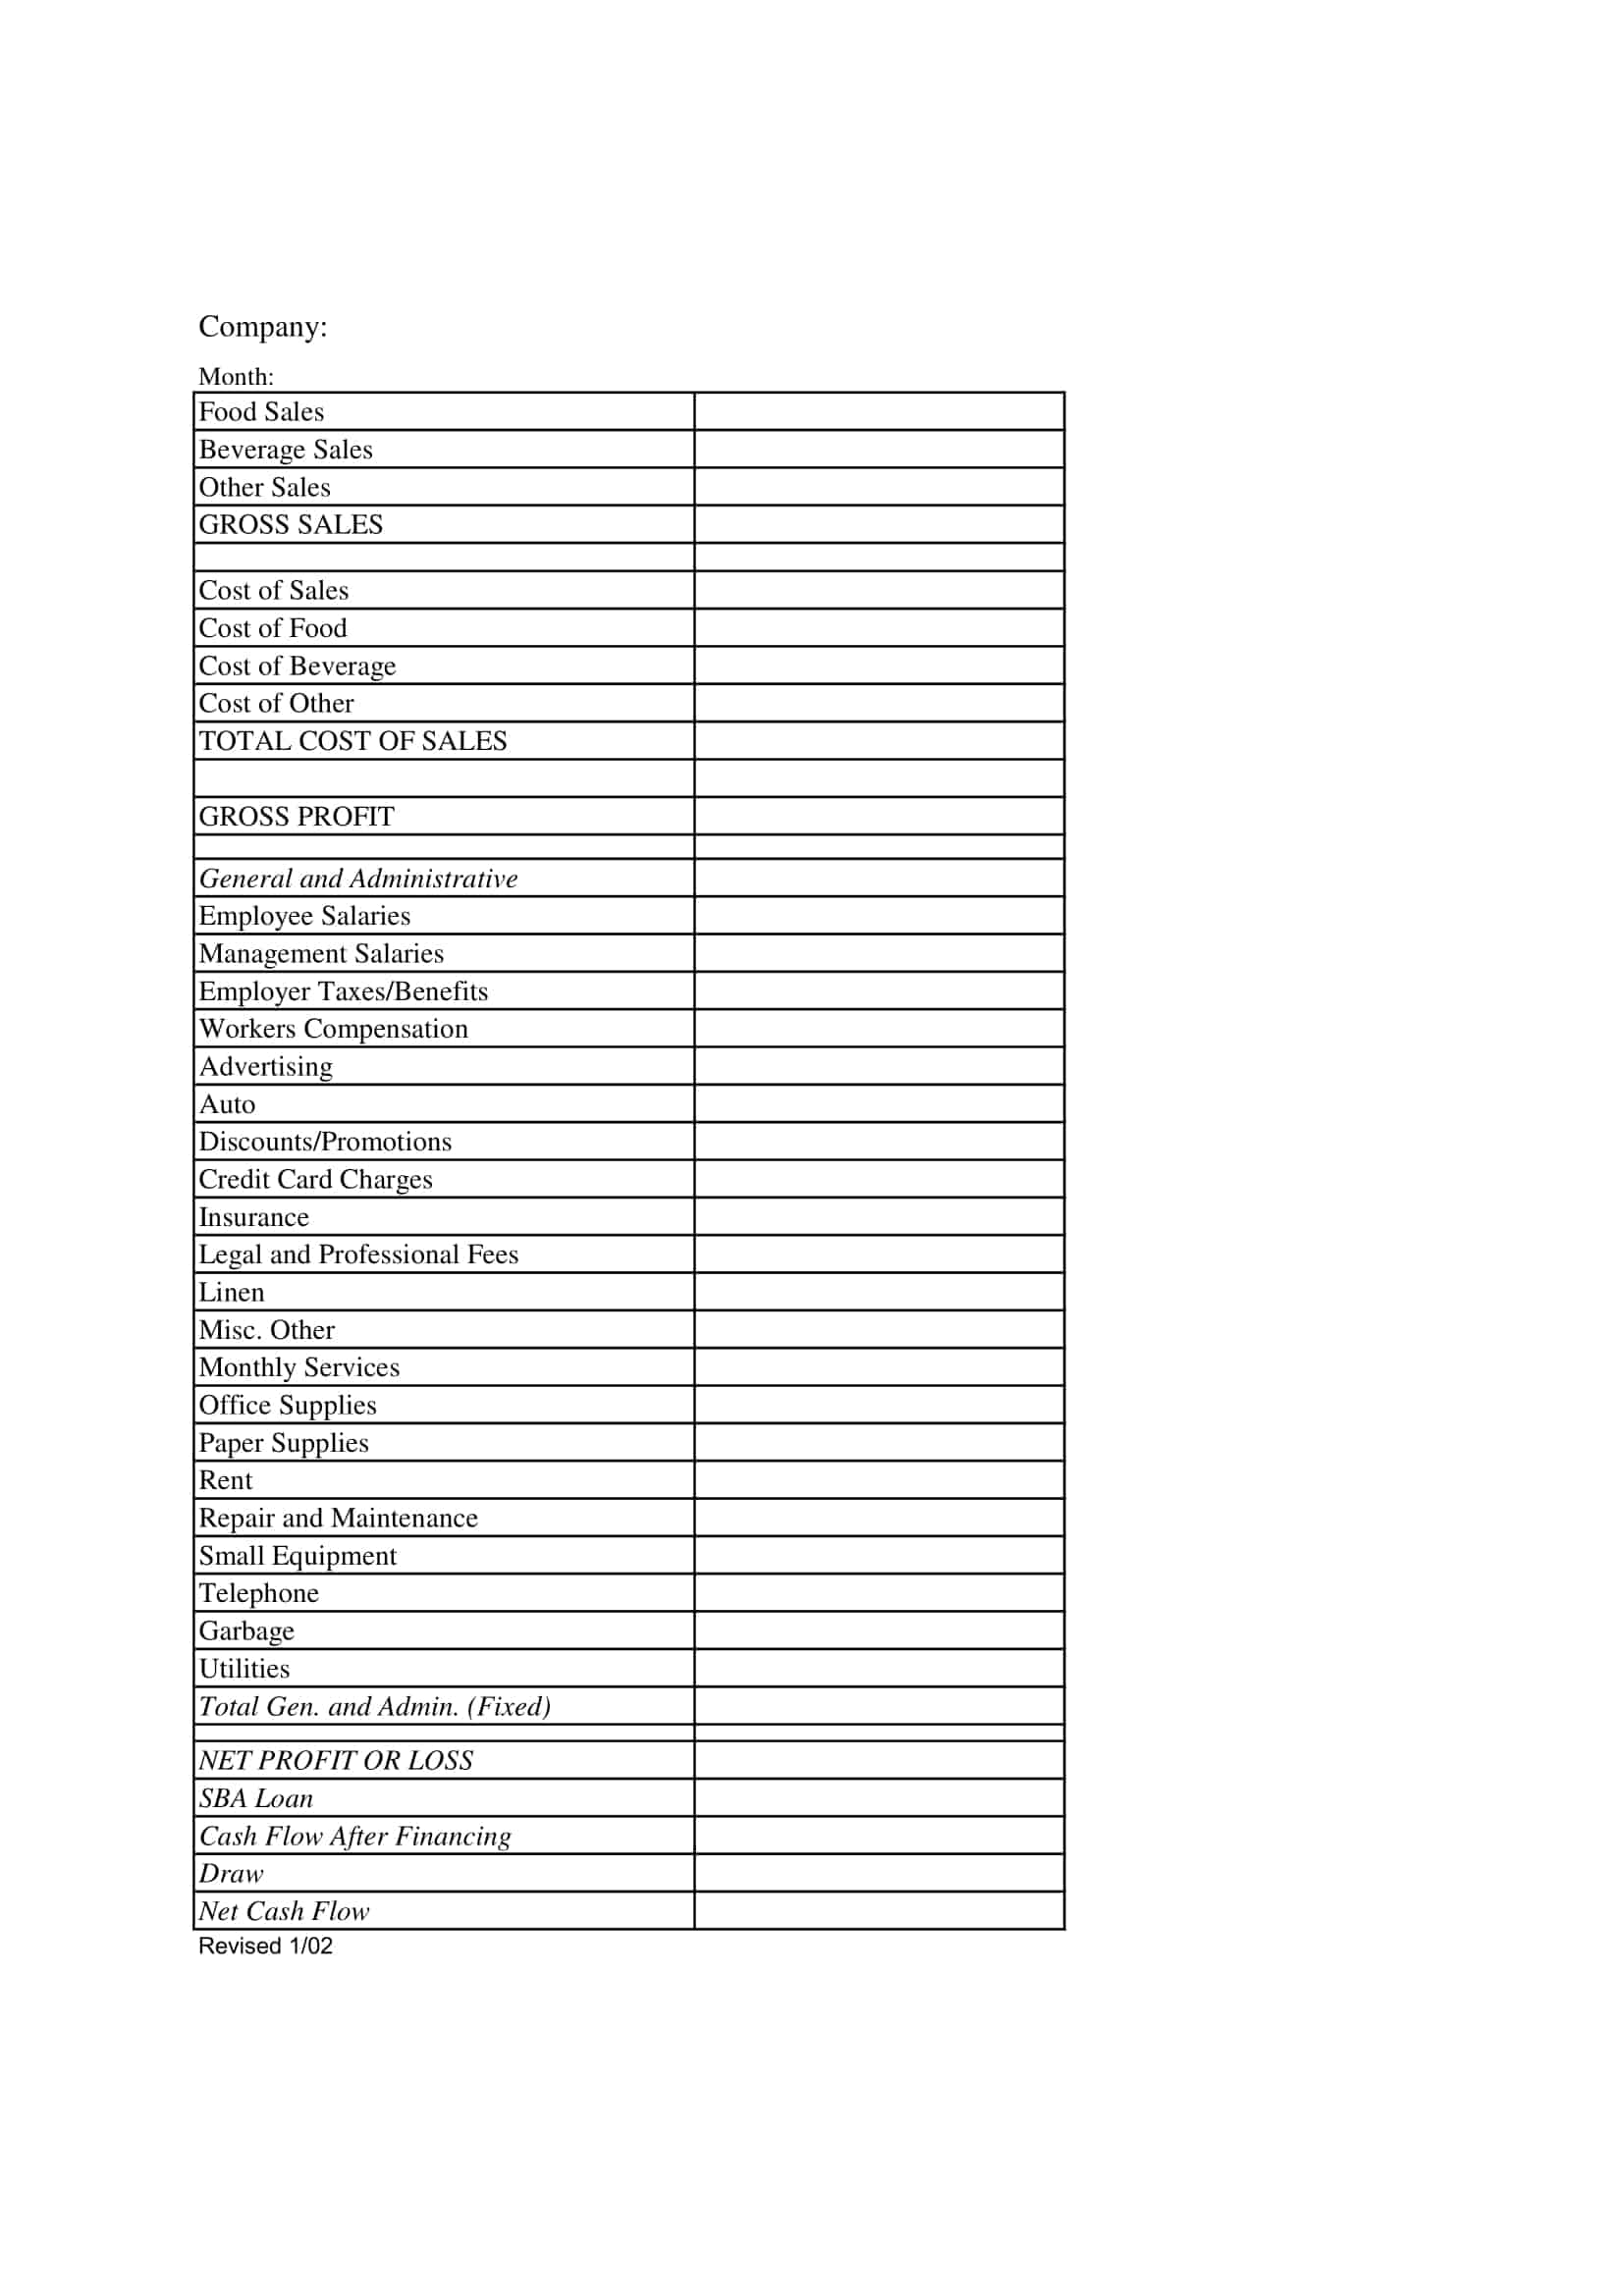
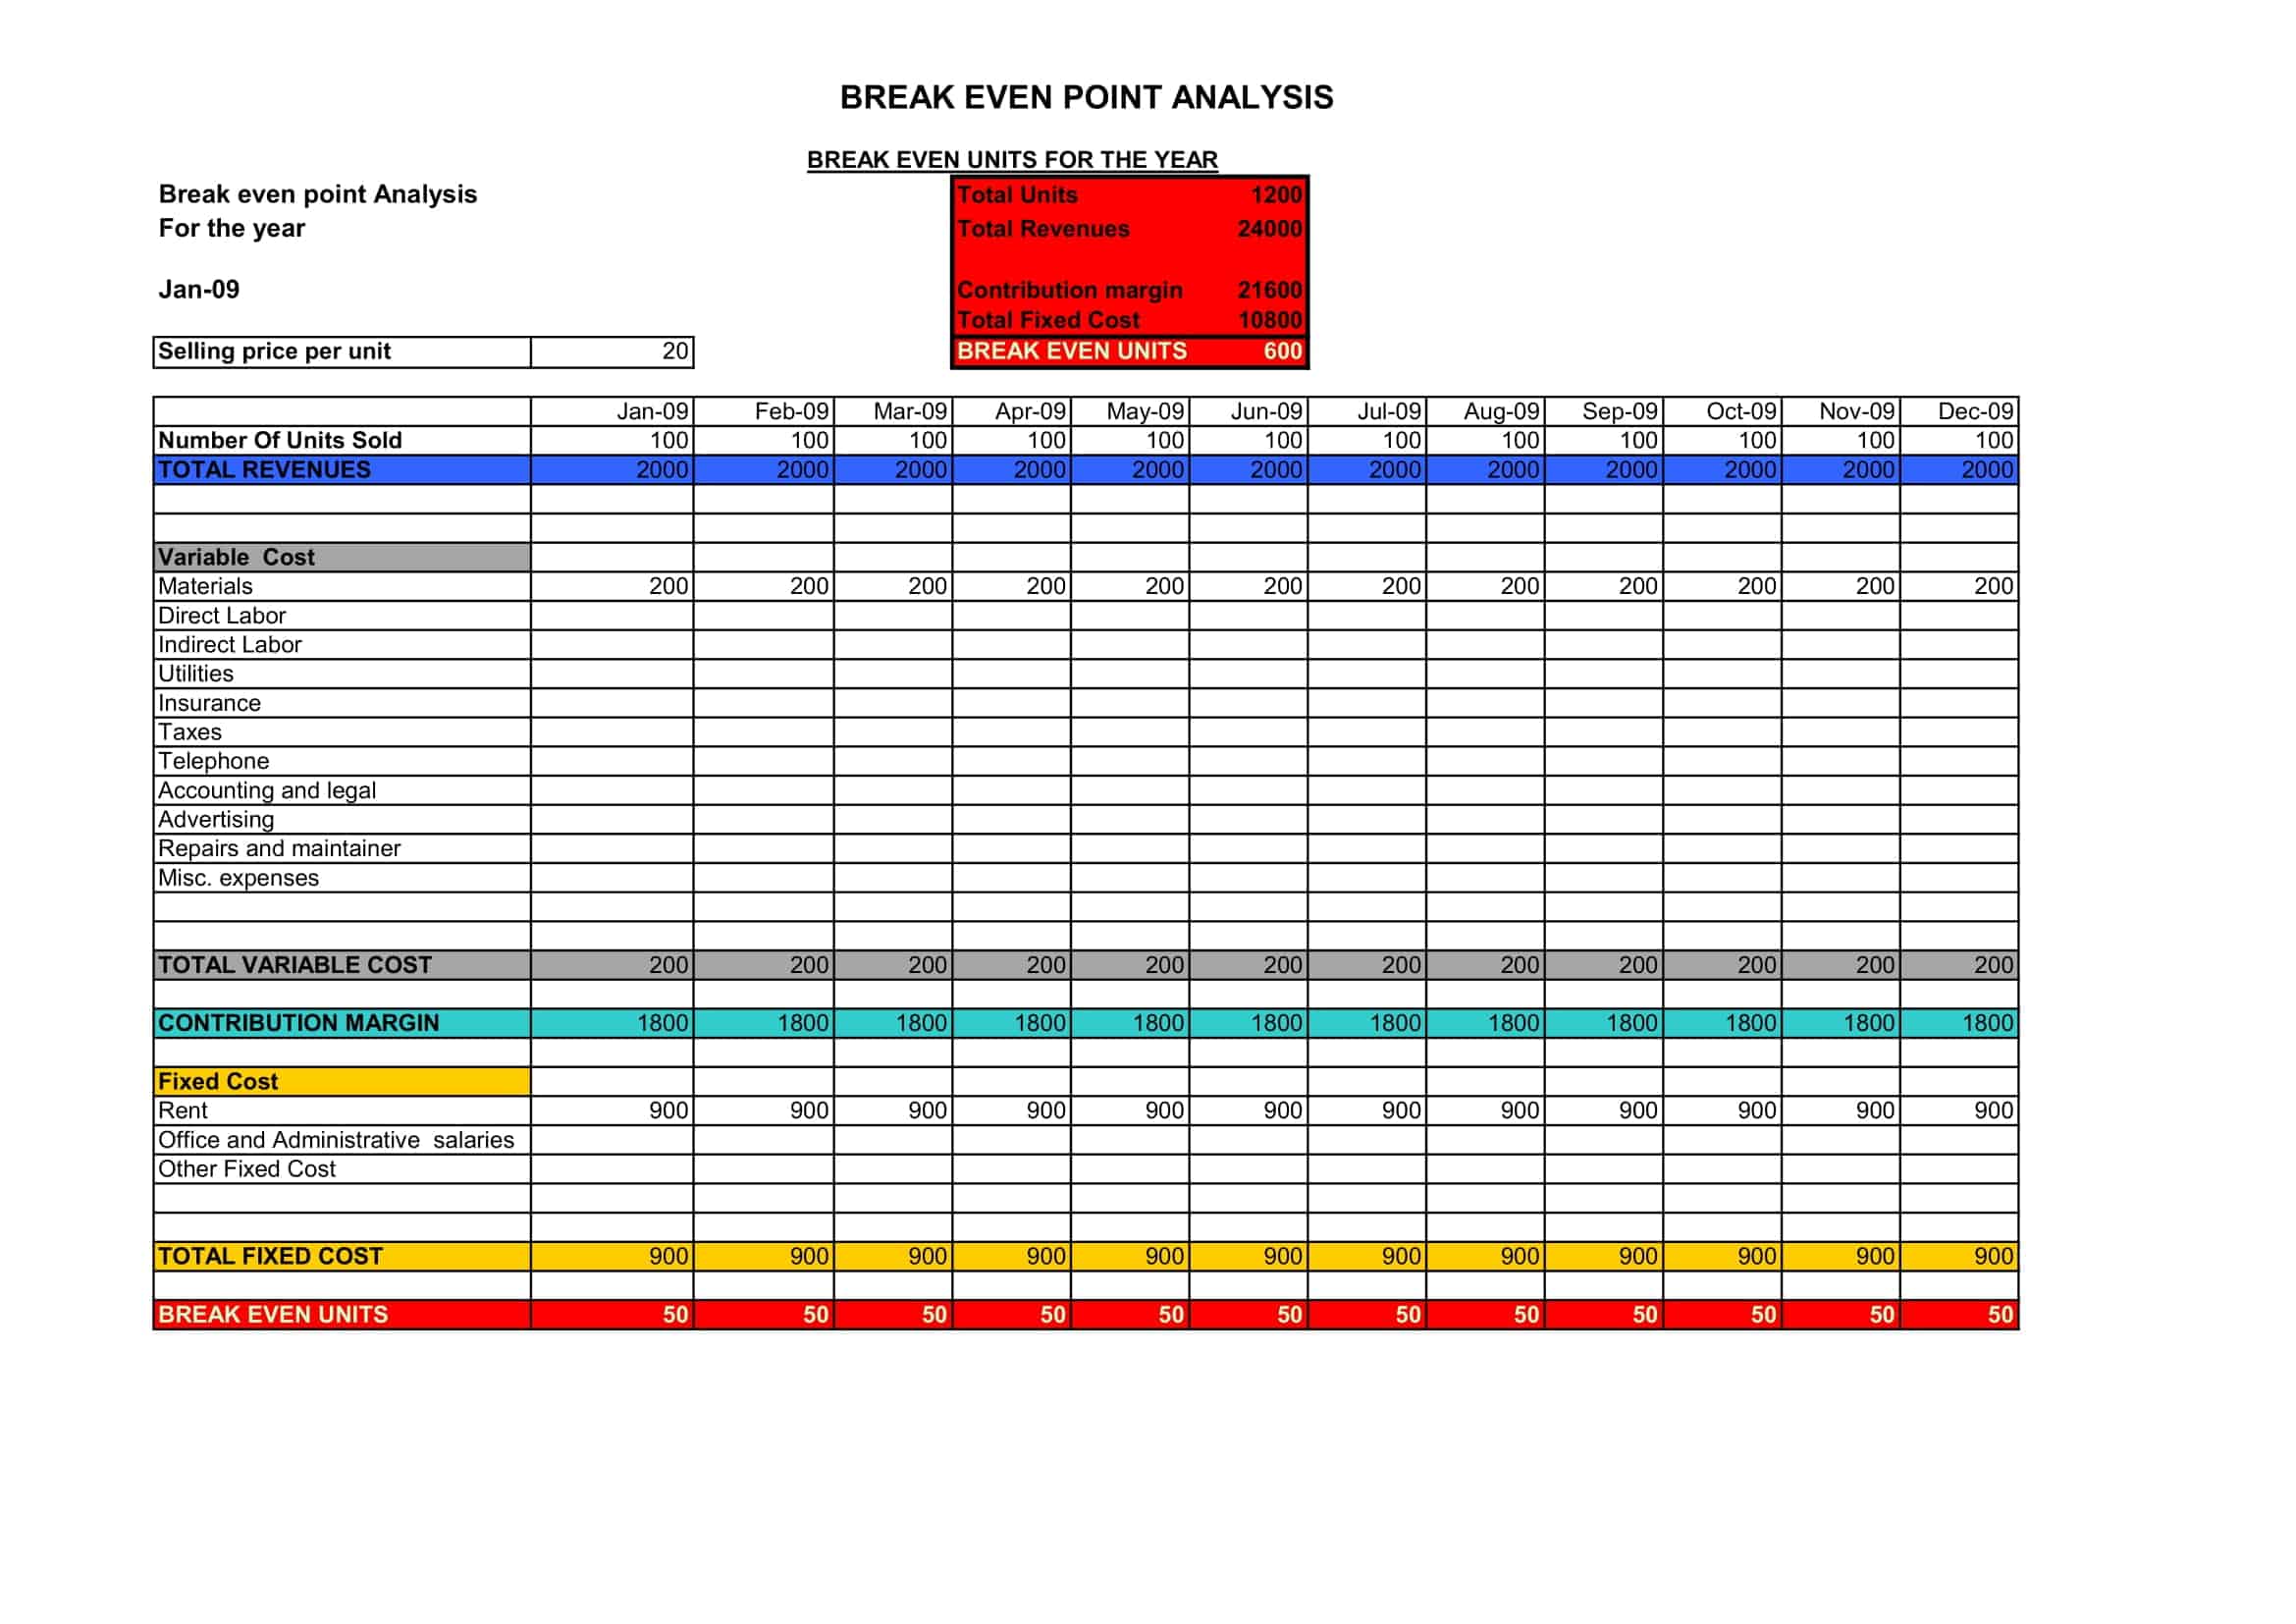
Break-even analysis templates are pre-designed tools that assist businesses in determining the point at which their total revenue equals total costs, resulting in neither profit nor loss. These templates provide a structured framework for analyzing the financial feasibility of a product, service, or business venture.
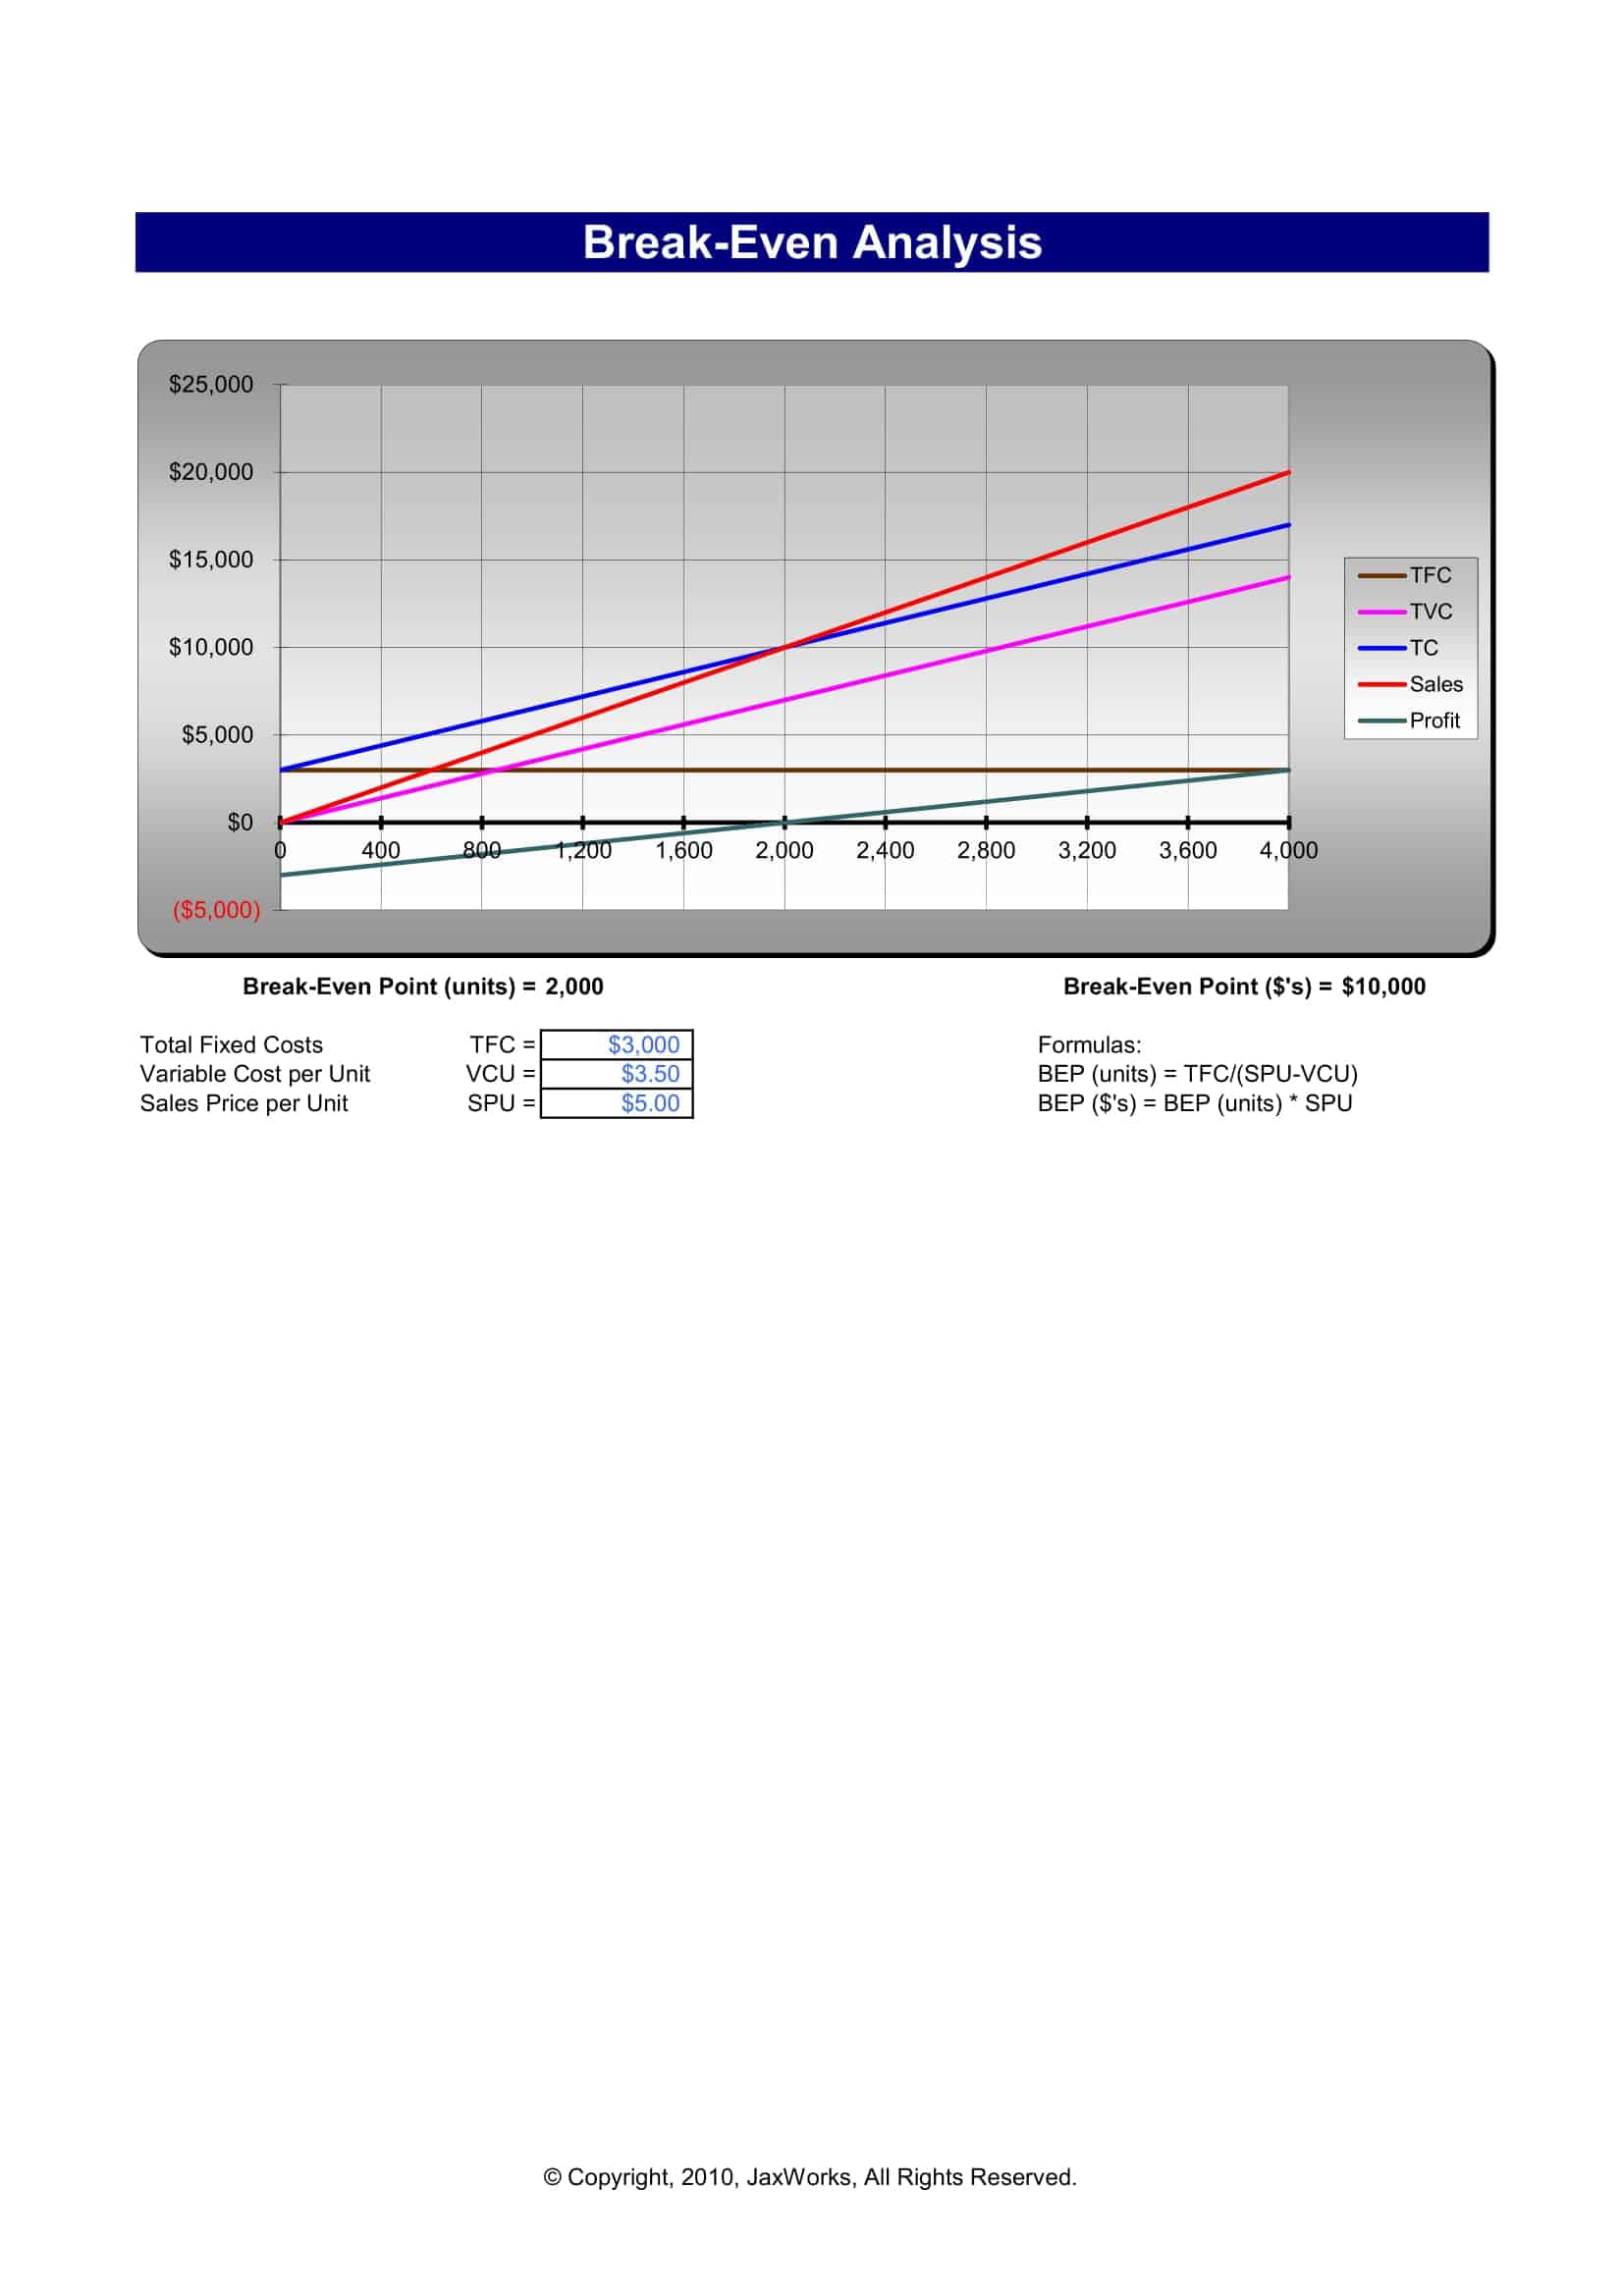
Break-even analysis templates typically include sections for entering key financial data such as fixed costs, variable costs per unit, and selling price per unit. They often incorporate charts or graphs that visually illustrate the relationship between costs, revenue, and profitability at different levels of output or sales.
Using a break-even analysis template allows businesses to assess the minimum level of sales or production required to cover all costs and start generating profits. It helps determine the breakeven point, which is a vital reference for setting pricing strategies, evaluating business viability, or making informed decisions regarding production levels or cost management.
Purpose of Break-Even Analysis

The purpose of break-even analysis is to determine the point at which a company’s revenues are equal to its costs. This point is known as the “break-even point” and it is the point at which the company is neither making a profit nor a loss. Understanding the break-even point is important for a business because it helps to identify the minimum level of sales that the business needs to achieve in order to cover its costs and start making a profit.
Break-even analysis is a useful tool for financial planning and decision-making. It can help a business determine the minimum price at which it needs to sell its products or services in order to break even, and it can also help a business understand how changes in its costs or prices might affect its profitability.
Break-even analysis is also useful for identifying the relationship between fixed costs, variable costs, and sales. Fixed costs are expenses that do not vary with changes in the volume of goods or services produced, such as rent or insurance. Variable costs are expenses that do vary with changes in the volume of goods or services produced, such as the cost of raw materials or labor. By understanding the relationship between these costs and sales, a business can better predict its profitability and make more informed decisions about how to allocate its resources.
How Break-Even Analysis Works
Break-even analysis works by comparing the total revenues of a business to its total costs, in order to determine the point at which the business is neither making a profit nor a loss. This point is known as the “break-even point.”
To perform a break-even analysis, you will need to do the following:
Identify the fixed costs of your business
Fixed costs are expenses that do not vary with changes in the volume of goods or services produced, such as rent or insurance.
Identify the variable costs of your business
Variable costs are expenses that do vary with changes in the volume of goods or services produced, such as the cost of raw materials or labor.
Determine the price at which you will sell each unit of your product or service.
Calculate the break-even point in units by dividing the total fixed costs by the difference between the price per unit and the variable cost per unit.
Calculate the break-even point in sales dollars by multiplying the break-even point in units by the price per unit.
Plot the data on a graph by selecting the “Unit Sales” and “Net Income” columns and inserting a scatter plot. The break-even point will be the point at which the line for net income intersects the horizontal axis (at $0 net income).
By performing a break-even analysis, you can determine the minimum level of sales that your business needs to achieve in order to cover its costs and start making a profit. You can also use this analysis to understand how changes in your costs or prices might affect your profitability.
Key Terminology in Break-Even Analysis
It is important to be familiar with certain key terms and concepts. These include fixed costs, variable costs, and the break-even point. In this article, we will provide an overview of these and other key terminology in break-even analysis.
Here are some common terms used in break-even analysis:
Fixed costs: These are costs that do not vary with the level of production or sales. Examples include rent, insurance, and salaries.
Variable costs: These are costs that change with the level of production or sales. Examples include materials and supplies, and direct labor costs.
Total costs: The sum of fixed and variable costs.
Price: The amount that a customer pays for the product or service.
Revenue: The total amount of money received from the sale of products or services.
Contribution margin: The amount by which the price of a product or service exceeds its variable costs.
Break-even point: The point at which total revenues equal total costs, resulting in a profit of zero.
Margin of safety: The amount by which actual sales exceed the break-even point.
Profit: The amount by which revenues exceed costs.
Target profit: The desired level of profit that a business wants to achieve.
Sales volume: The number of units of a product or service that are sold.
Sales mix: The proportion of different products or services that are sold in a given period.
Capacity utilization: The percentage of a business’s capacity that is being used to produce goods or services.
Cost-volume-profit (CVP) analysis: A method of analyzing the relationship between a business’s costs, volume, and profits.
Sensitivity analysis: A method of analyzing how changes in variables, such as price or costs, will affect the break-even point.
Cost drivers: Factors that cause costs to change, such as changes in the level of production or the price of raw materials.
Learning curve: The relationship between the amount of experience or practice and the resulting improvement in efficiency.
Designing Your Own Break-Even Analysis Template in Microsoft Excel
To create a break-even analysis in Excel, you will need to do the following:
- Identify the fixed costs of your business. Fixed costs are expenses that do not vary with changes in the volume of goods or services produced, such as rent or insurance.
- Identify the variable costs of your business. Variable costs are expenses that do vary with changes in the volume of goods or services produced, such as the cost of raw materials or labor.
- Determine the price at which you will sell each unit of your product or service.
- Calculate the break-even point in units by dividing the total fixed costs by the difference between the price per unit and the variable cost per unit.
- Calculate the break-even point in sales dollars by multiplying the break-even point in units by the price per unit.
- Create an Excel spreadsheet with the following columns: “Unit Sales,” “Total Fixed Costs,” “Total Variable Costs,” “Total Costs,” and “Net Income.”
- Enter the appropriate values in each row of the spreadsheet. The “Unit Sales” column should list the number of units sold at each price point. The “Total Fixed Costs” column should list the total fixed costs for each price point. The “Total Variable Costs” column should list the total variable costs for each price point. The “Total Costs” column should calculate the total costs by adding the total fixed costs and total variable costs. The “Net Income” column should calculate the net income by subtracting the total costs from the sales.
- Plot the data on a graph by selecting the “Unit Sales” and “Net Income” columns and inserting a scatter plot. The break-even point will be the point at which the line for net income intersects the horizontal axis (at $0 net income).
- Customize the appearance of the graph and add any additional details or analysis as desired.
FAQ’S
Here are some frequently asked questions and answers about break-even analysis:
How is the break-even point calculated?
The break-even point is calculated by dividing the total fixed costs of a business by the difference between the price per unit and the variable cost per unit.
How is break-even analysis used in decision-making?
Break-even analysis is a useful tool for financial planning and decision-making. It can help a business determine the minimum price at which it needs to sell its products or services in order to break even, and it can also help a business understand how changes in its costs or prices might affect its profitability.
Can break-even analysis be used to predict future profitability?
Break-even analysis can be used to predict future profitability to some extent, but it is important to keep in mind that it is based on a number of assumptions and estimates, and actual results may differ. Factors such as changes in demand, competition, and economic conditions can all impact a business’s profitability.
How do you structure a break even analysis?
To structure a break even analysis, create a spreadsheet tabulating: 1) Fixed costs like rent, salaries 2) Variable costs per unit like materials, payroll 3) Revenue per unit sold at given pricing 4) Formulas projecting total fixed costs plus total variable costs equaling total revenues identifying the break even volume.
How to do a break even analysis template?
A break even template structures fixed costs, variable costs per unit, selling price per unit and expected sales volume into a table. Formulas equate fixed costs plus units sold times variable costs per unit equaling revenue from units sold times unit selling price. Adjust volume sold until revenues equal costs to identify break even level.
How to do a simple break even analysis?
A simple break even analysis lists total fixed costs for the period. Estimate variable production and distribution costs per unit. Define intended selling price per unit. Guess volume estimates, compute revenue, subtract variable then fixed costs. When total revenue equals total costs, break even volume is determined.
How do you do a break even analysis in Excel?
In Excel, detail fixed costs in one column, variable cost per unit rates in the next, selling prices per unit in the third. In units columns, use a formula like =D9*(E9-F9)-G$8 with cell D9 increasing units sold until the break even revenue amount covers exact total fixed costs in G8.
What are the three components of break-even analysis?
The three key components of a break even analysis are:
- Total fixed costs
- Variable costs per unit
- Revenue performance per unit at a given price
Together, these elements help determine required sales volume to reach profitability.
What three things do you need in order to perform a break-even analysis?
The three essential inputs required to compute a break even analysis are:
- Total fixed costs
- Variable costs per unit
- Selling price per unit
With these three elements, the break even sales volume can be calculated to identify profitability potential.


![Free Printable Food Diary Templates [Word, Excel, PDF] 1 Food Diary](https://www.typecalendar.com/wp-content/uploads/2023/05/Food-Diary-1-150x150.jpg 150w, https://www.typecalendar.com/wp-content/uploads/2023/05/Food-Diary-1-1200x1200.jpg 1200w)
![Free Printable Credit Card Authorization Form Templates [PDF, Word, Excel] 2 Credit Card Authorization Form](https://www.typecalendar.com/wp-content/uploads/2023/06/Credit-Card-Authorization-Form-150x150.jpg)
![Free Printable Stock Ledger Templates [Excel,PDF, Word] 3 Stock Ledger](https://www.typecalendar.com/wp-content/uploads/2023/08/Stock-Ledger-150x150.jpg)
