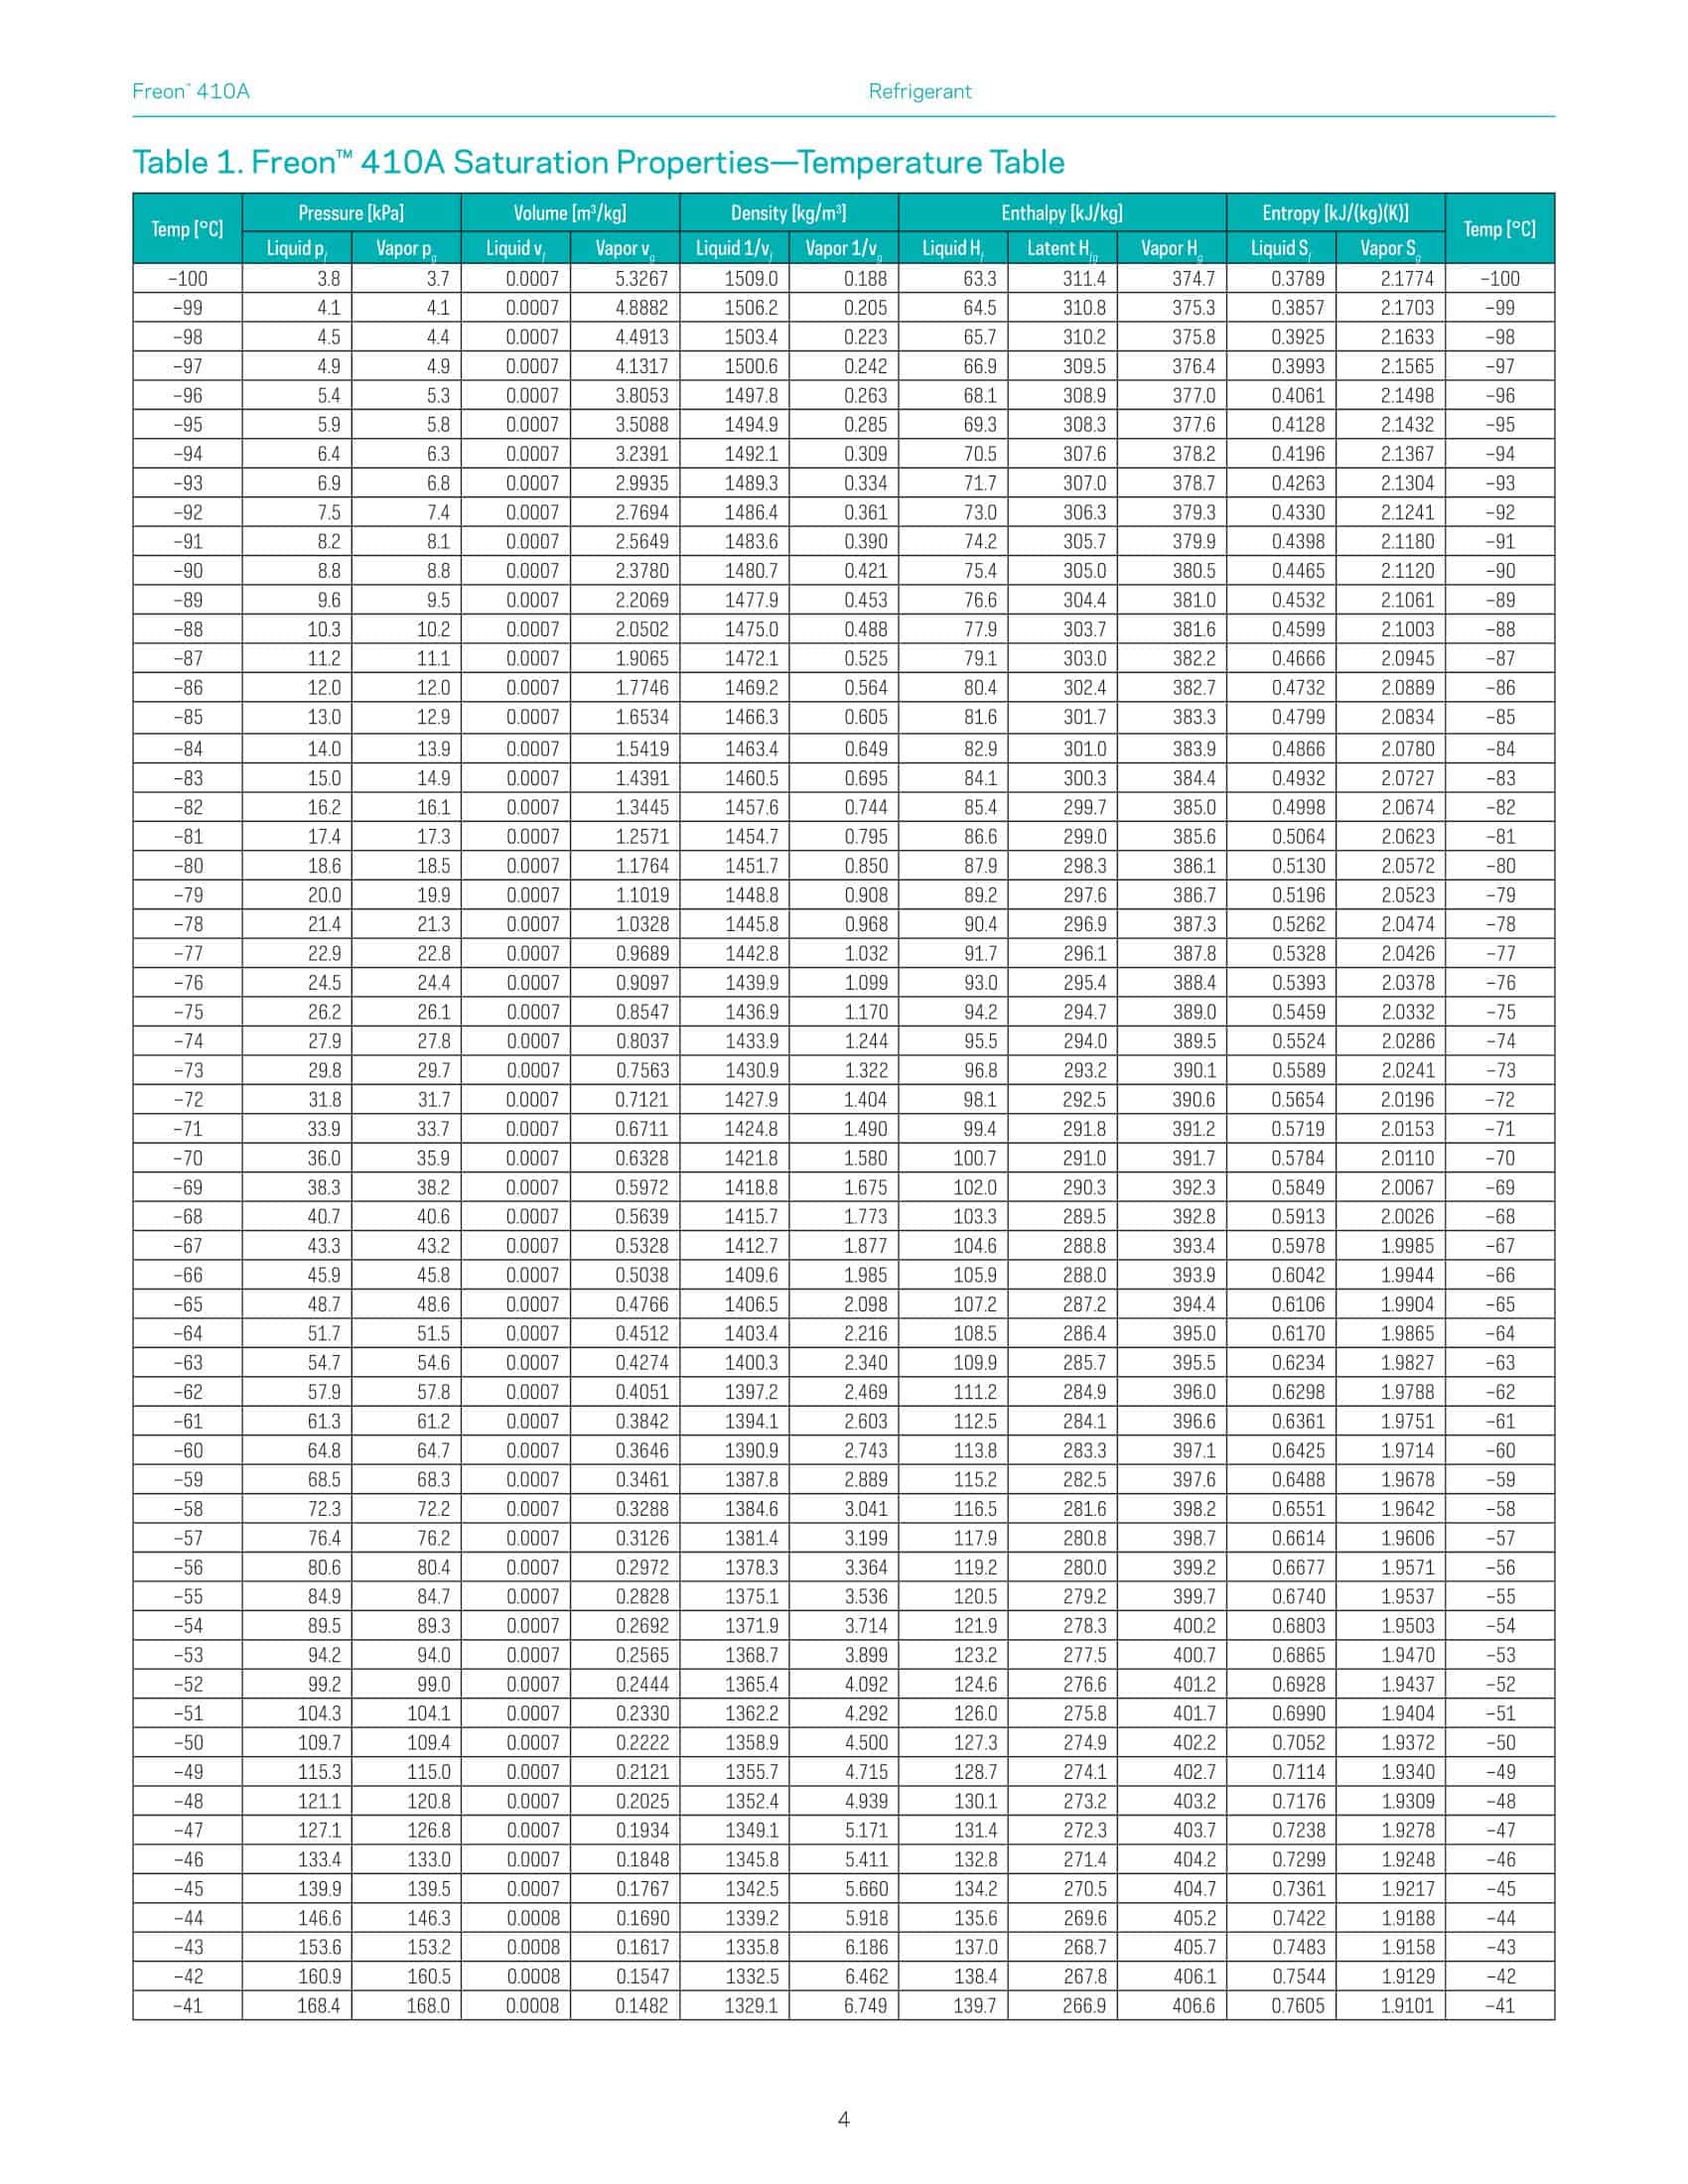
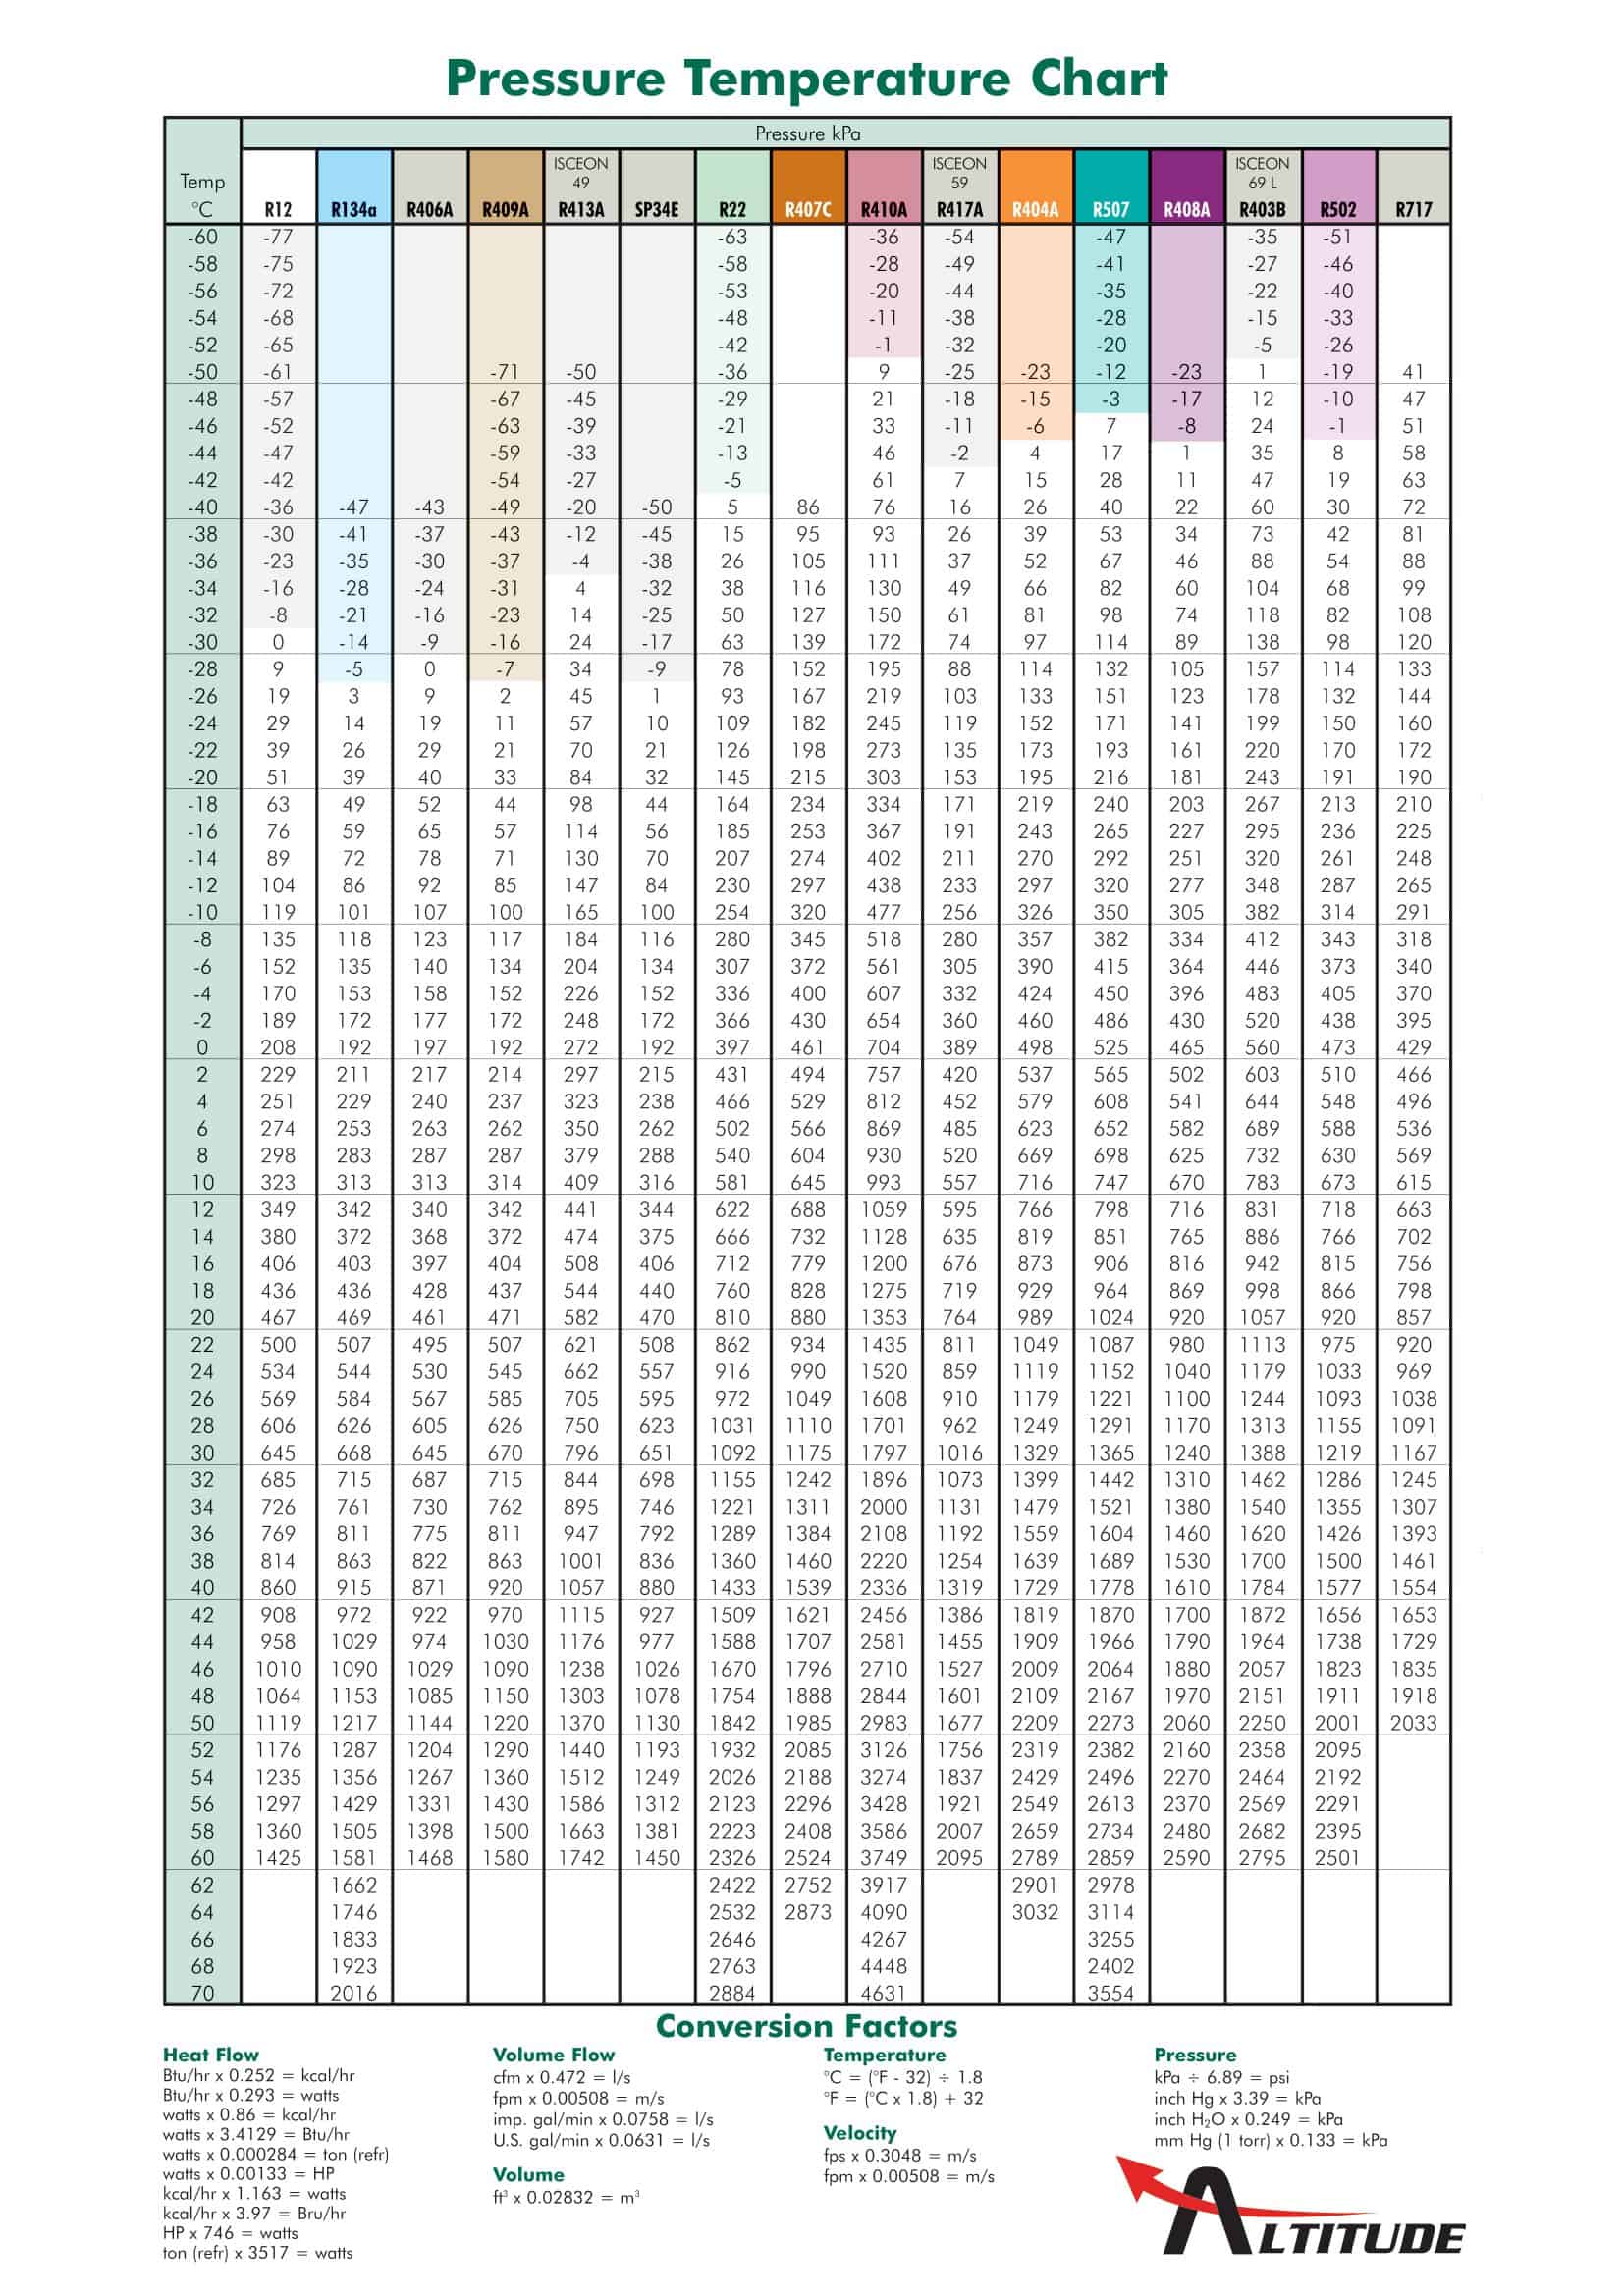
Accurate charging and diagnostics on R-410A split A/C and heat-pump systems depend on reading the pressure–temperature relationship correctly. What °F saturation temperature corresponds to the PSI value you see on the manometer, where the subcooling target should be during winter charging, whether the superheat value is outside the normal range, all of these questions become clear at a glance with an R-410A pressure-temperature chart.
![Free Printable R410A Pressure Temperature Chart [PDF] 1 R-410A PT Chart](https://www.typecalendar.com/wp-content/uploads/2023/08/410A-PT-Chart-1024x576.jpg 1024w, https://www.typecalendar.com/wp-content/uploads/2023/08/410A-PT-Chart-300x169.jpg 300w, https://www.typecalendar.com/wp-content/uploads/2023/08/410A-PT-Chart-768x432.jpg 768w, https://www.typecalendar.com/wp-content/uploads/2023/08/410A-PT-Chart-1536x864.jpg 1536w, https://www.typecalendar.com/wp-content/uploads/2023/08/410A-PT-Chart-1200x675.jpg 1200w, https://www.typecalendar.com/wp-content/uploads/2023/08/410A-PT-Chart.jpg 1920w)
Table of Contents
35+ High-Resolution R-410A PT Charts
TypeCalendar has prepared more than 35 R-410A PT Charts, taking into account the different working styles in the field, and made them all available for download as separate files. The °F–PSI system, which is widely used in the US, is given priority; for international teams, the °C–kPa equivalents are also provided.
Options from pocket-carried laminated small cards to poster sizes hung on the workshop wall, from boards that automatically calculate according to the value entered in digital to high-contrast variants that can be read even by lantern light at night service, provide the same level of accuracy regardless of your workflow. Download the single file, use it according to your application; no need to download unnecessary packages.
Formats: PDF, Excel/Sheets, & Vector Files
Printed 300 dpi PDF files for field use-ready to laminate; margins are set for hole punch and folder compatibility. For those who want to see superheat and subcooling targets automatically, Excel/Google Sheets templates calculate live saturation temperature and target differences based on PSI/°F or kPa/°C input; conditional formatting instantly highlights critical limits. Layered SVG/AI files are available for services that want to match the corporate colors or add the company logo, ensuring that the lines remain razor sharp even on large poster prints thanks to the vector structure.
Practical Use in Charging, Diagnostics and Maintenance
Reading the saturation temperature from the table and comparing it with the subcooling target when charging refrigerant; to the cooling circuit allows you to catch over or under charging in seconds. When you measure the suction line temperature and compare it with the superheat and PT values, you immediately get an idea about the behavior of the expansion device, evaporator load and air flow. In heat pump service in winter mode, using “cold weather” focused graphics for realistic expectations at low ambient temperatures will prevent you from falling into a false alarm during frost–defrost cycles. In short, the correct R-410A PT chart converts pressure to text and temperature to decision.
Quick Setup and Daily Flow
Choose the layout you need, download the file, then print for your field binder or save to your mobile device. Hang the poster in the shop, stash the pocket card in the manifold case, and share the Excel version with apprentices so field PSI readings convert instantly to °F/°C and target SH/SC deltas. TypeCalendar’s individually downloadable R-410A set gives every HVAC tech a consistent, fast, repeatable reference bringing clarity to your workflow and stability to your customers.


![22 Free Printable VPD Chart [PDF] 2 VPD Chart](https://www.typecalendar.com/wp-content/uploads/2023/09/VPD-Chart-150x150.jpg)
![Free Printable Roof Pitch Chart [PDF] 3 Roof Pitch Chart](https://www.typecalendar.com/wp-content/uploads/2023/08/Roof-Pitch-Chart-150x150.jpg)

