Skip to content

Free Printable Place Value Chart Templates [PDF] Decimal, Millions, Billions – Money

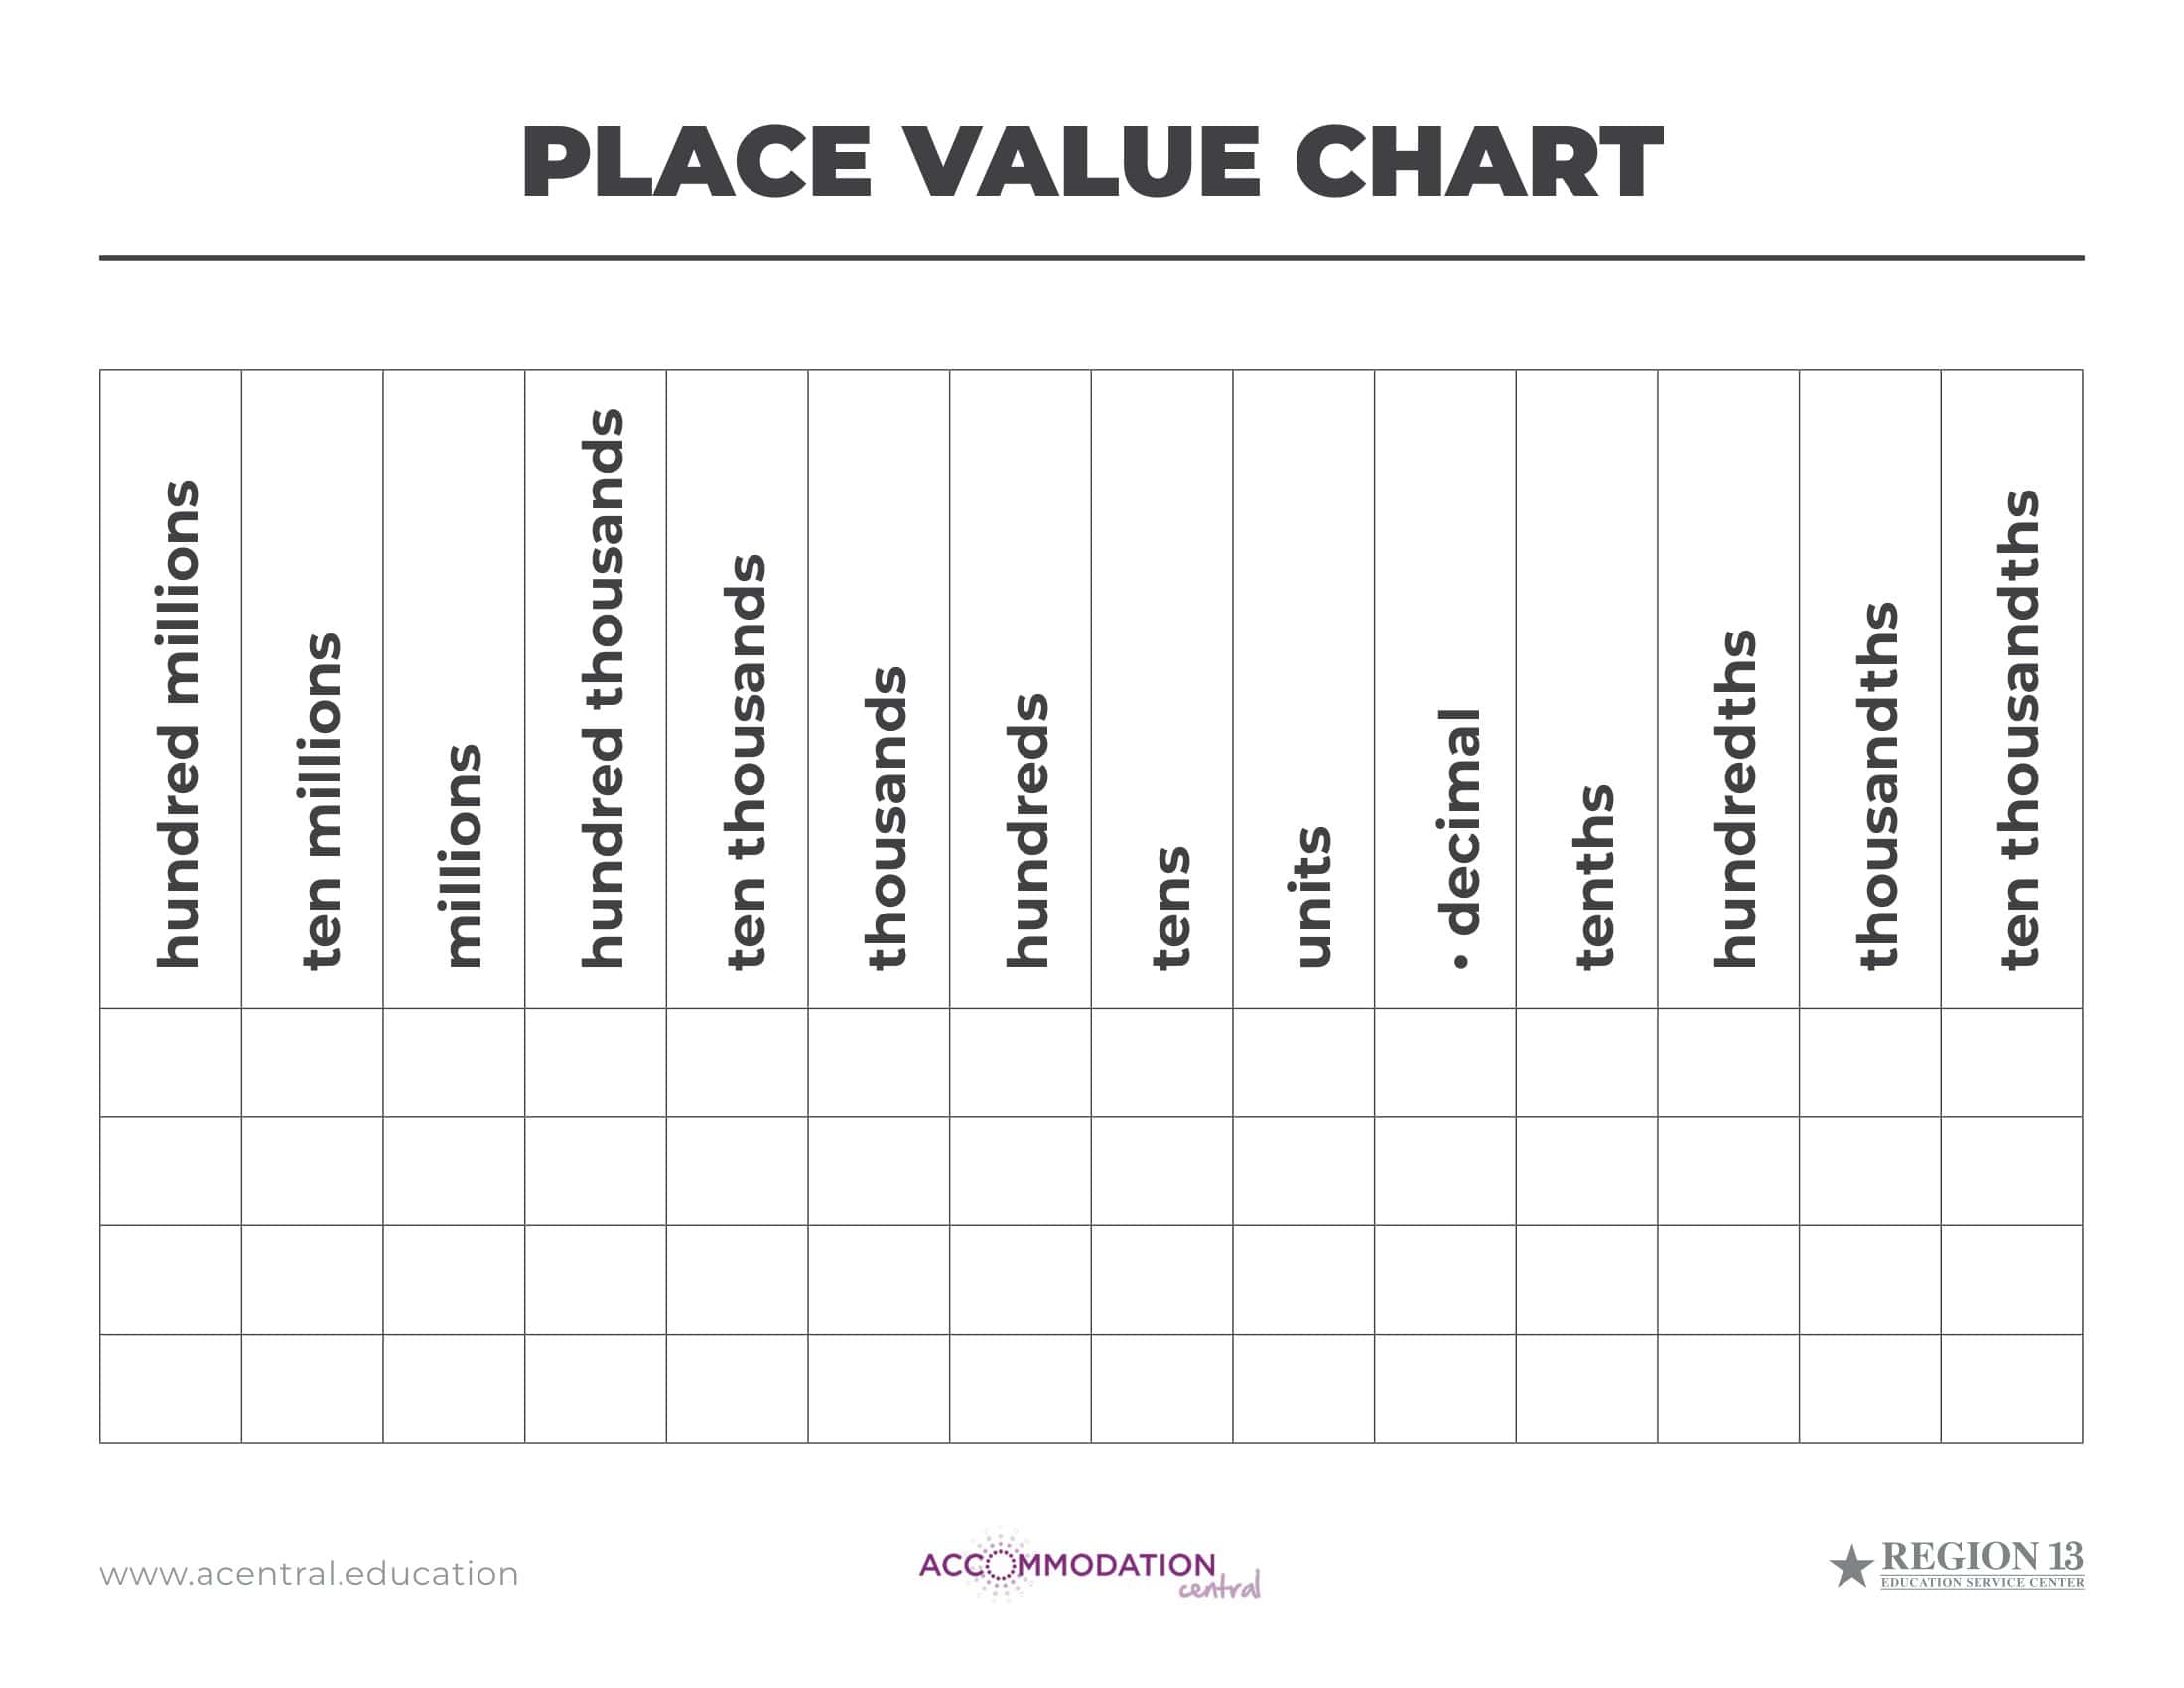
    Understanding place value is a fundamental math skill that provides the basis for students to perform multi-digit operations. Place value charts are an invaluable hands-on tool for reinforcing this essential concept. These grids visually represent the place value positions of ones, tens, hundreds, and beyond to concretely model the relationship between digits in a number. In this article, we provide free printable blank place value chart templates in PDF, Word, and Excel formats.

    Educators can utilize these customizable charts for whole class instruction and give students their own copies for interactive learning. The blank charts allow learners to fill in the digit places and clearly see how digits shift places from right to left. With these free printable resources, teachers, parents, and students have access to an effective manipulative for developing strong place value comprehension. Mastering place value is the gateway to multi-digit arithmetic, decimals, rounding, and more.

    Pritnable Place Value Charts

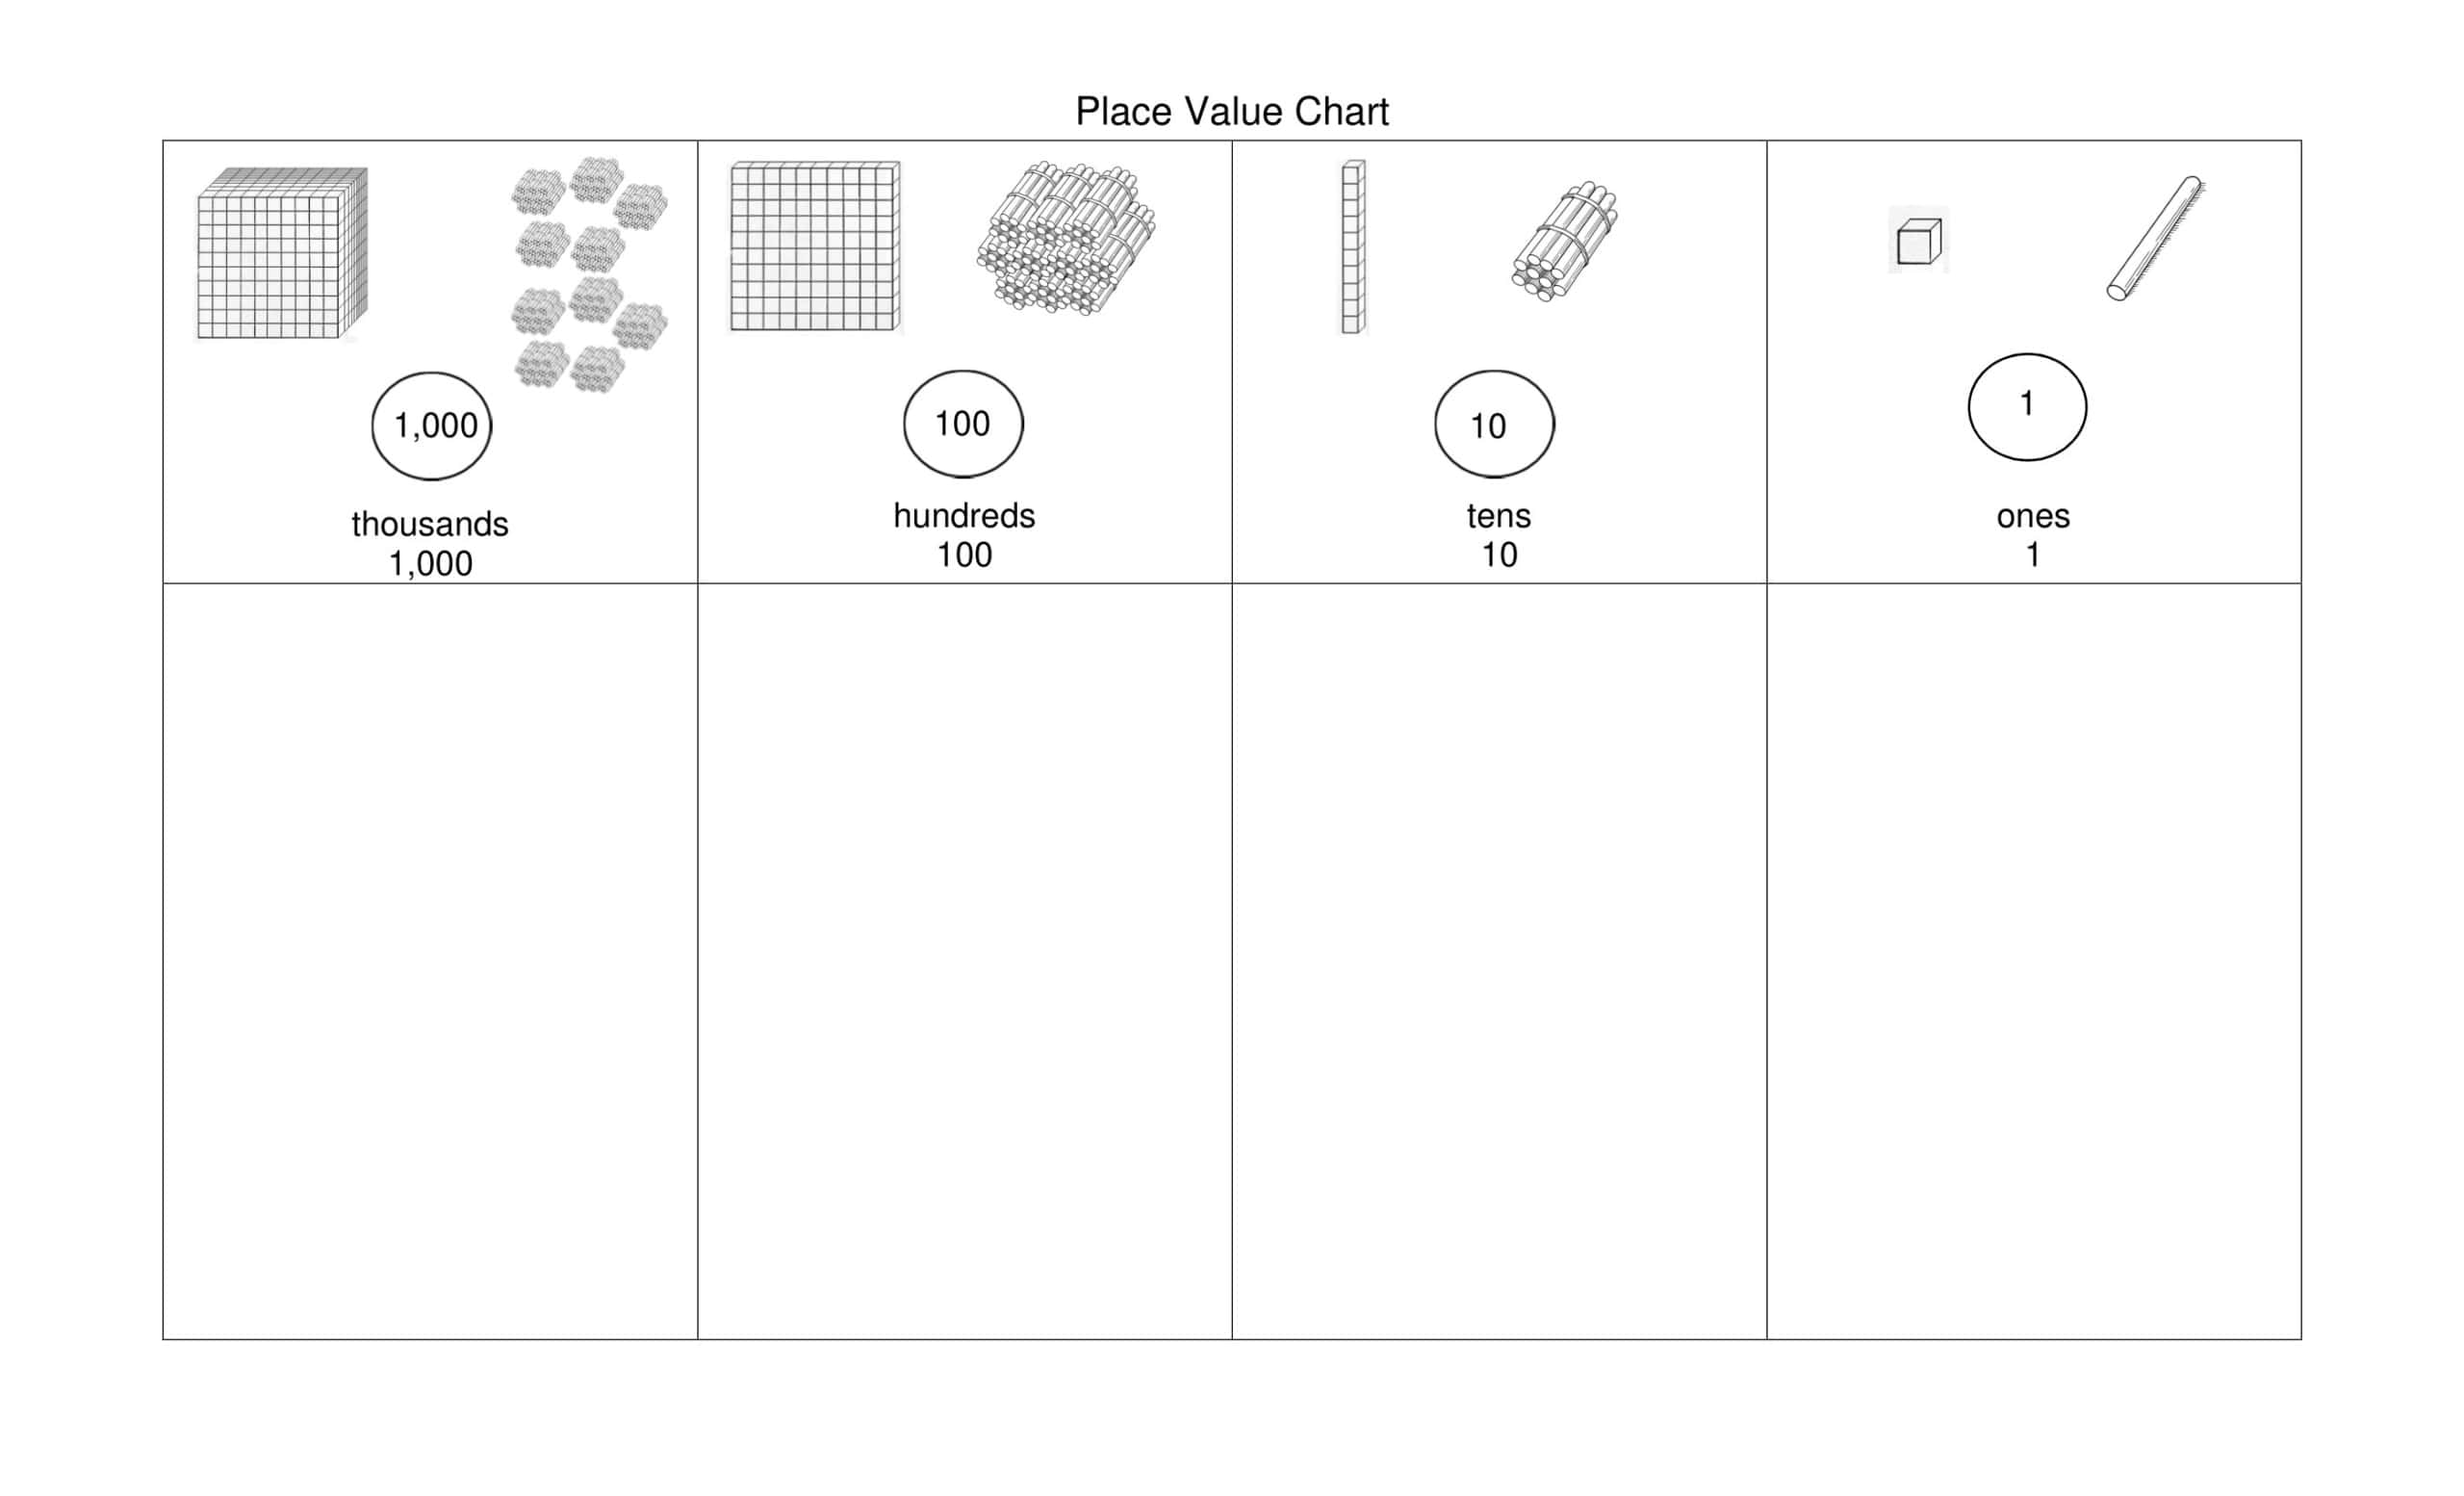
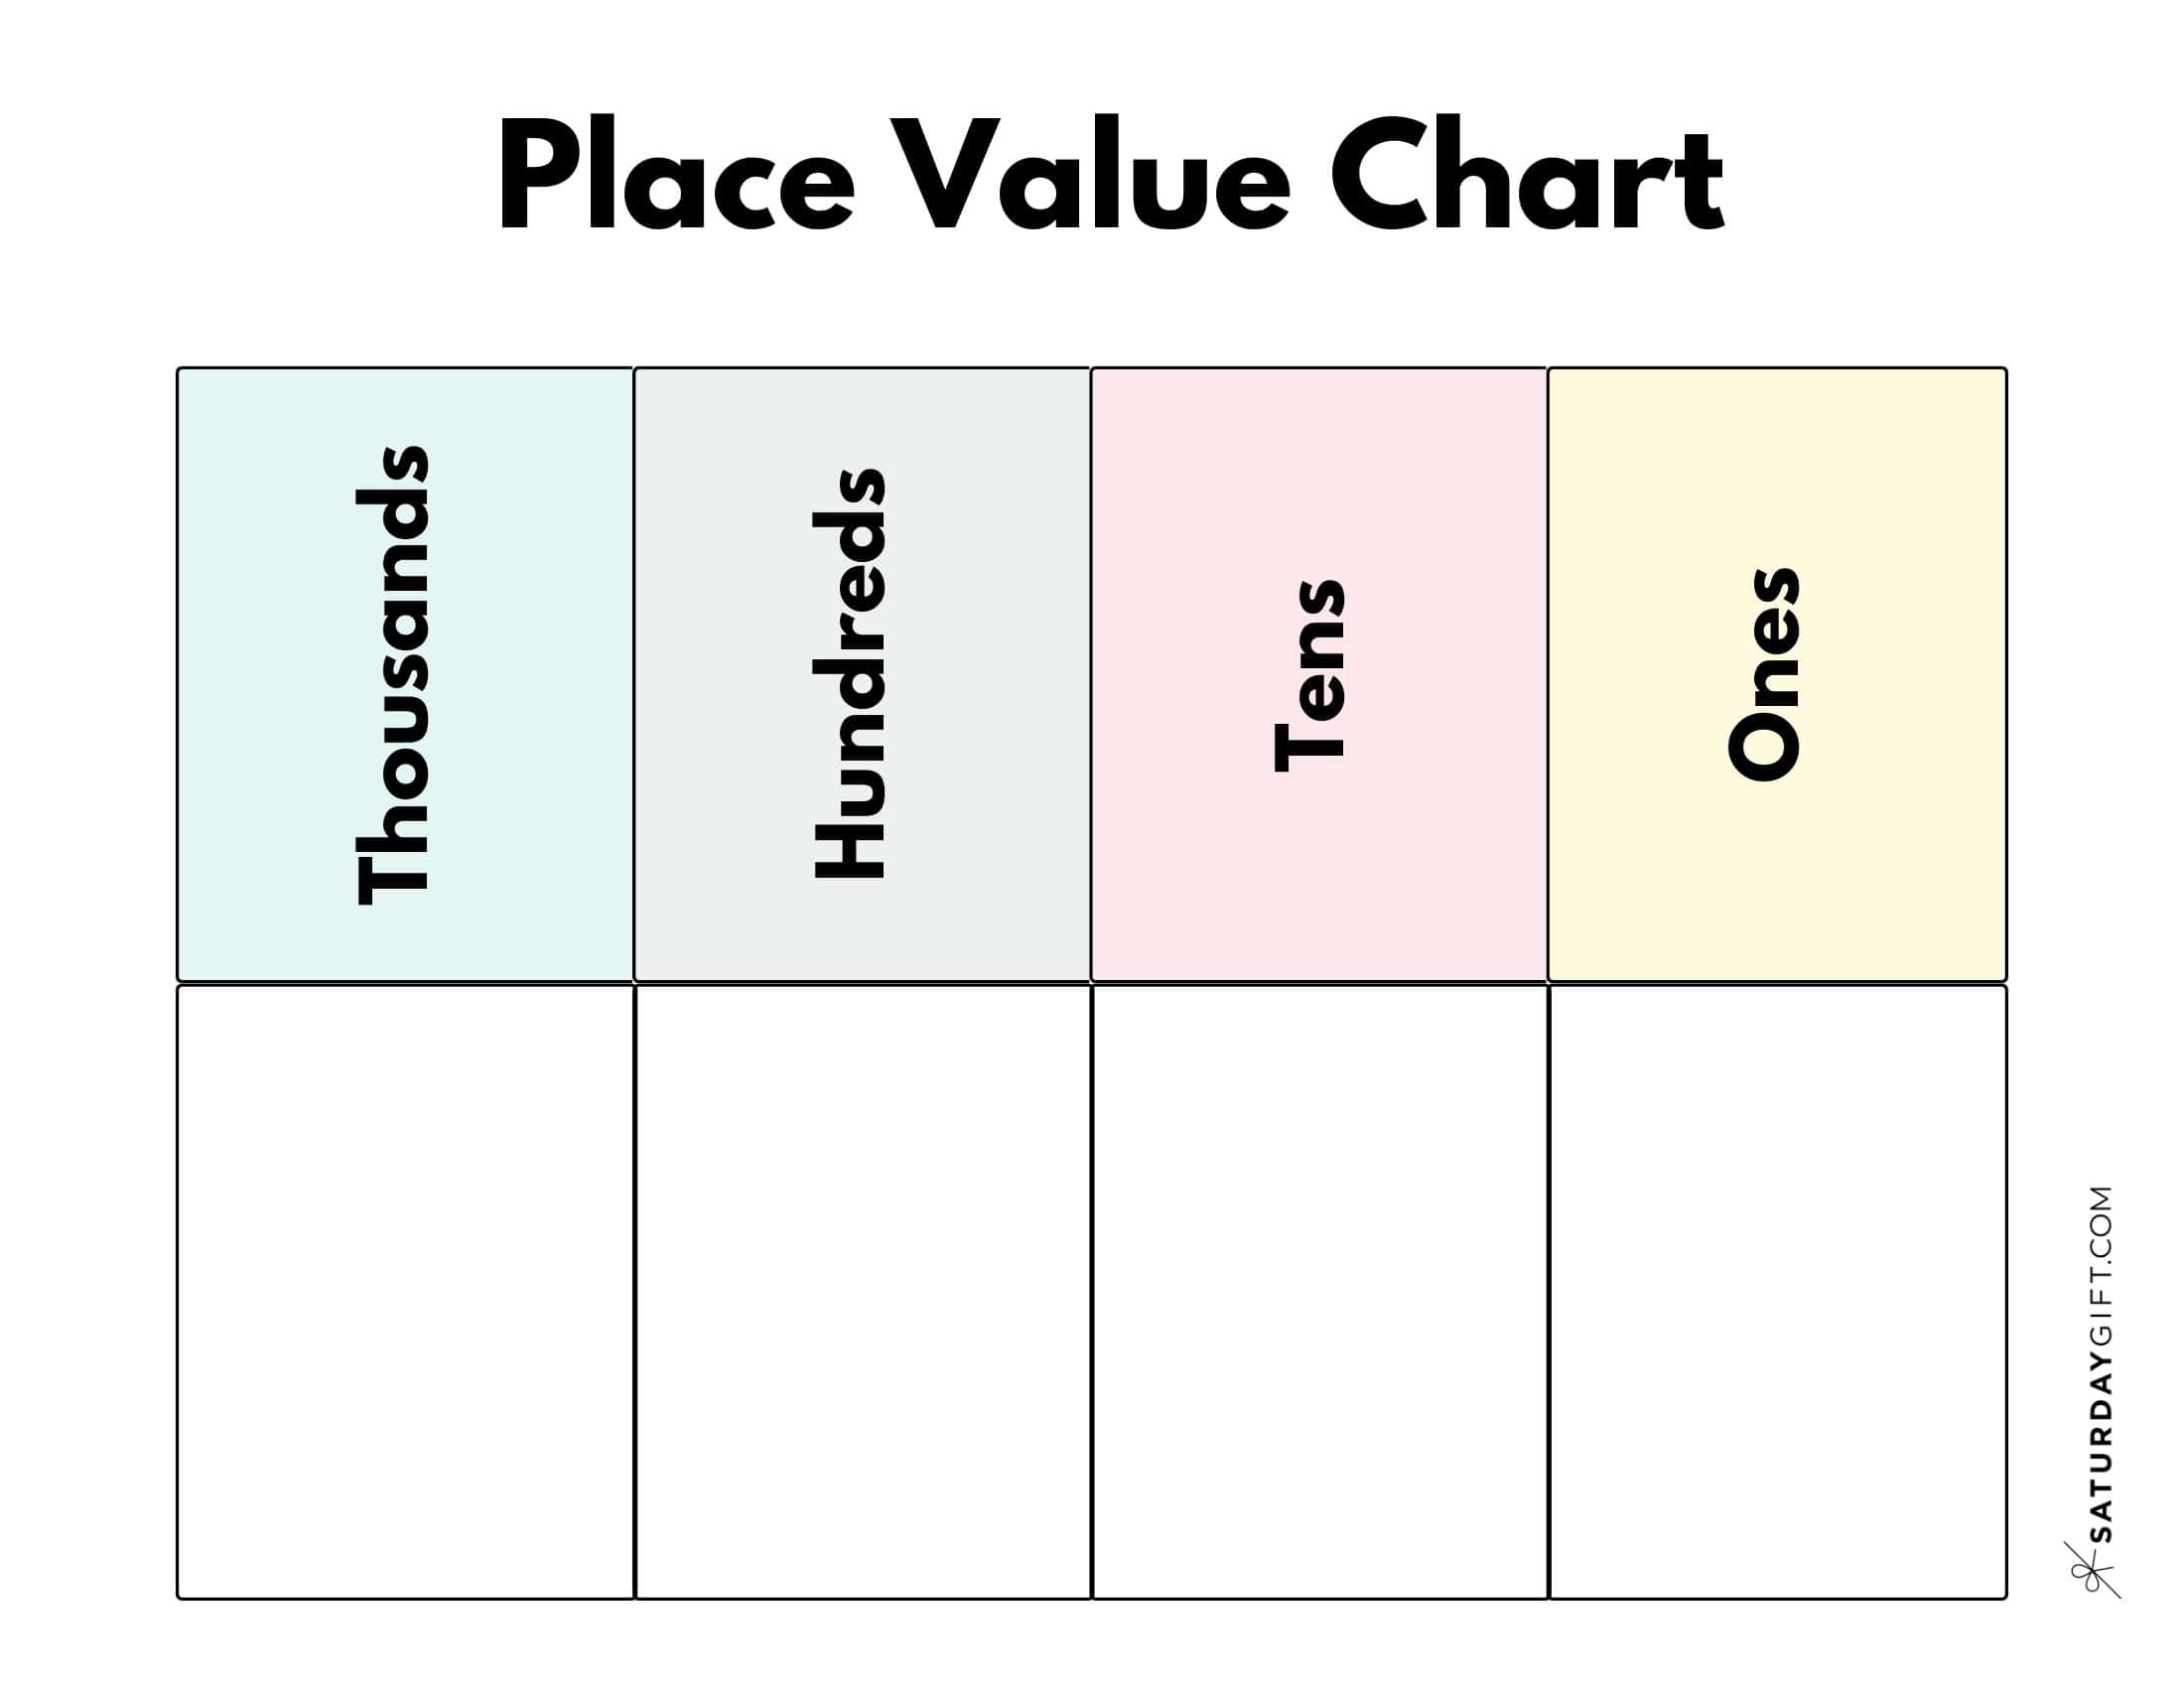
    A place value chart is a math tool used to help students understand the value of digits in numbers. It is usually presented as a large rectangle divided into columns with place value headings like Ones, Tens, Hundreds, Thousands. The columns reinforce the idea that each place to the left is a higher value. Teachers often present place value charts as printable pdf worksheets. These pdfs show example numbers broken down by place value. For instance, the number 4,352 would be represented with a 2 in the Ones column, a 5 in the Tens, 3 in the Hundreds, and 4 in the Thousands.

    Place value charts help make the base ten system more concrete for early math learners first grasping number concepts. The visual layout and place value headings simplify big numbers into their component parts. Students can use place value charts when learning to round numbers, compare digit values, and do mental math. Many math curriculums in the elementary grades utilize place value chart pdfs to build number sense skills. These printable pdfs provide opportunities for students to decompose and compose numbers by place. Mastering place value concepts through repeated practice exercises prepares students for higher level math down the road.

    Place value charts are an essential math resource for elementary school teachers. They present complex number ideas in a simple visual format. Breaking down multi-digit numbers into columns gives students a deeper understanding of our base ten number system. Printable place value chart pdf worksheets allow teachers to give students valuable hands-on practice manipulating numbers by place. These pdfs enrich math lessons on counting, comparing, ordering, rounding numbers.

    Place value mastery is foundational for more advanced math skills. Regular practice with place value chart pdfs ensures students have the number sense needed to take on fractions, decimals, algebra and more. Place value charts make math more concrete for young learners struggling with new number concepts. The visual layout and step-by-step breakdowns promote understanding. Place value chart pdfs are a staple of early elementary math curriculums because they work!

    What is Place Value?

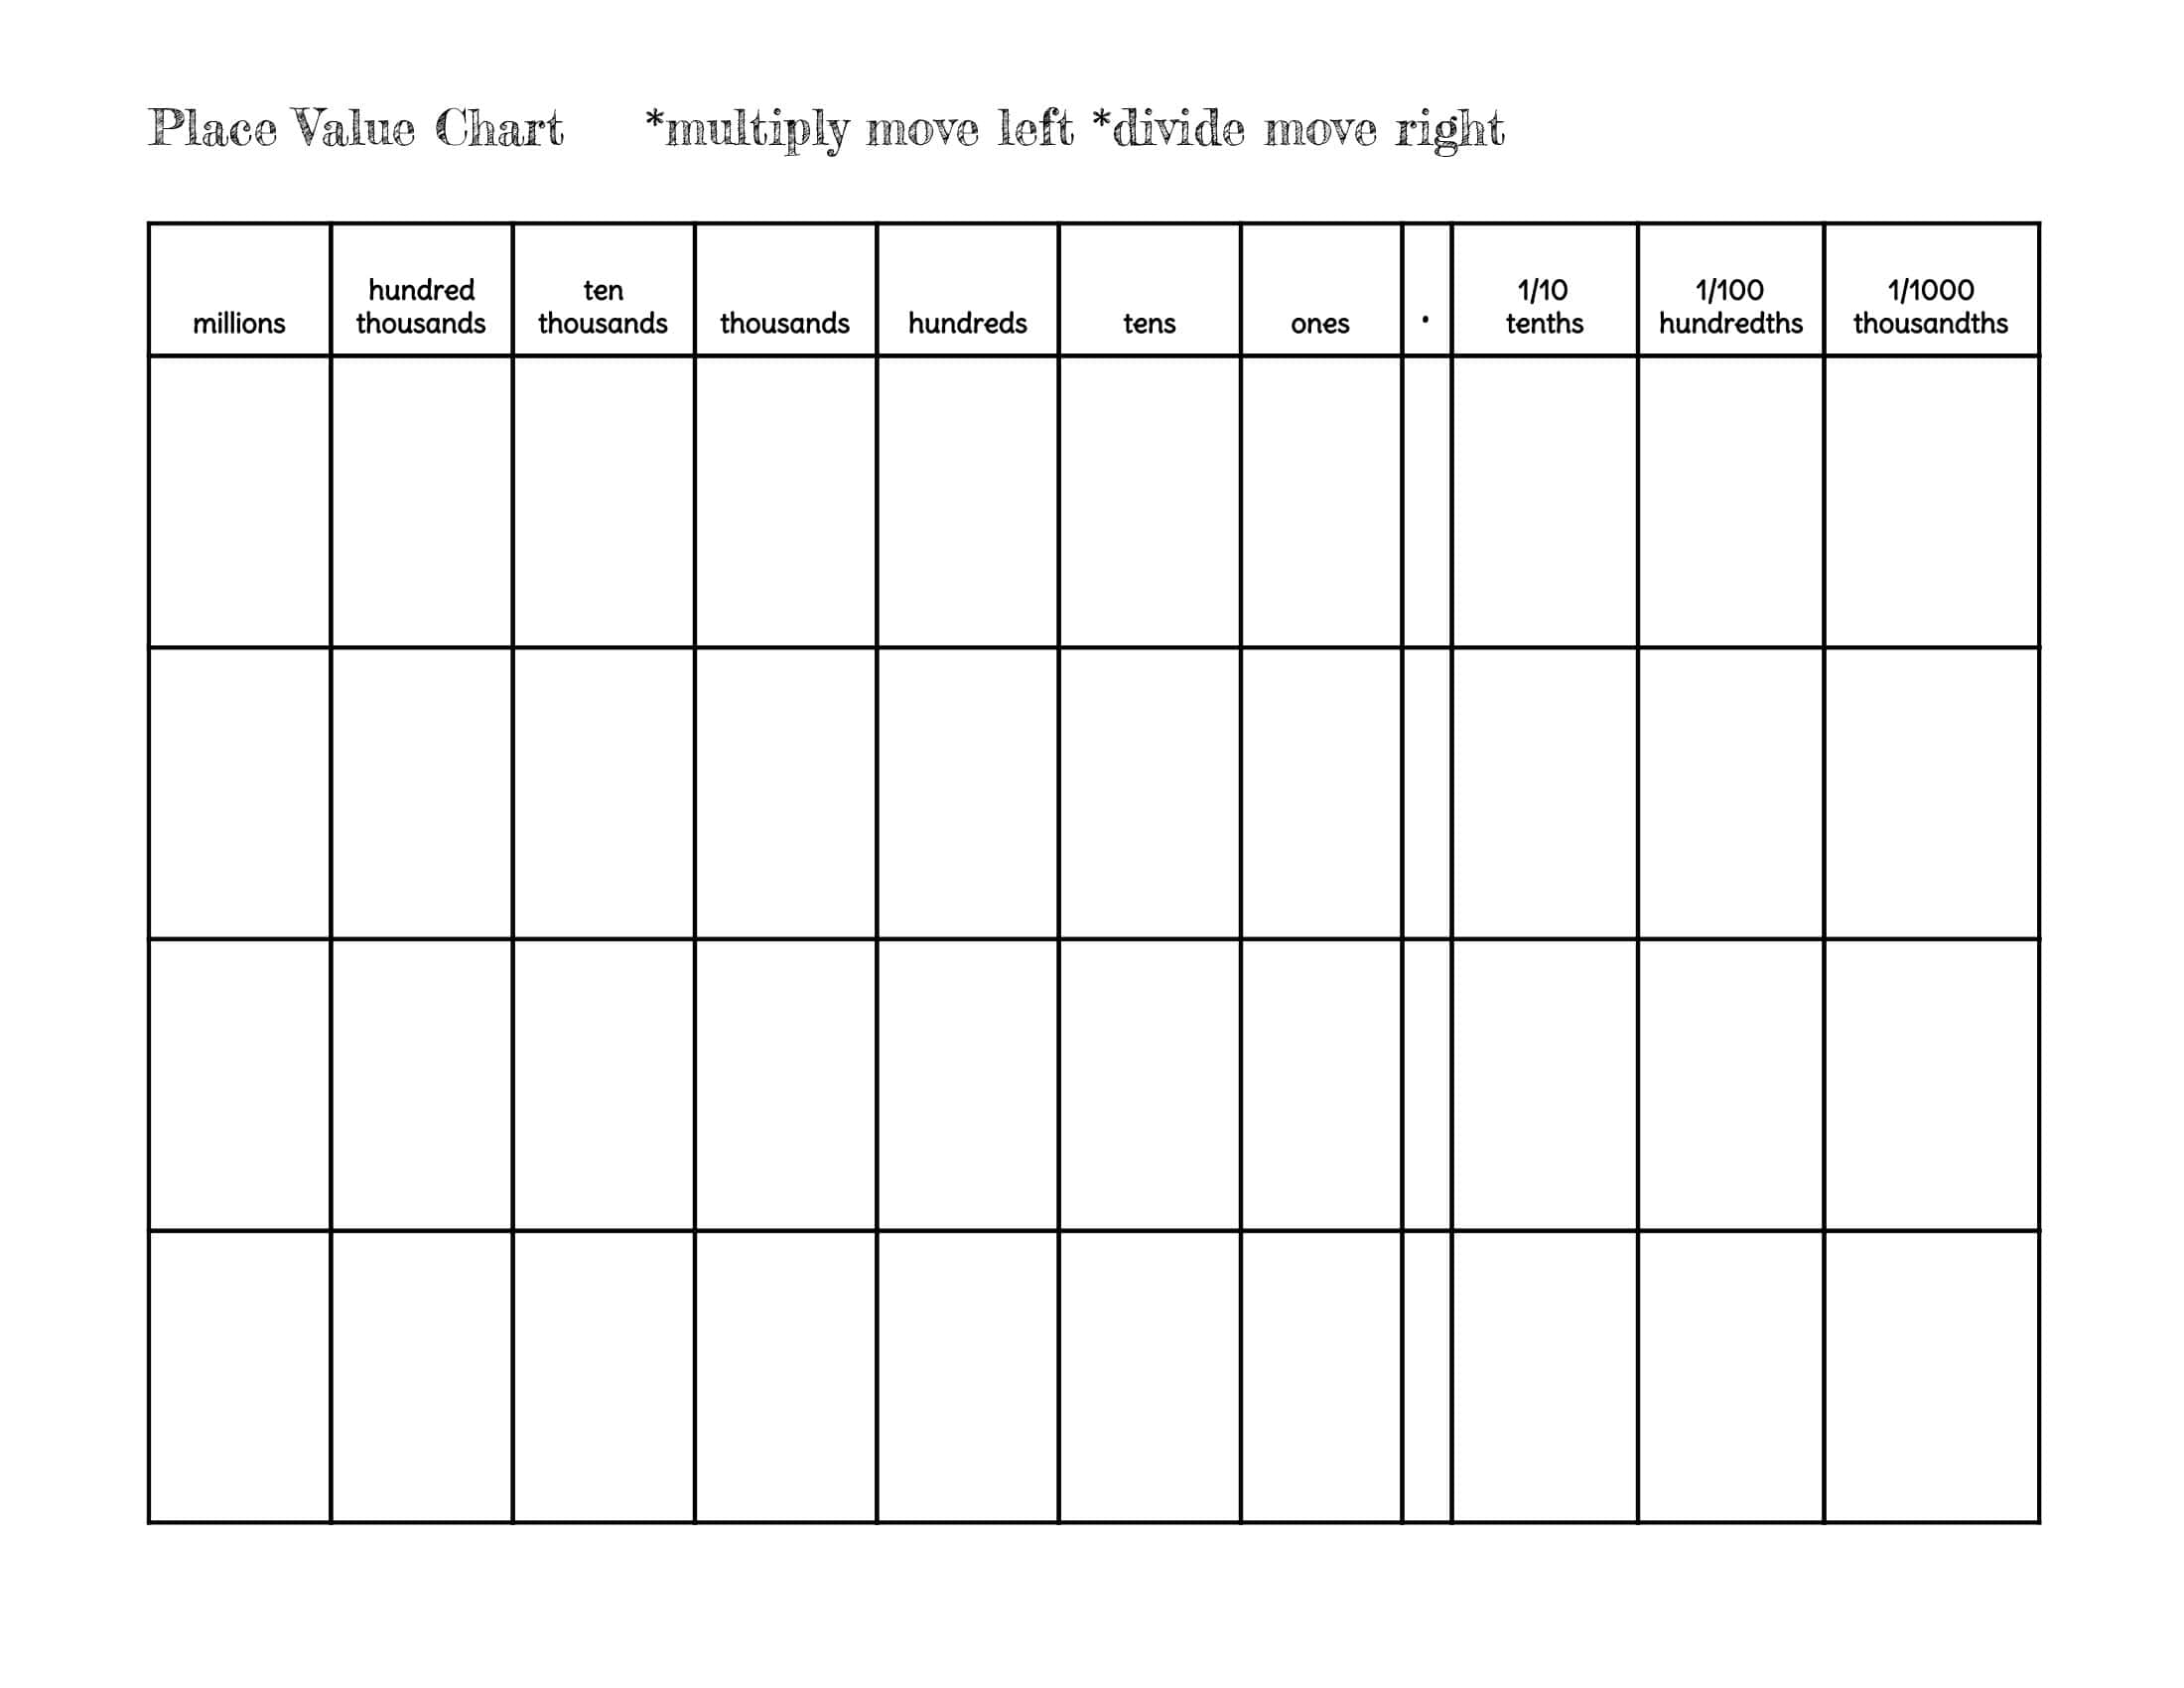
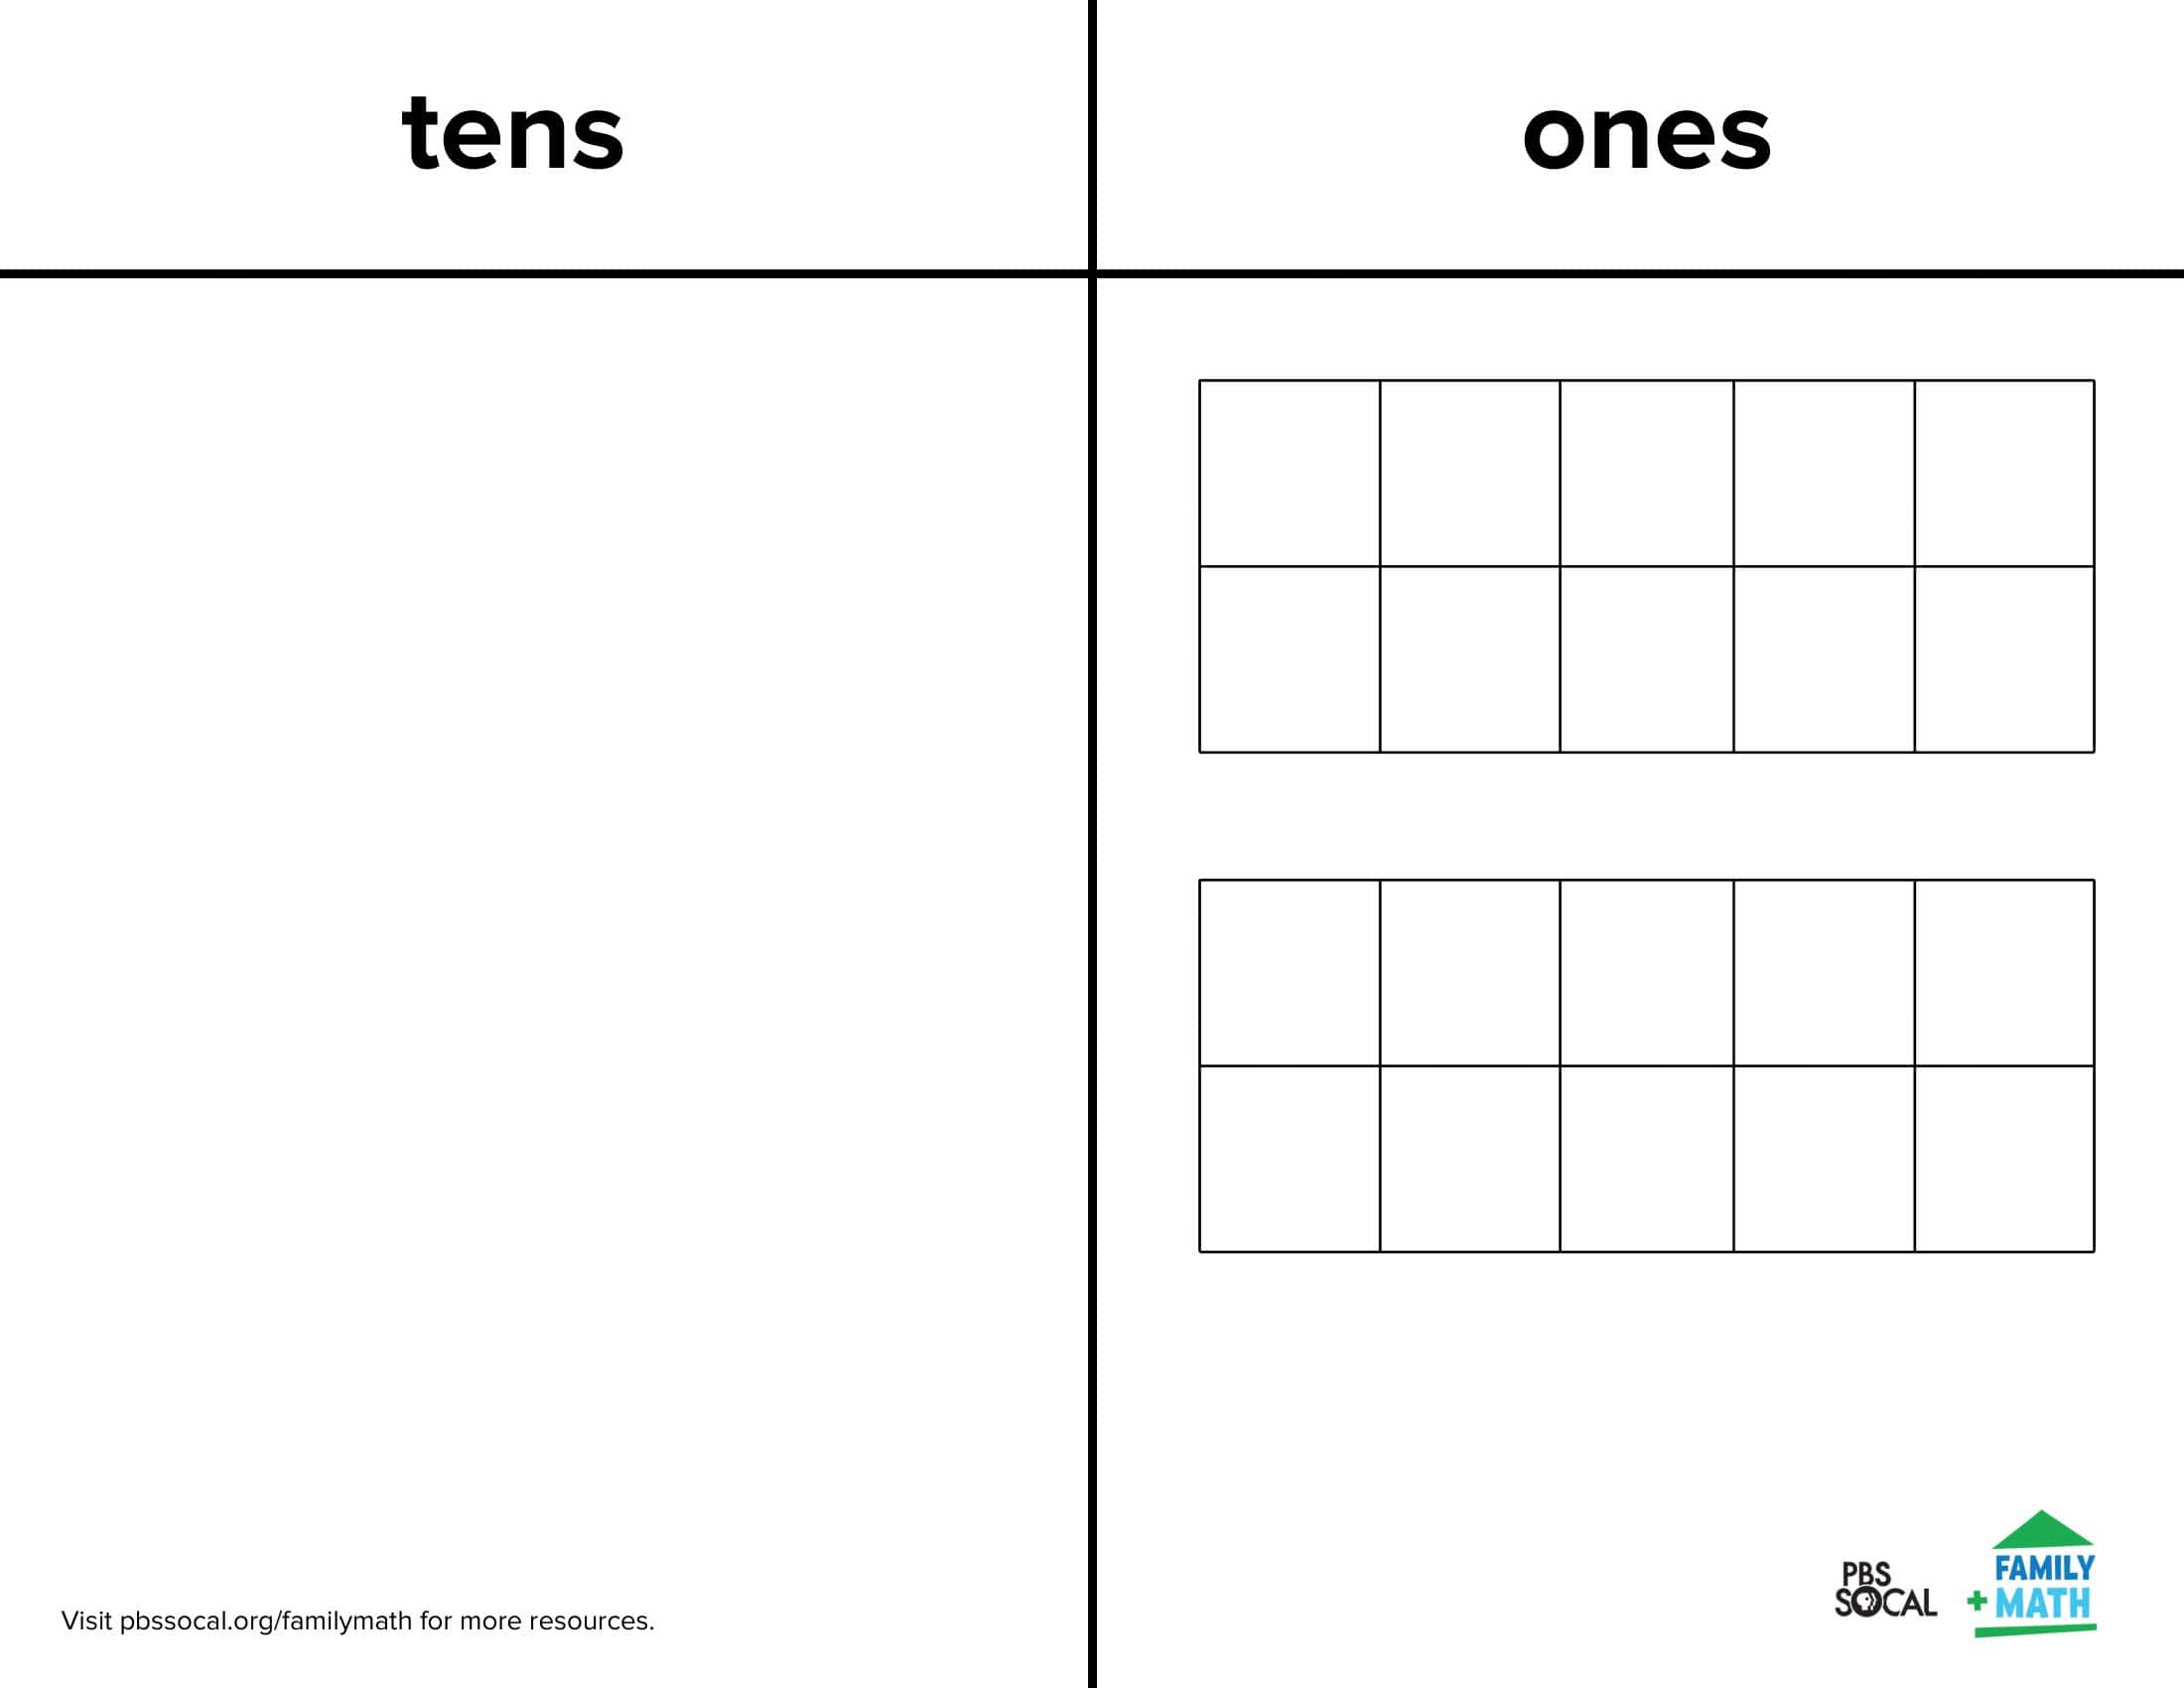
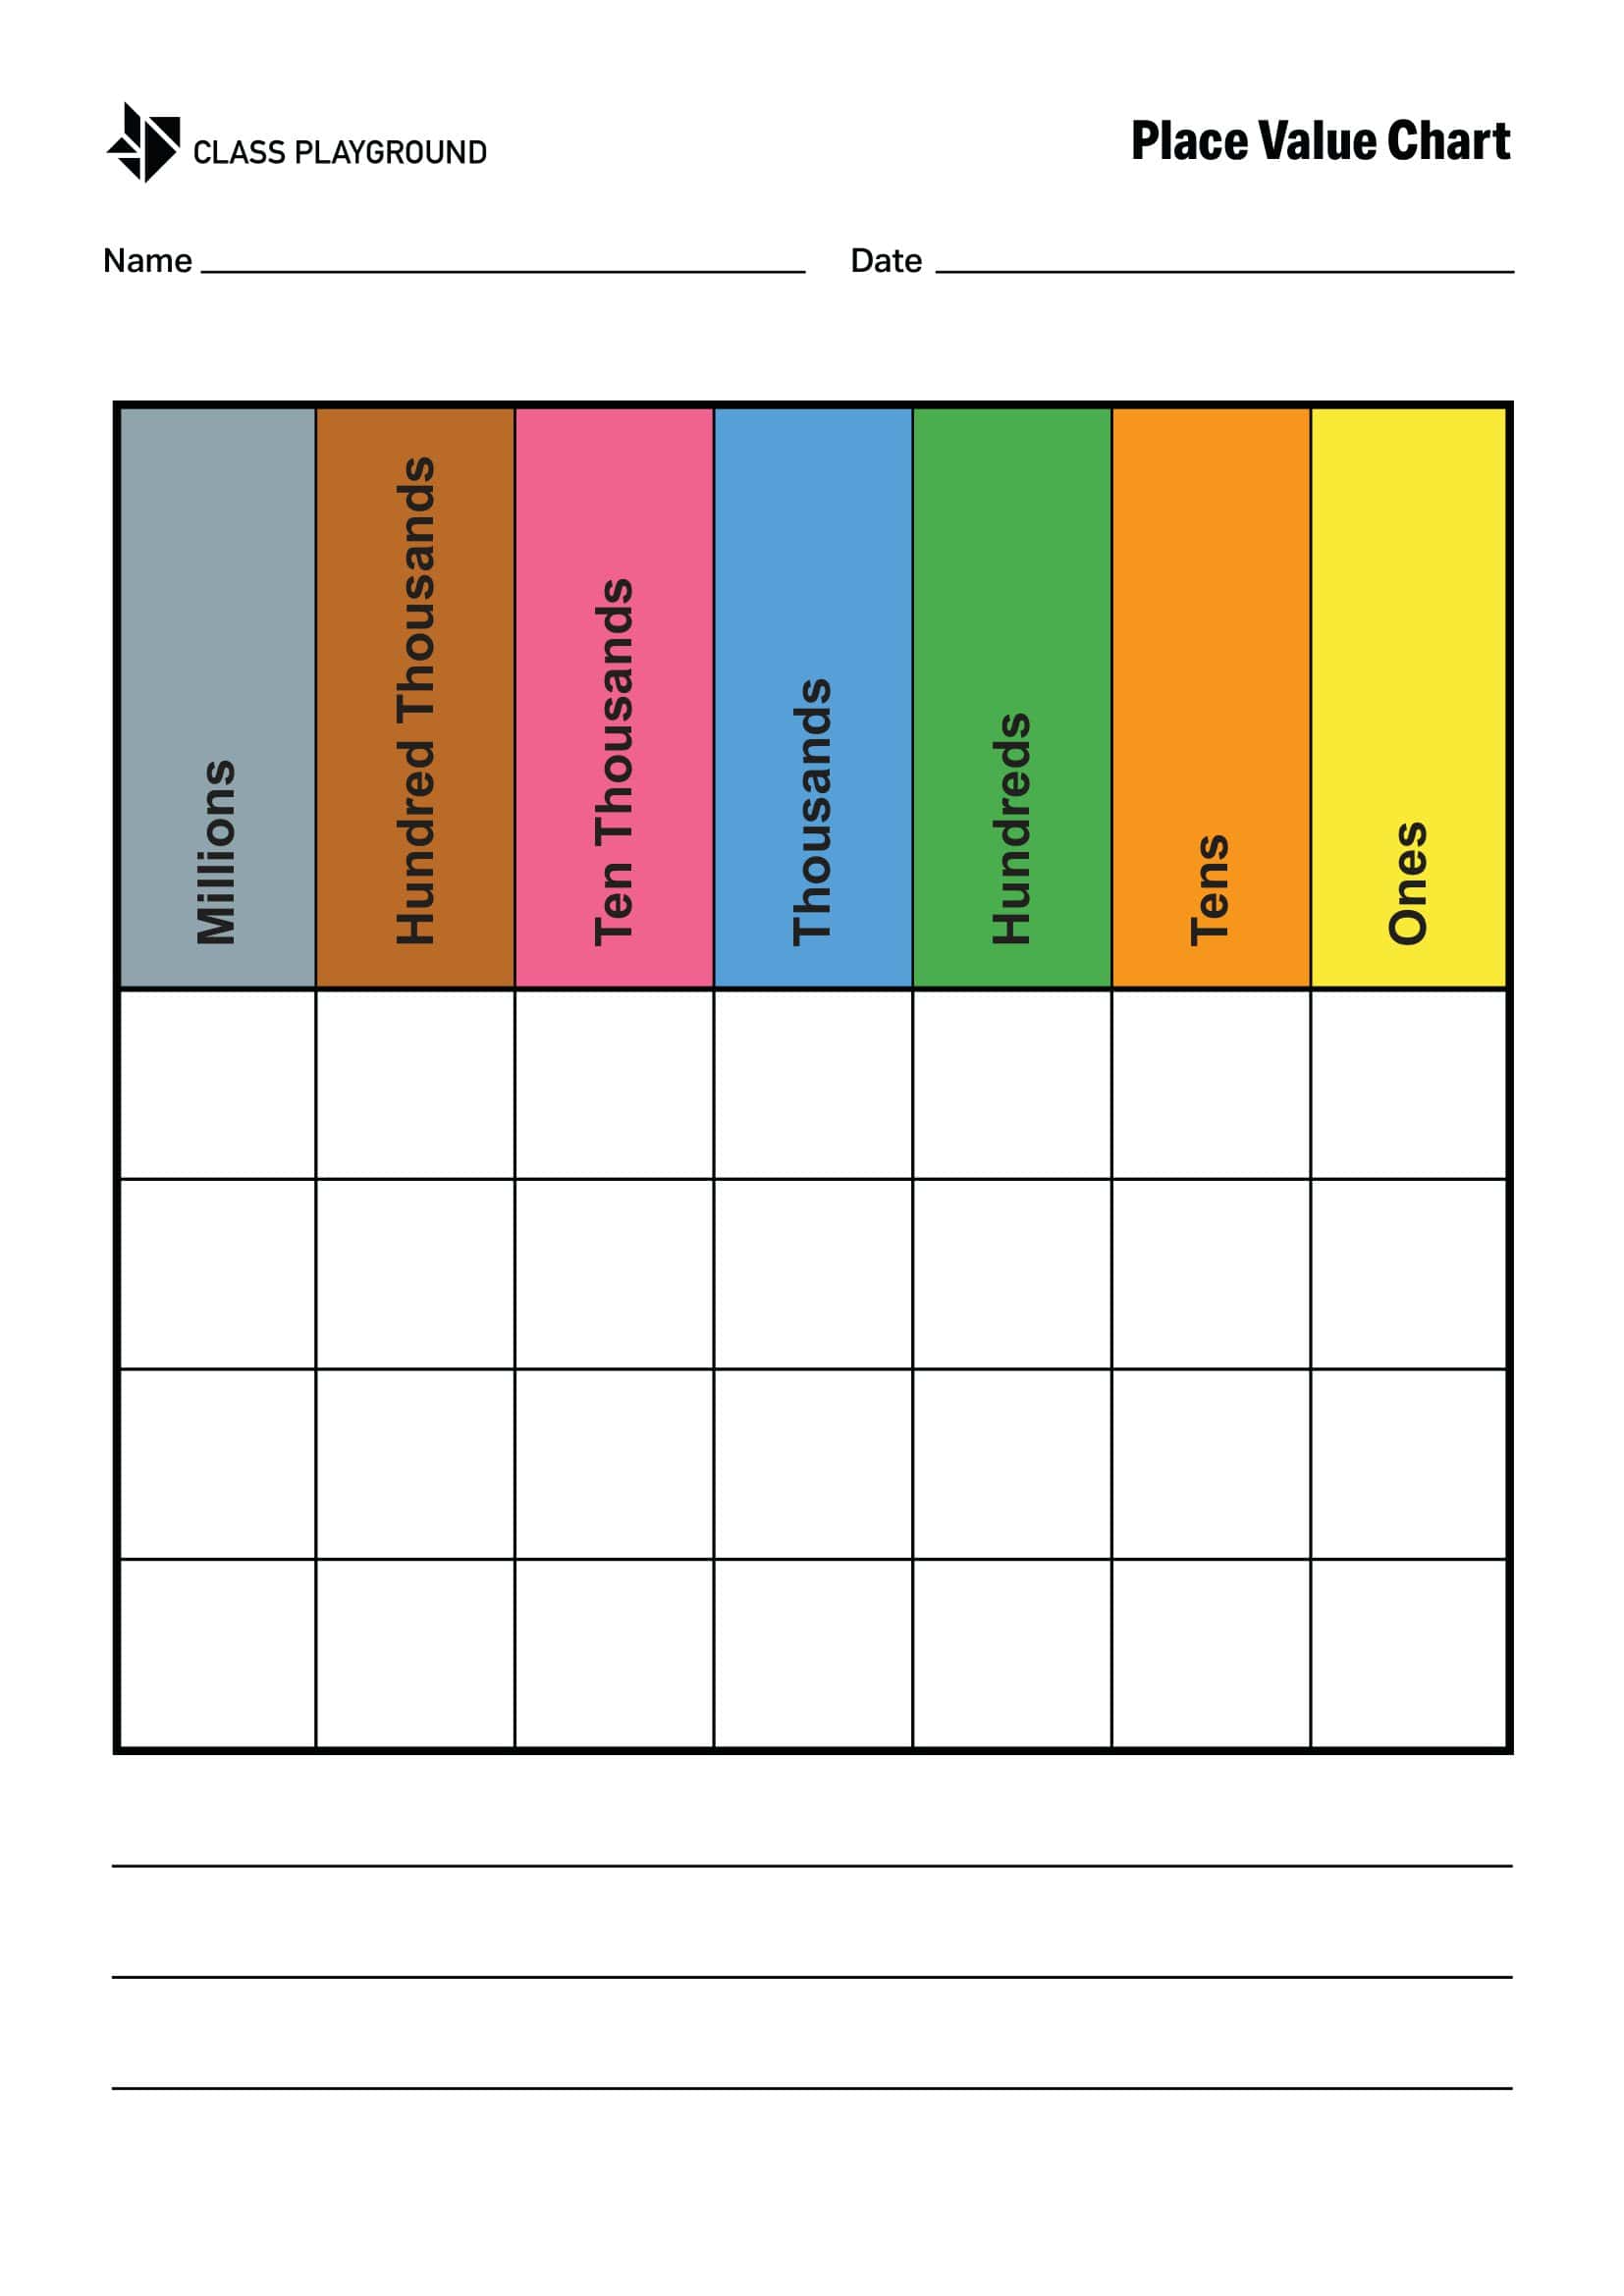
    Place Value Chart
    Place Value Chart

    Place value refers to the value of a digit in a number based on its position relative to the decimal point. In our decimal number system, each place to the left of the ones column represents a higher order of magnitude – tens, hundreds, thousands etc. For example, in the number 423, the digit 4 is in the hundreds place, the 2 is in the tens place, and the 3 is in the ones place.

    The 4 represents 4 hundreds or 400. The place value increases by factors of 10 moving left of the decimal. Understanding place value allows us to perform operations, comparisons, rounding, and other skills using multi-digit numbers. It is a foundational math concept that underpins computation.

    What is a Place Value Chart?

    A place value chart is a visual representation used to illustrate the place value positions of digits in a multi-digit number. It consists of columns labeled with place values increasing in magnitude from right to left, usually ones, tens, hundreds, thousands, and so on. The columns represent groupings based on powers of ten. Each digit of a number is written in the corresponding column based on its place value.

    For example, in the number 5,432, the 5 would be written in the thousands column, the 4 would go in the hundreds column, the 3 would be placed in the tens column, and the 2 would go in the ones column. This allows students to clearly see the relationship between a digit’s position and its value. Place value charts turn an abstract concept into a concrete model that reinforces the foundation for mathematical understanding and operations.

    Benefits Of Using Place Value Charts

    Manipulating this hands-on tool boosts studentsโ€™ comprehension in multiple ways. Place value charts provide a concrete visualization of the relationship between digit positions and their values. They allow learners to actively practice building numbers by place values. Charts also reinforce patterns and sequencing in the place value system.

    Additionally, they support differentiated instruction based on students’ needs. With so many advantages, place value charts are an invaluable resource for math learning. In this article, we will explore the numerous benefits that come with incorporating place value charts into lessons and activities.Place value charts offer many key benefits for cementing this essential math concept:

    Understanding of Numerical Concepts

    Place Value Charts play an instrumental role in developing a robust understanding of numerical concepts from an early age. They provide a clear, visual representation of how the value of digits varies depending on their position within a number. Through this representation, learners can comprehend the fundamental principle of the base-10 number system, which is essential for performing arithmetic operations and understanding more advanced mathematical concepts.

    Simplifying Complex Numbers

    Large and complex numbers can often be intimidating, especially to young learners. Place Value Charts break down these numbers into manageable units, making them significantly easier to read and understand. By dissecting numbers into units, tens, hundreds, thousands, and so on, learners can gradually build their familiarity and comfort with numbers of any magnitude. The categorization fosters a simplified approach to grasping large numbers and decimals.

    Enhancing Arithmetic Skills

    Arithmetic operations such as addition, subtraction, multiplication, and division become considerably easier with a solid understanding of place value. Place Value Charts serve as a practical tool for carrying out these operations systematically. For instance, when adding or subtracting large numbers, learners can tackle one place value column at a time, reducing the likelihood of errors and promoting a structured approach to arithmetic.

    Facilitating Decimal Understanding

    Decimals, being a core concept in many areas of mathematics and everyday life, can be better understood with the help of Place Value Charts. These charts assist in visualizing the value of digits to the right of the decimal point, aiding in reading, writing, and comparing decimal numbers. They also support a deeper understanding of the relationship between fractions and decimals, which is crucial for advanced mathematical studies and practical applications.

    Promoting Independent Learning

    Place Value Charts are excellent resources for promoting independent learning. With the aid of a Printable Place Value Chart, learners can self-explore and self-check, building their confidence and autonomy in learning. The chart acts as a reliable reference, enabling learners to revisit and reinforce their understanding of place value at their own pace.

    Fostering Engaging Learning Experiences

    Educational games and interactive activities utilizing Place Value Charts make learning a more engaging and enjoyable experience. These interactive approaches can significantly enhance the retention and application of the knowledge acquired. By transforming abstract numerical concepts into tangible and interactive learning experiences, Place Value Charts contribute to a more effective and enjoyable learning journey.

    Visual Learning and Accessibility

    Visual learning is a powerful method for many individuals. Place Value Charts cater to visual learners by offering a graphic representation of numerical values. Moreover, by providing printable charts in various digital formats like PDF, Word, and Excel, learners have an accessible resource at their fingertips whenever they need it. The flexibility and availability of these resources accommodate diverse learning styles and needs, making mathematical learning more inclusive and accessible.

    Structure of the Place Value Chart

    A Place Value Chart is an organized tableau that breaks down numbers into their respective places: units, tens, hundreds, thousands, and so forth, which are often represented in columns. Starting from the right, each column represents a power of 10, with the first column representing 10^0 (1), the second representing 10^1 (10), the third representing 10^2 (100), and so on. Each column only has room for a single digit, from 0 to 9, which denotes the number of units of that power of 10 are present in the number being represented.

    Here’s a simplified breakdown of the structure:

    1. Units (Ones) Place: This is the first column on the right and represents single units.
    2. Tens Place: This is the next column to the left and represents tens.
    3. Hundreds Place: This is the next column further to the left and represents hundreds.
    4. Thousands Place: Moving leftward, this column represents thousands, and the pattern continues with every new column representing a power of 10 greater than the last.

    Further divisions or extensions can include decimal places such as tenths, hundredths, thousandths, etc., which follow a similar logic but to the right of a decimal point.

    Reading and Writing Numbers Using the Place Value Chart

    The Place Value Chart is instrumental in reading and writing numbers correctly. Here’s how it facilitates this fundamental aspect of numeracy:

    1. Reading Numbers:
      • When faced with a large number, it can be broken down column by column in the Place Value Chart to understand its full value.
      • For instance, the number 8,572 can be dissected into eight thousand, five hundred, seventy, and two units using the chart.
      • The Place Value Chart also assists in reading decimal numbers by understanding the value of digits after the decimal point, such as in the number 45.678.
    2. Writing Numbers:
      • When given a verbal or written description of a number, the Place Value Chart assists in writing that number down accurately.
      • For example, โ€˜four thousand and fifty-sixโ€™ would be written as 4,056.
      • Additionally, when tasked with writing a decimal number, understanding the place value of each digit ensures accurate representation.

    Decimal Place Value

    Decimals are fundamental components of numerical representation, extending the notion of place value beyond whole numbers into fractional parts. They play a pivotal role in everyday calculations, measurements, and data representation. Grasping the concept of decimals and their position on a Place Value Chart is crucial for a well-rounded understanding of mathematics.

    1. Understanding Decimals

    Decimals are a way of representing fractions and mixed numbers in a base-10 system. They utilize a decimal point to separate the whole number part from the fractional part. Every position to the right of the decimal point represents a division by a power of 10. The first position represents tenths, the second represents hundredths, the third represents thousandths, and so on.

    • Representation: Decimals are represented using a decimal point, with digits to the right of the point representing fractional values. For instance, 0.25 represents twenty-five hundredths.
    • Equivalence to Fractions: Decimals correspond to certain fractions; for instance, 0.5 is equivalent to 1/2, 0.25 is equivalent to 1/4, and so forth.
    • Comparison: Understanding decimals assists in comparing values, identifying which is larger or smaller.
    • Decimal Place Value Chart

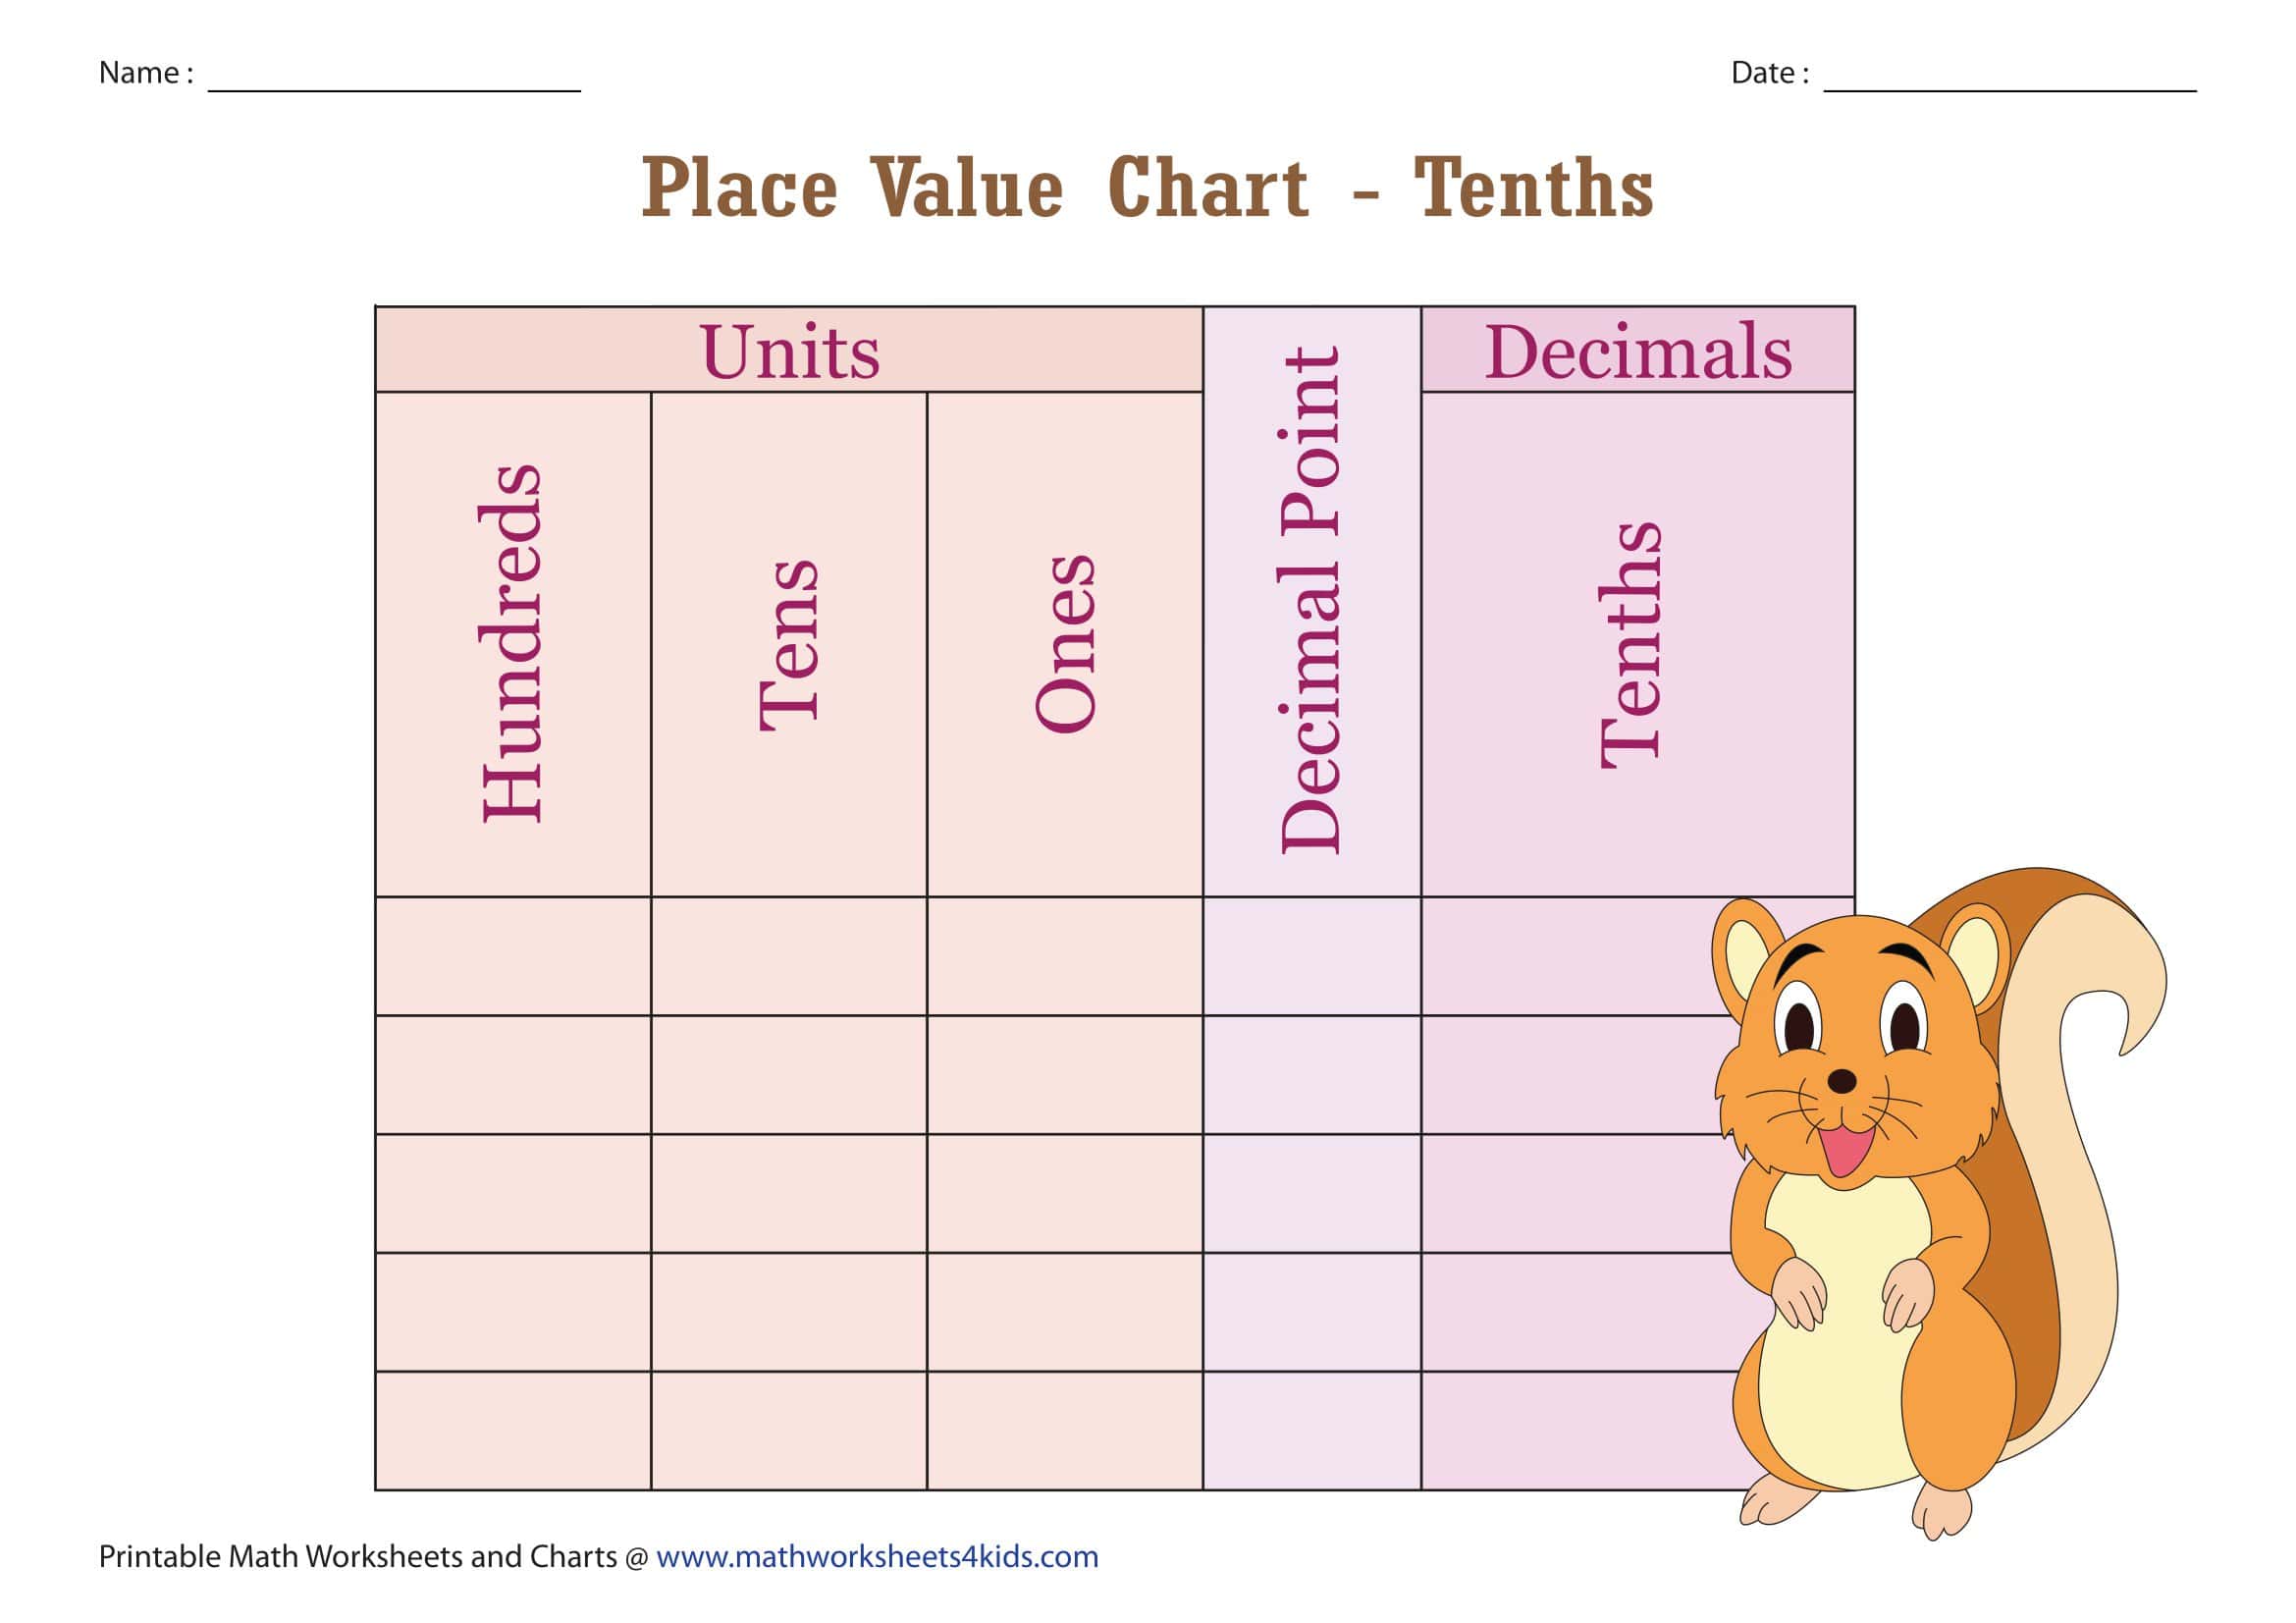
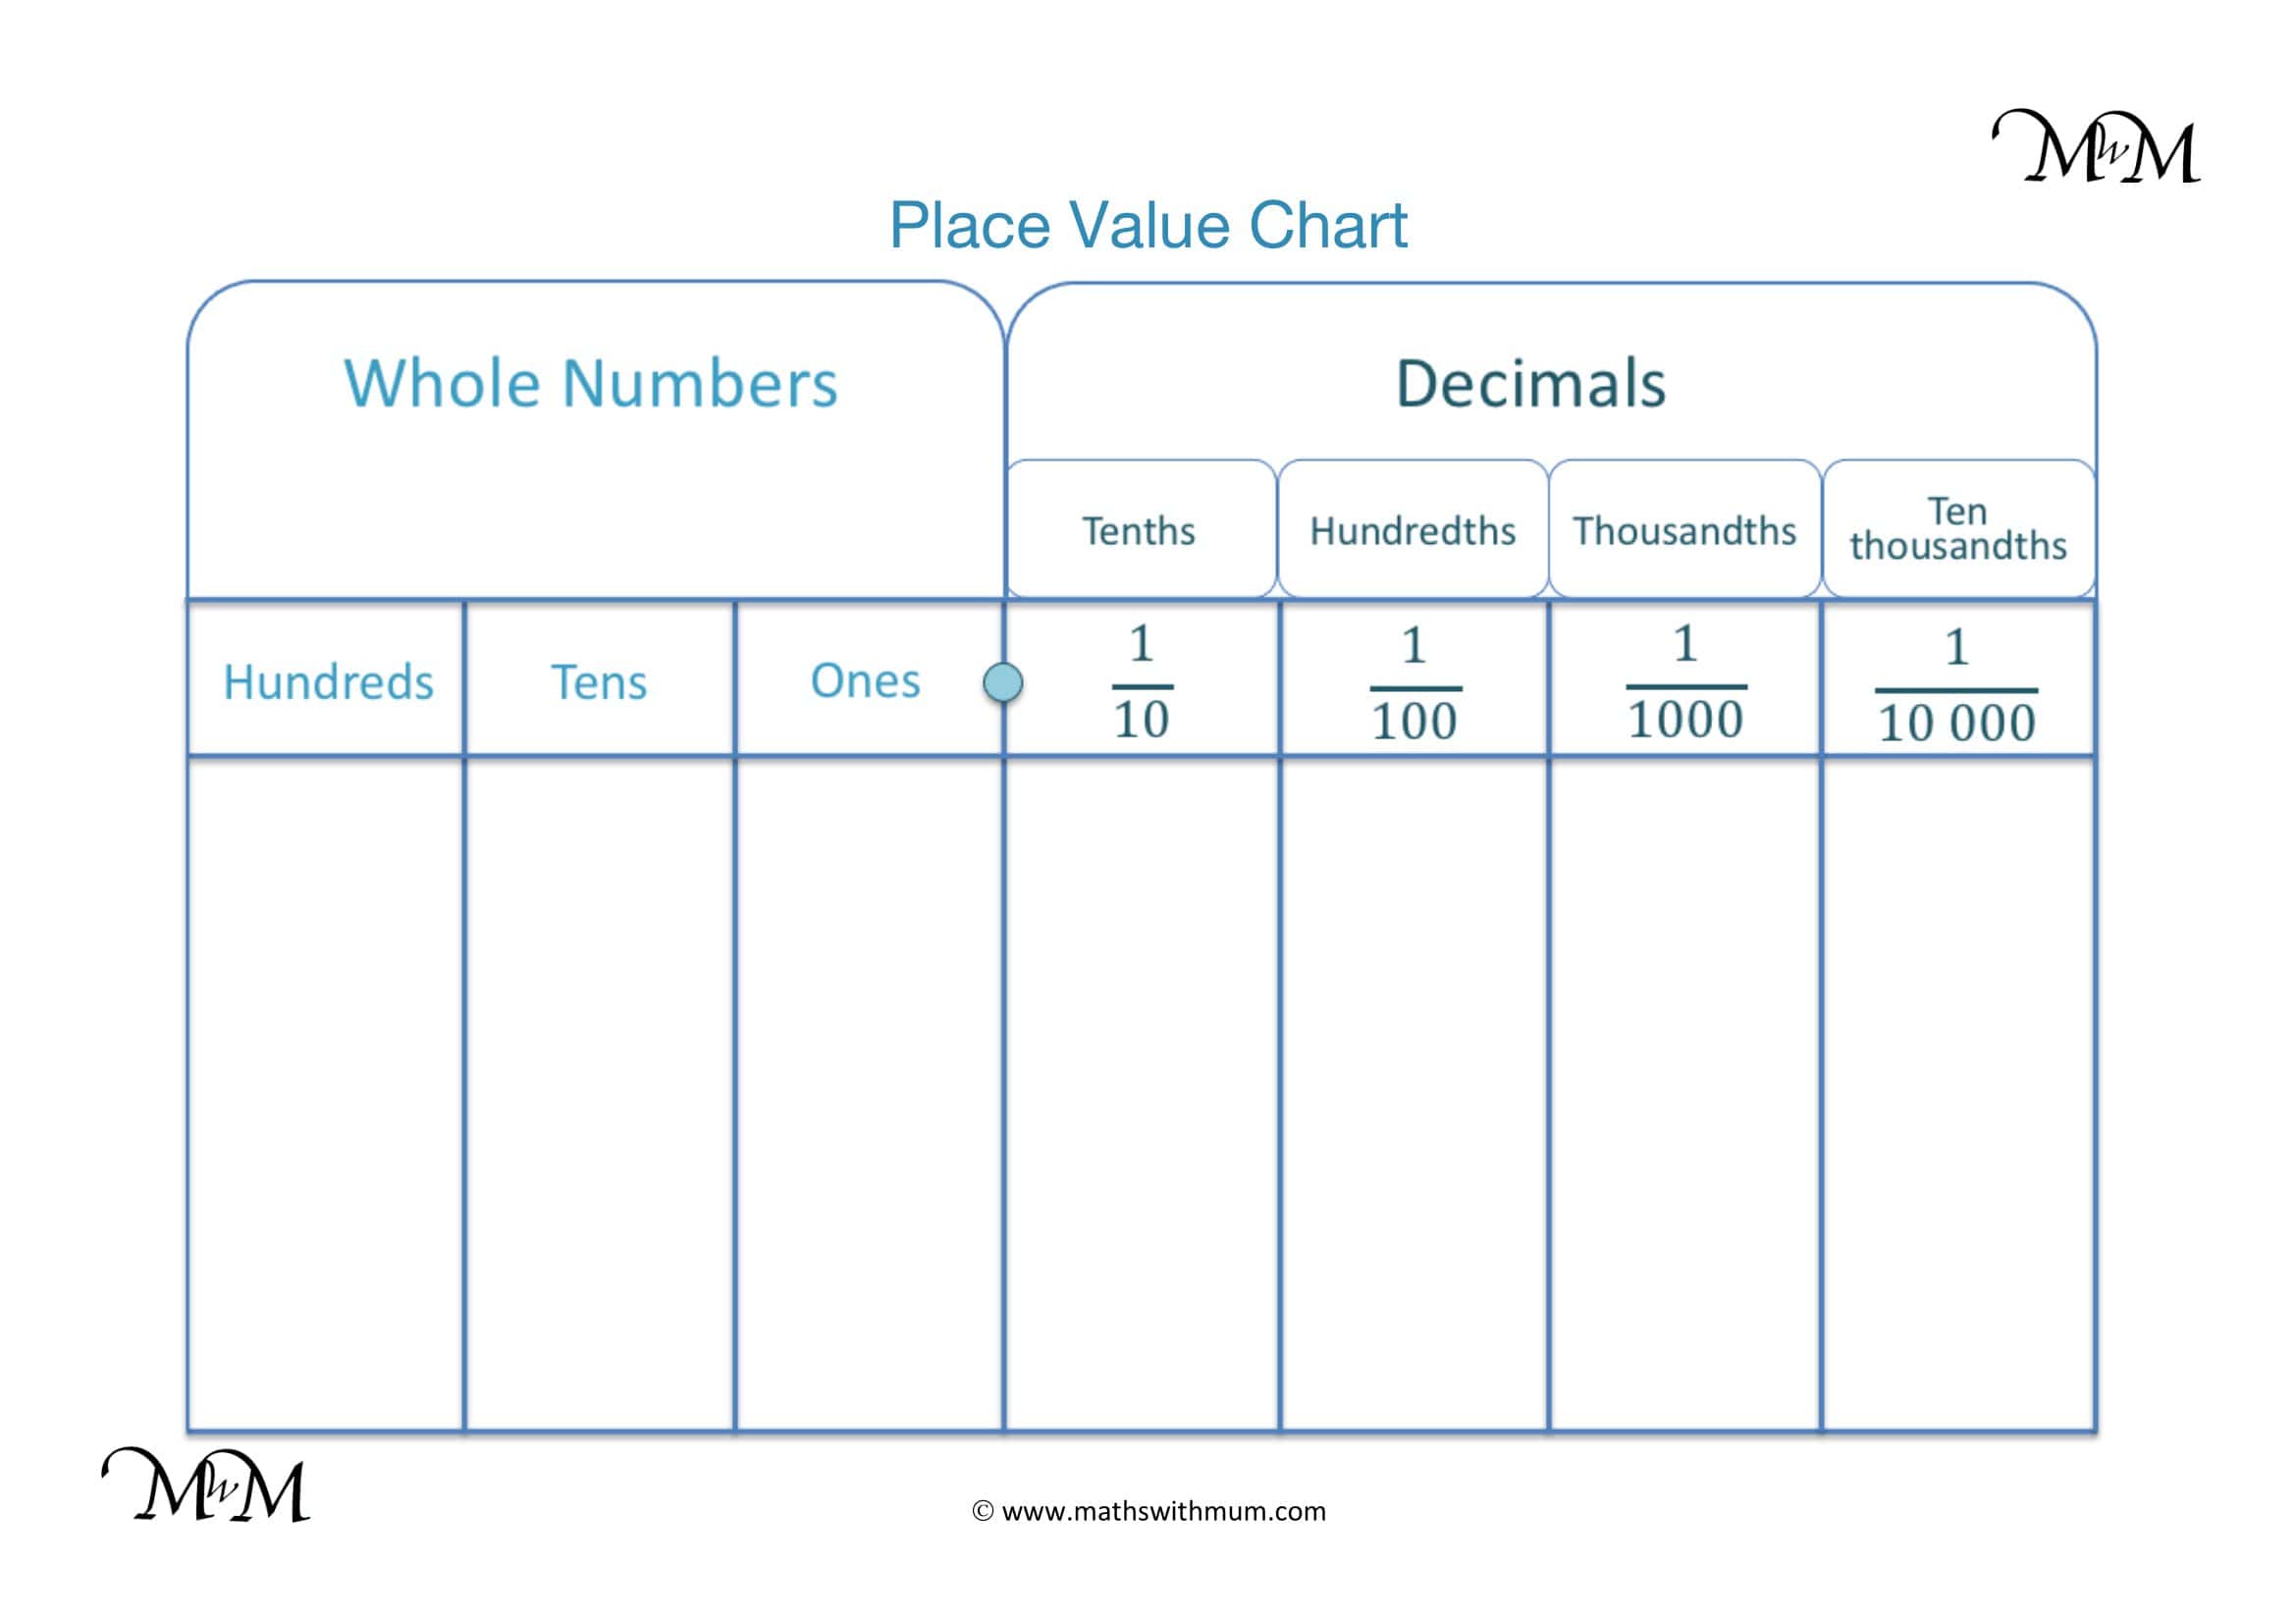
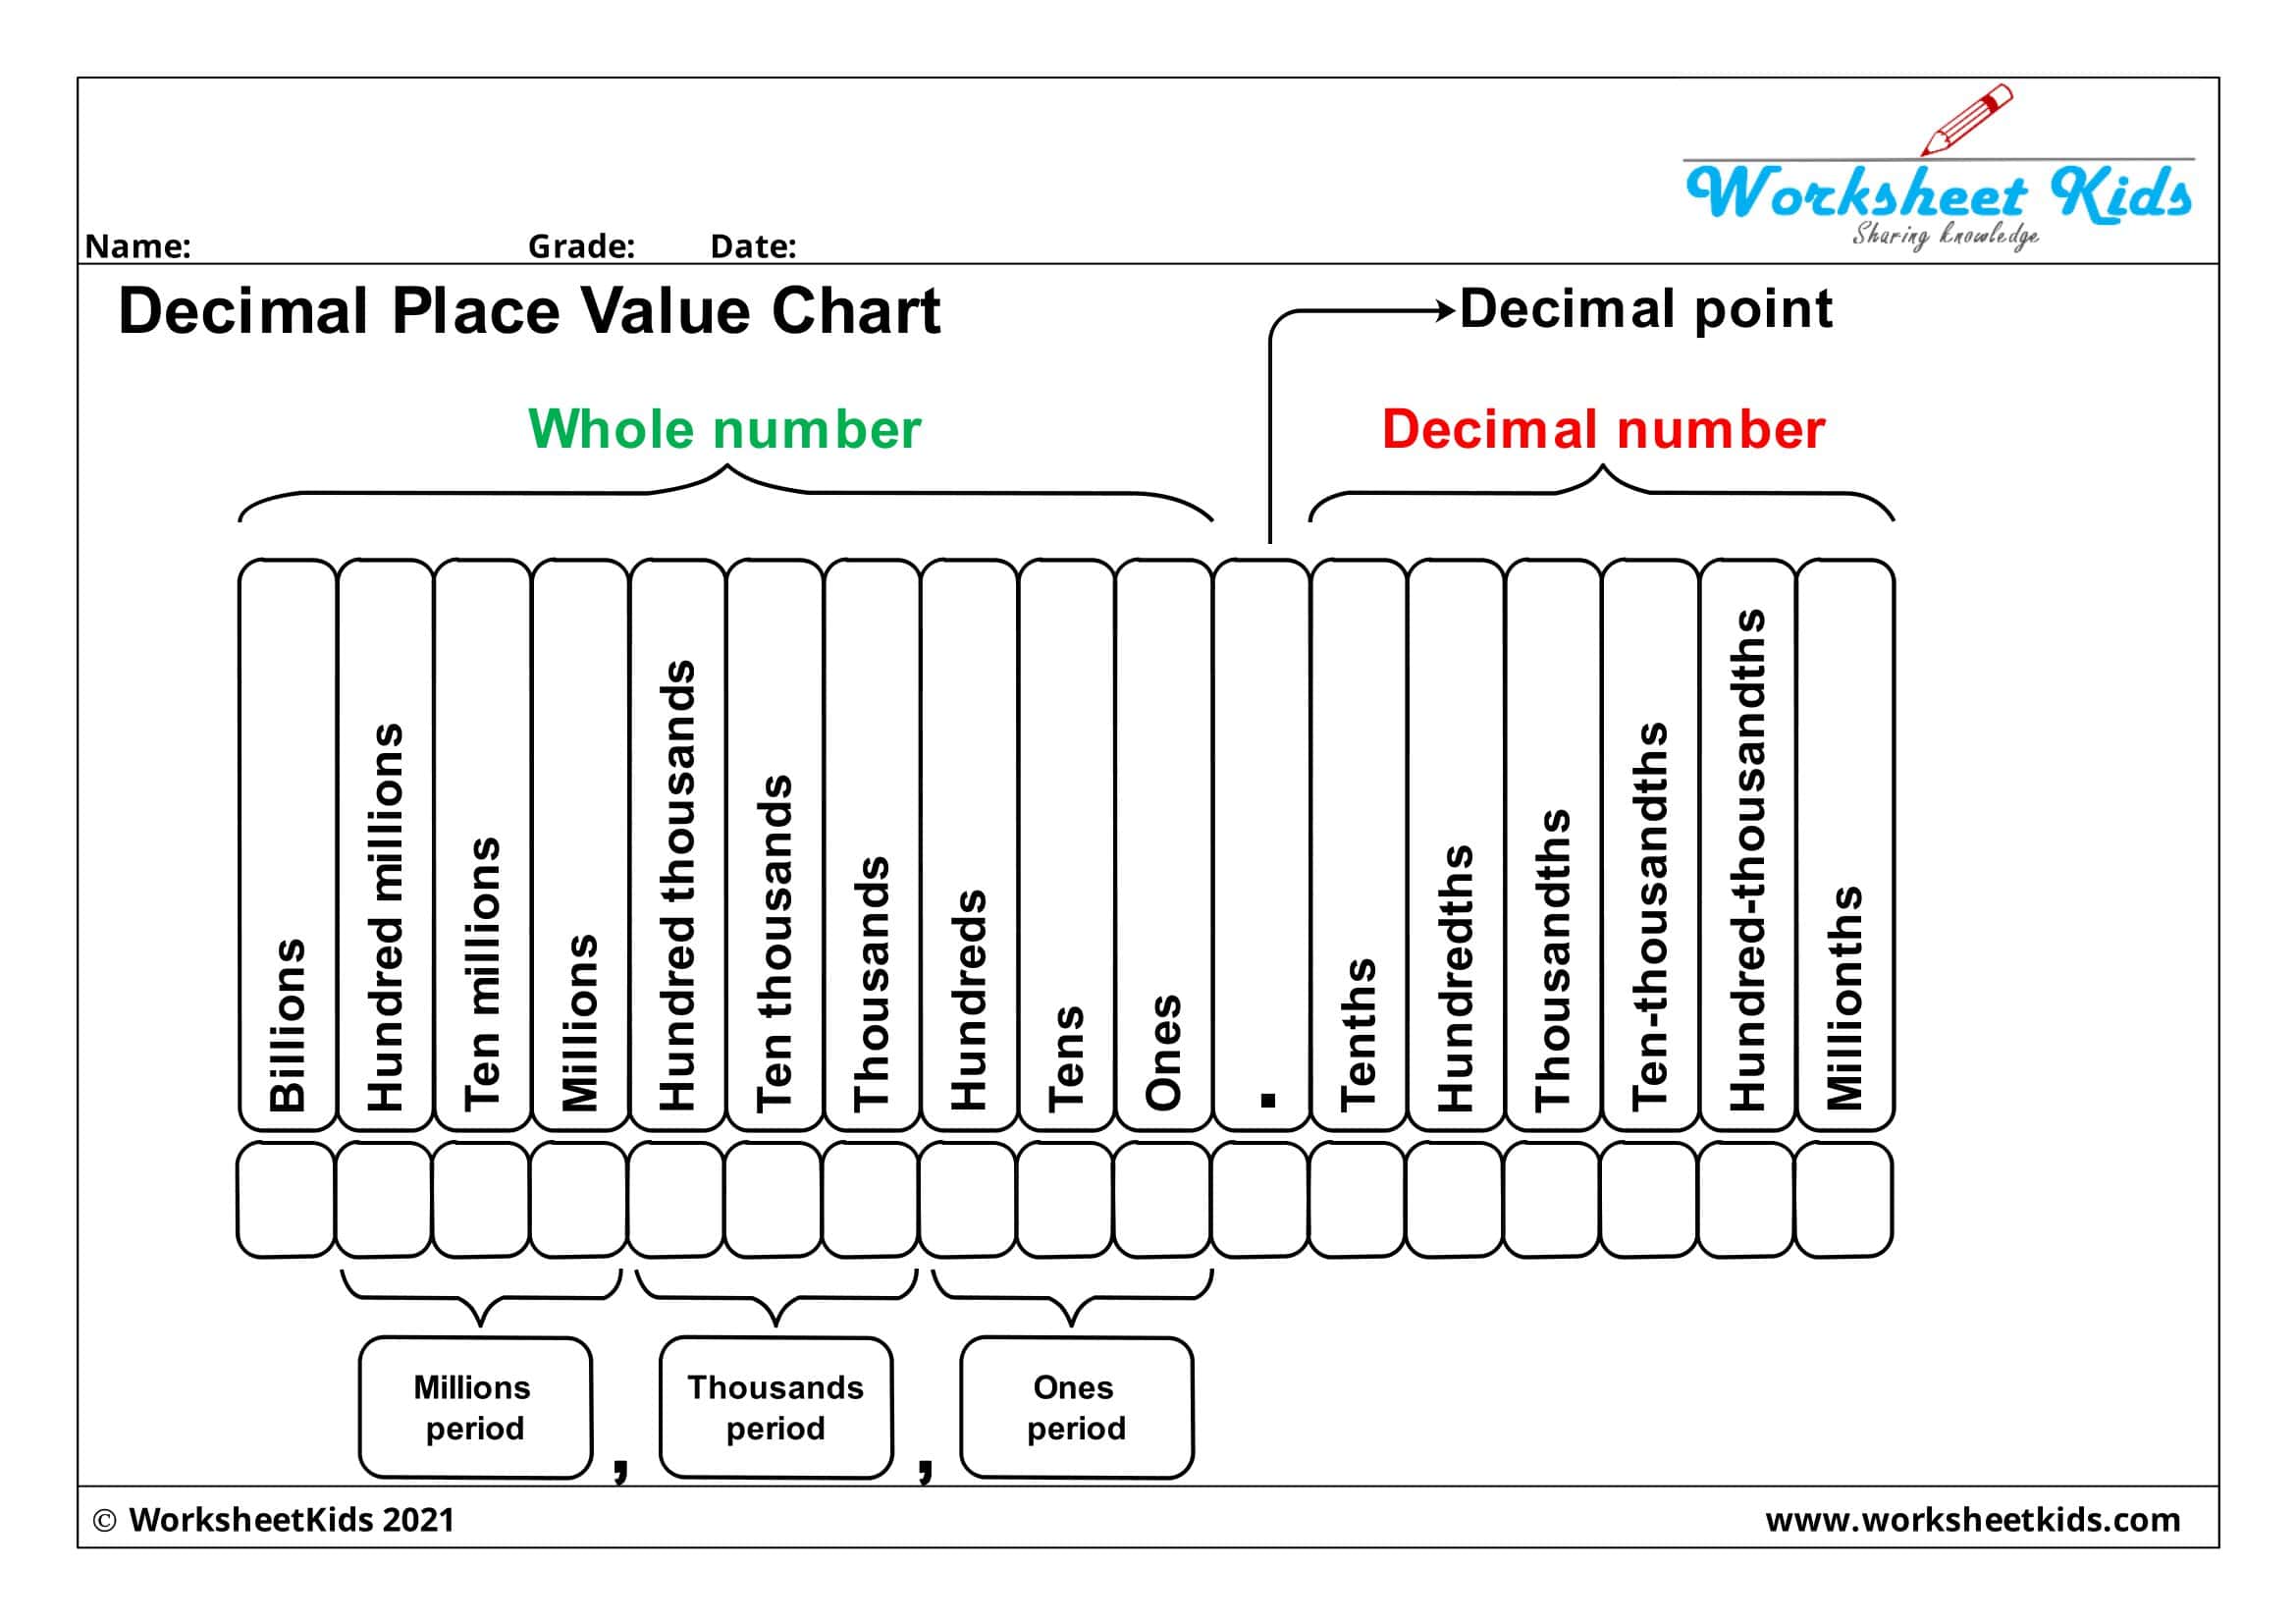
    A Decimal Place Value Chart is a visual tool that helps individuals understand the positions and values of digits in decimal numbers. It extends the concept of place value to include positions to the right of the decimal point.

    • Structure:
      • Tenths Place: The first position to the right of the decimal point. Each unit here is one-tenth of a whole.
      • Hundredths Place: The second position to the right of the decimal point. Each unit here is one-hundredth of a whole.
      • Thousandths Place: The third position, where each unit is one-thousandth of a whole. This pattern continues indefinitely, with each position representing a further division by 10.
    • Reading and Writing Decimals:
      • Using the Decimal Place Value Chart, decimals can be read and written more easily. For instance, 0.275 can be read as “two hundred seventy-five thousandths.”
      • The chart also assists in writing decimals when given in word form. For example, “seven tenths” would be written as 0.7.
    • Comparison and Operations:
      • The chart facilitates the comparison of decimal numbers by aligning them according to their place value.
      • It also supports arithmetic operations with decimal numbers, aiding in the correct placement of the decimal point.
    • Conversion Between Fractions and Decimals:
      • By utilizing the Decimal Place Value Chart, one can better visualize the relationship between fractions and decimals, facilitating the conversion between the two.

    What Are the Games to Play With Your Printable Place Value Chart?

    Game 1: Place Value Battle

    Introduction: Place Value Battle is a stimulating game designed to make learning about place values an enjoyable venture. This game is reminiscent of the classic card game “War,” but with an educational twist. It encourages players to understand, compare, and analyze the value of digits based on their positions. It can be played between two or more players, and all you need are your Printable Place Value Charts and a deck of cards.

    Preparation: To begin with, each player should have a Place Value Chart in front of them. The deck of cards should be shuffled and distributed equally among all players. In this game, face cards (Jacks, Queens, Kings) are considered as zero, and Aces are valued at one. The objective of the game is to create the highest value number in each round to win cards from the opponents.

    Game Play: Each round starts with players drawing a set number of cards from their deck (for example, four cards each). Players then decide where to place each card on their Place Value Chart to create the highest possible number. For instance, if a player draws a 5, 8, 2, and 7, placing the 8 in the thousands place, 7 in the hundreds place, 5 in the tens place, and 2 in the ones place creates the number 8,752. Once all players have arranged their cards, they reveal their numbers. The player with the highest number wins that round and collects all the cards from the other players, putting them at the bottom of their deck.

    Engagement and Learning: As rounds progress, players will get more comfortable with the concept of place value and start to strategize on how to create the highest value number. Itโ€™s a competitive way to enhance learning and ensure that players understand the importance of each place value. The game continues until one player collects all the cards or until the players decide to end the game.

    Game 2: Decimal Detective

    Introduction: Decimal Detective is an enthralling game that dives into the world of decimal numbers. It helps in sharpening the understanding of decimal place values while indulging in a fun, investigative scenario. Players become detectives, decoding hidden numbers through clues based on decimal place values. Your Printable Place Value Chart, along with some prepared clues, are the primary materials for this game.

    Preparation: Firstly, prepare a list of decimal numbers and corresponding clues that hint at the digits in the tenths, hundredths, and thousandths places. For instance, a clue might read: “The digit in the tenths place is twice the digit in the hundredths place, and the digit in the hundredths place is three more than the digit in the thousandths place.” Each player receives a Printable Place Value Chart to help them decode the clues and find the hidden number.

    Game Play: Players take turns drawing a clue from the pile and then attempt to decode the hidden number using their Place Value Chart. They can jot down their answers on a piece of paper. Set a timer for added excitement and to keep the pace brisk. Each correct answer earns a point, and the game continues until all clues are solved.

    Engagement and Learning: Decimal Detective not only enhances the understanding of decimal place values but also promotes logical reasoning and problem-solving skills. As players delve into the clues, they will be sharpening their math skills in a fun and engaging way. The competitive or collaborative nature of the game, depending on how you choose to play, fosters a stimulating environment for learning and exploring decimal place values.

    Conclusion

    Gaining place value understanding is a pivotal milestone on the path towards math proficiency. Place value charts serve as an invaluable hands-on tool for reinforcing this vital concept. In this article, we have discussed what place value is, how place value charts model relative digit positions, and the many benefits of using charts for active learning. To aid educators and parents, we have included free printable blank place value chart templates in PDF, Word, and Excel formats.

    These can be used in lessons and activities to build place value comprehension. Students can fill in the charts themselves to manipulate the place values and solidify their understanding. With these free printable charts, teachers and parents have a practical resource to make place value concrete. Learning and practicing with hands-on charts fosters confidence and skills for math achievement. We hope these customizable place value chart templates will help make this foundational learning experience engaging and successful.

    FAQs

    Is there a difference between a Place Value Chart and a Place Value Table?

    While both tools serve to illustrate the concept of place value, a Place Value Chart typically provides a more visual and spatial representation, while a Place Value Table might present the information in a more textual or tabular format. Both are useful for understanding place value, but a chart might be more intuitive for visual learners.

    Are Place Value Charts suitable for all ages?

    While Place Value Charts are primarily geared towards early learners and those new to the concept of place value, they can also be a useful visual aid for older students or adults looking to refresh their understanding or tackle more complex decimal-related problems. The versatility and simplicity of Place Value Charts make them a valuable tool for learners of all ages.

    Can I create my own Place Value Chart?

    Absolutely! Creating your own Place Value Chart can be a great learning exercise. You can use graph paper, spreadsheet software like Excel, or even online chart creation tools to design a Place Value Chart that meets your specific needs or those of your students.

    How can educators benefit from using Place Value Charts in their teaching?

    Educators can use Place Value Charts to visually explain and reinforce the concept of place value, making it easier for students to grasp. They can also use these charts to create interactive lessons, games, and exercises that make learning about place value more engaging and effective.

    Click to rate this post!
    [Total: 0 Average: 0]
    Betina Jessen

    Betina Jessen

    Leave a Reply

    Your email address will not be published. Required fields are marked *