KWL Charts, an educational tool based on a three-column layout denoting ‘What I Know’, ‘What I Want to Know’, and ‘What I Learned’, serves as a powerful instructional strategy to stimulate student learning and engagement. This article delves into the profound understanding of KWL Charts, their genesis, applications, benefits, and effective utilization in diverse educational contexts.
The KWL Chart, a scaffold that promotes active involvement, facilitates knowledge construction, fosters curiosity, and encourages reflective learning, has immense significance in shaping contemporary pedagogical approaches. Whether it’s a primary school student exploring a new topic or a university researcher identifying knowledge gaps, the KWL Chart can act as a versatile companion on the journey towards comprehensive learning.
Table of Contents
What is a KWL chart?

A KWL Chart is an interactive learning tool designed to enhance comprehension and encourage active engagement in the learning process. It’s a three-column chart where “K” stands for what the learner already “Knows”, “W” represents “What” the learner wants to find out, and “L” denotes “What” the learner ultimately “Learned”.
This method encourages learners to tap into their prior knowledge, identify their learning objectives, and reflect on what they have learned, thus fostering a deep, personal connection with the material. Commonly used in classrooms across various education levels, the KWL Chart is instrumental in promoting self-directed learning, critical thinking, and reflective analysis.
KWL Chart Templates
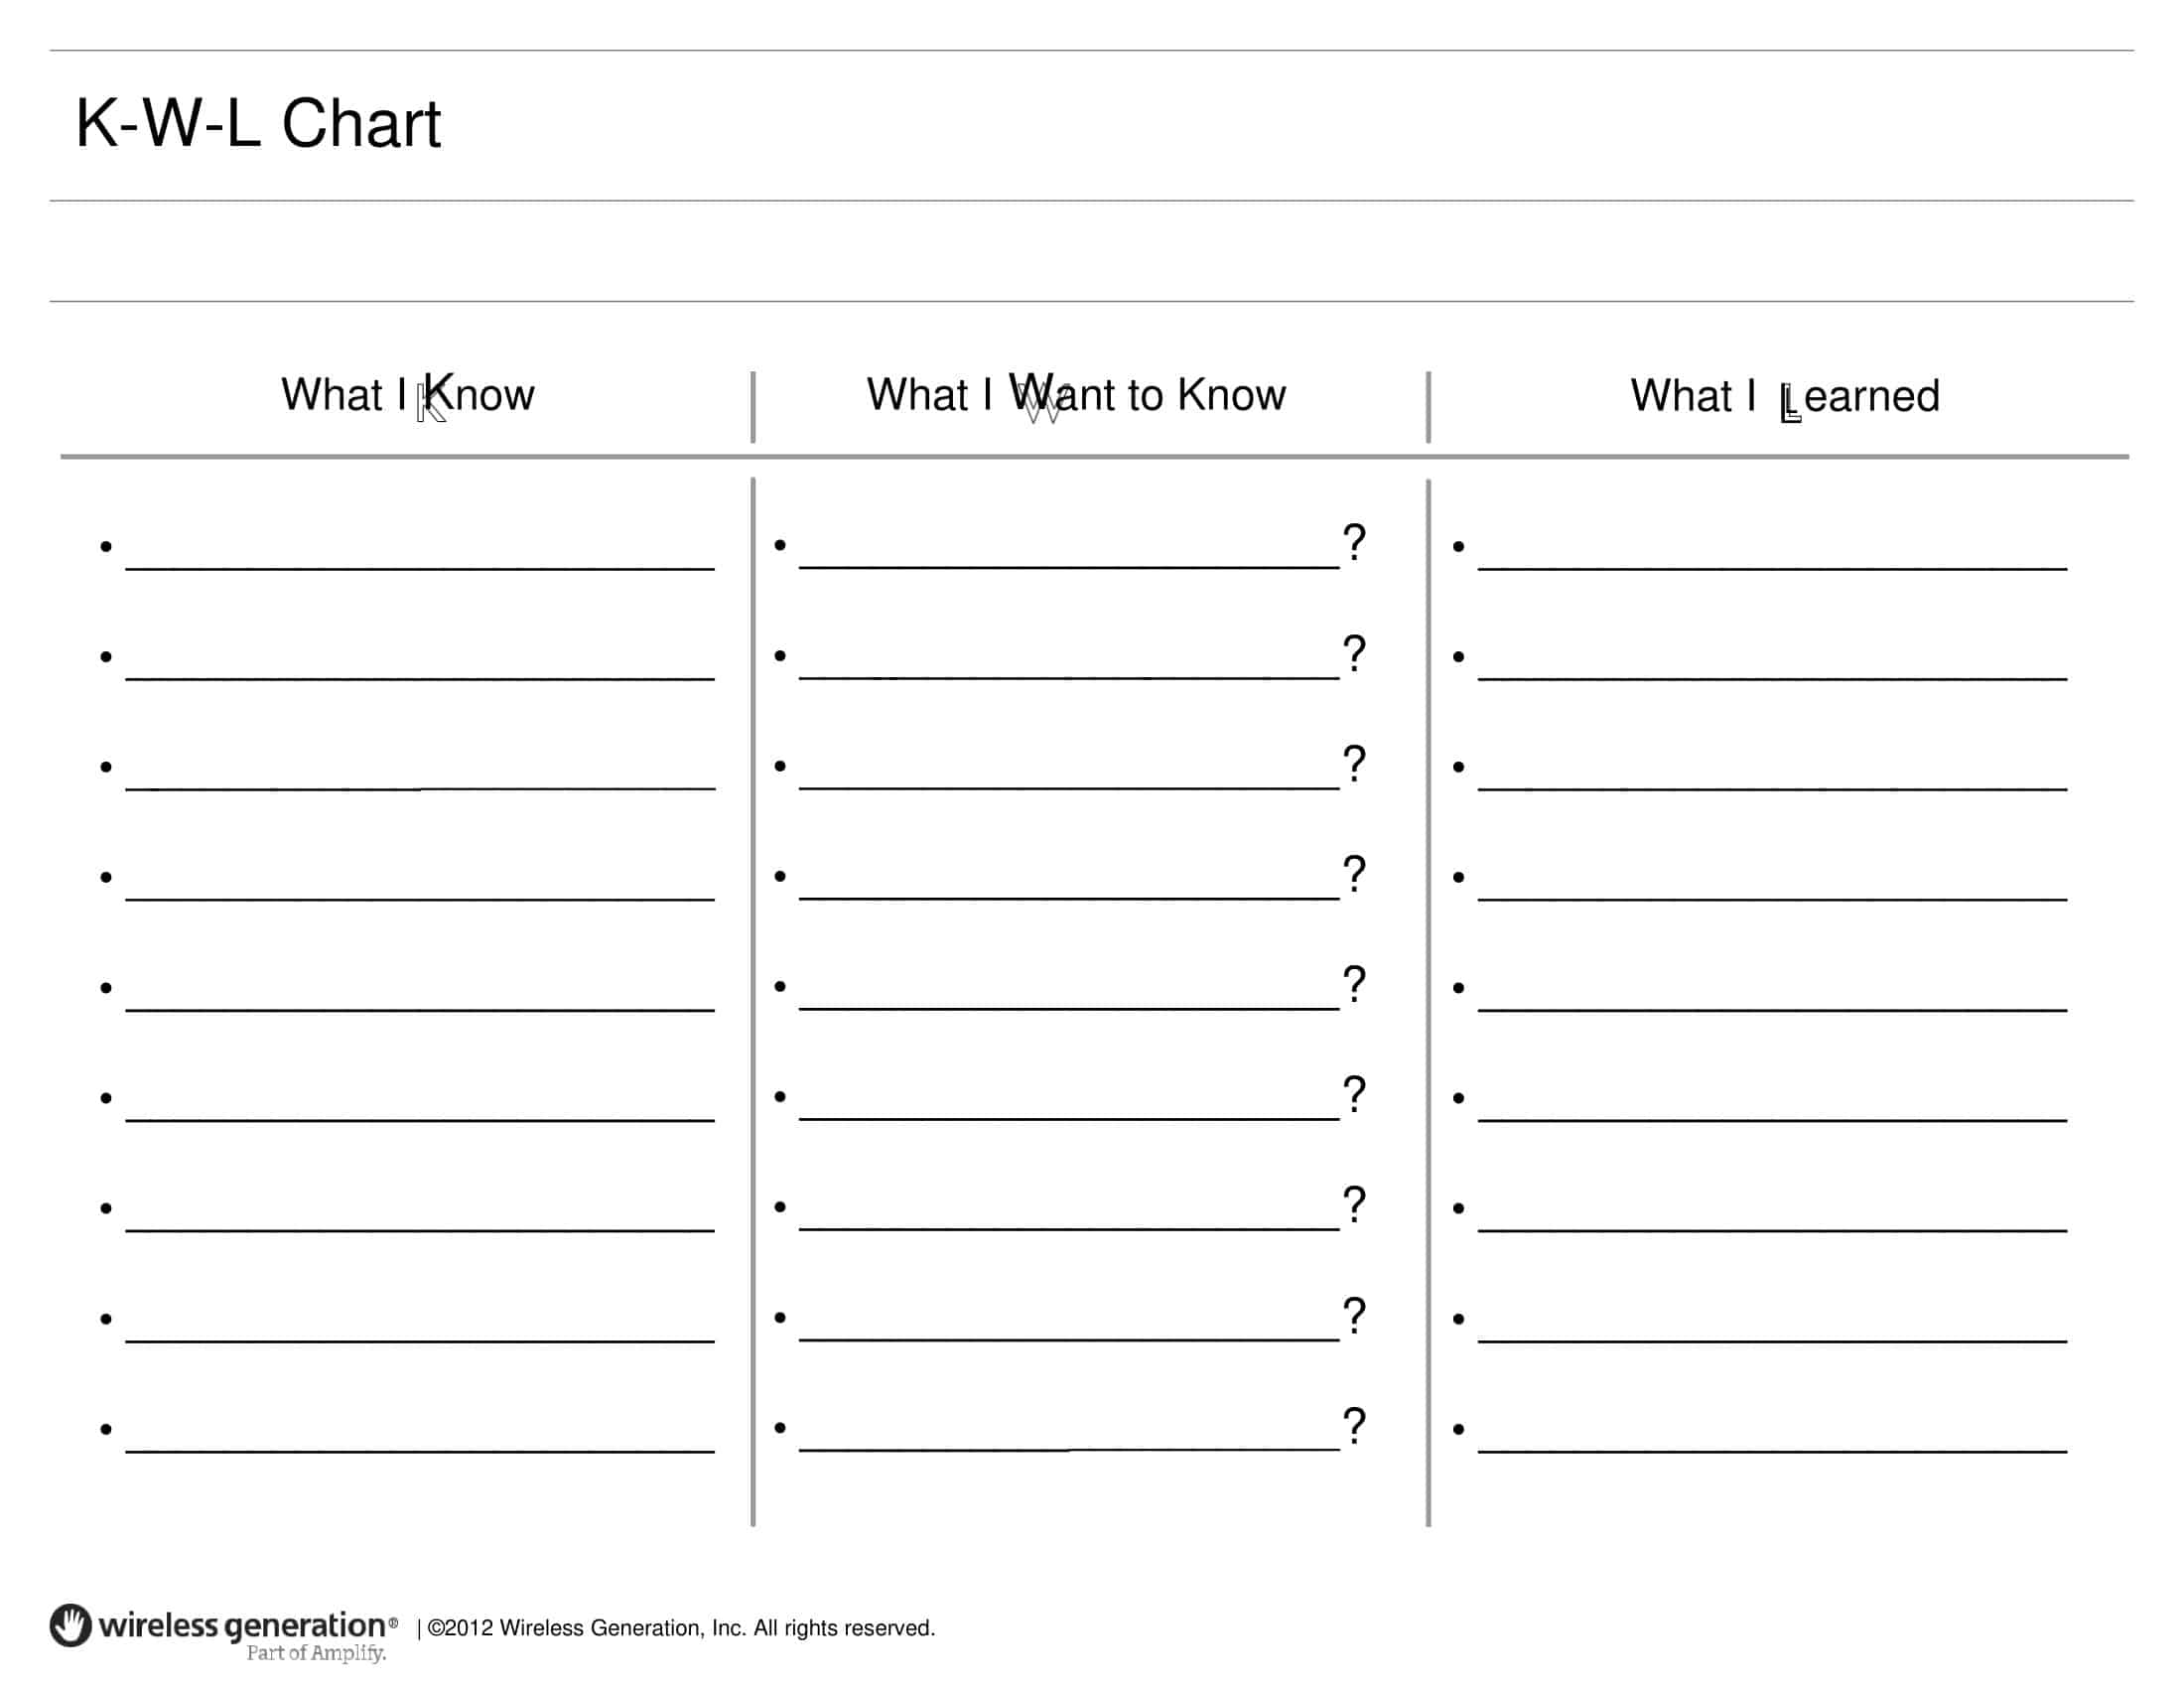
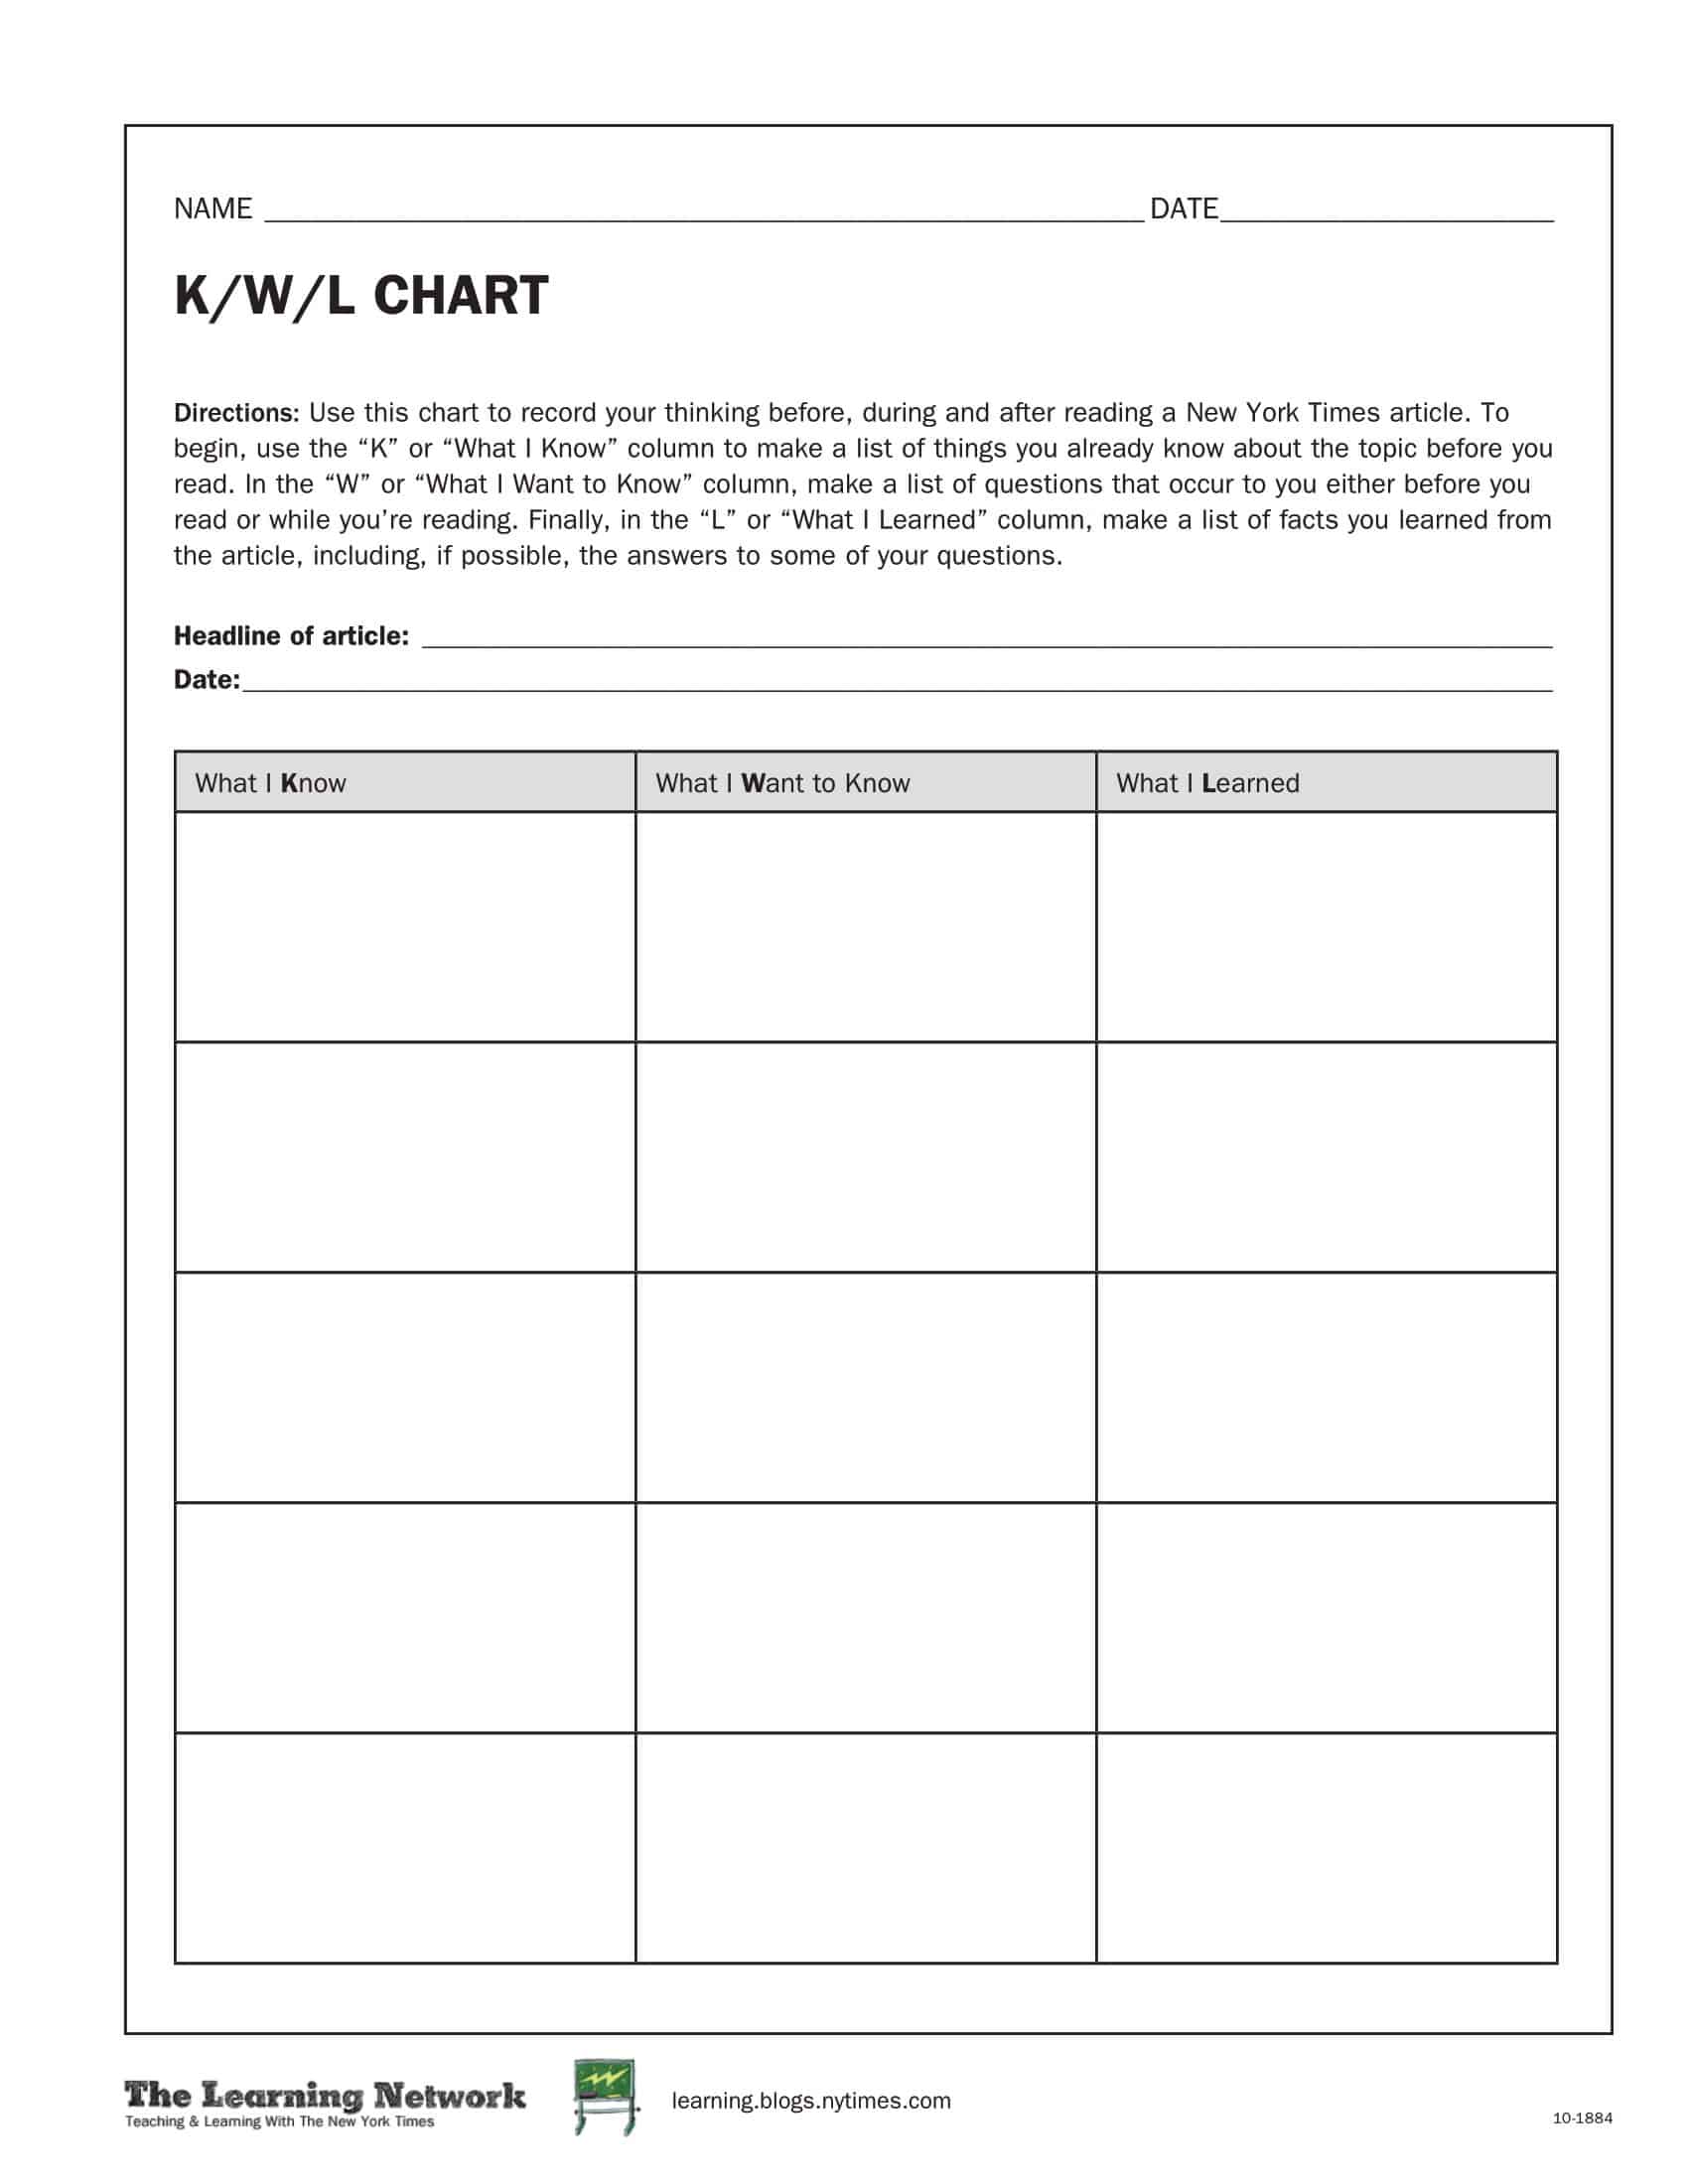
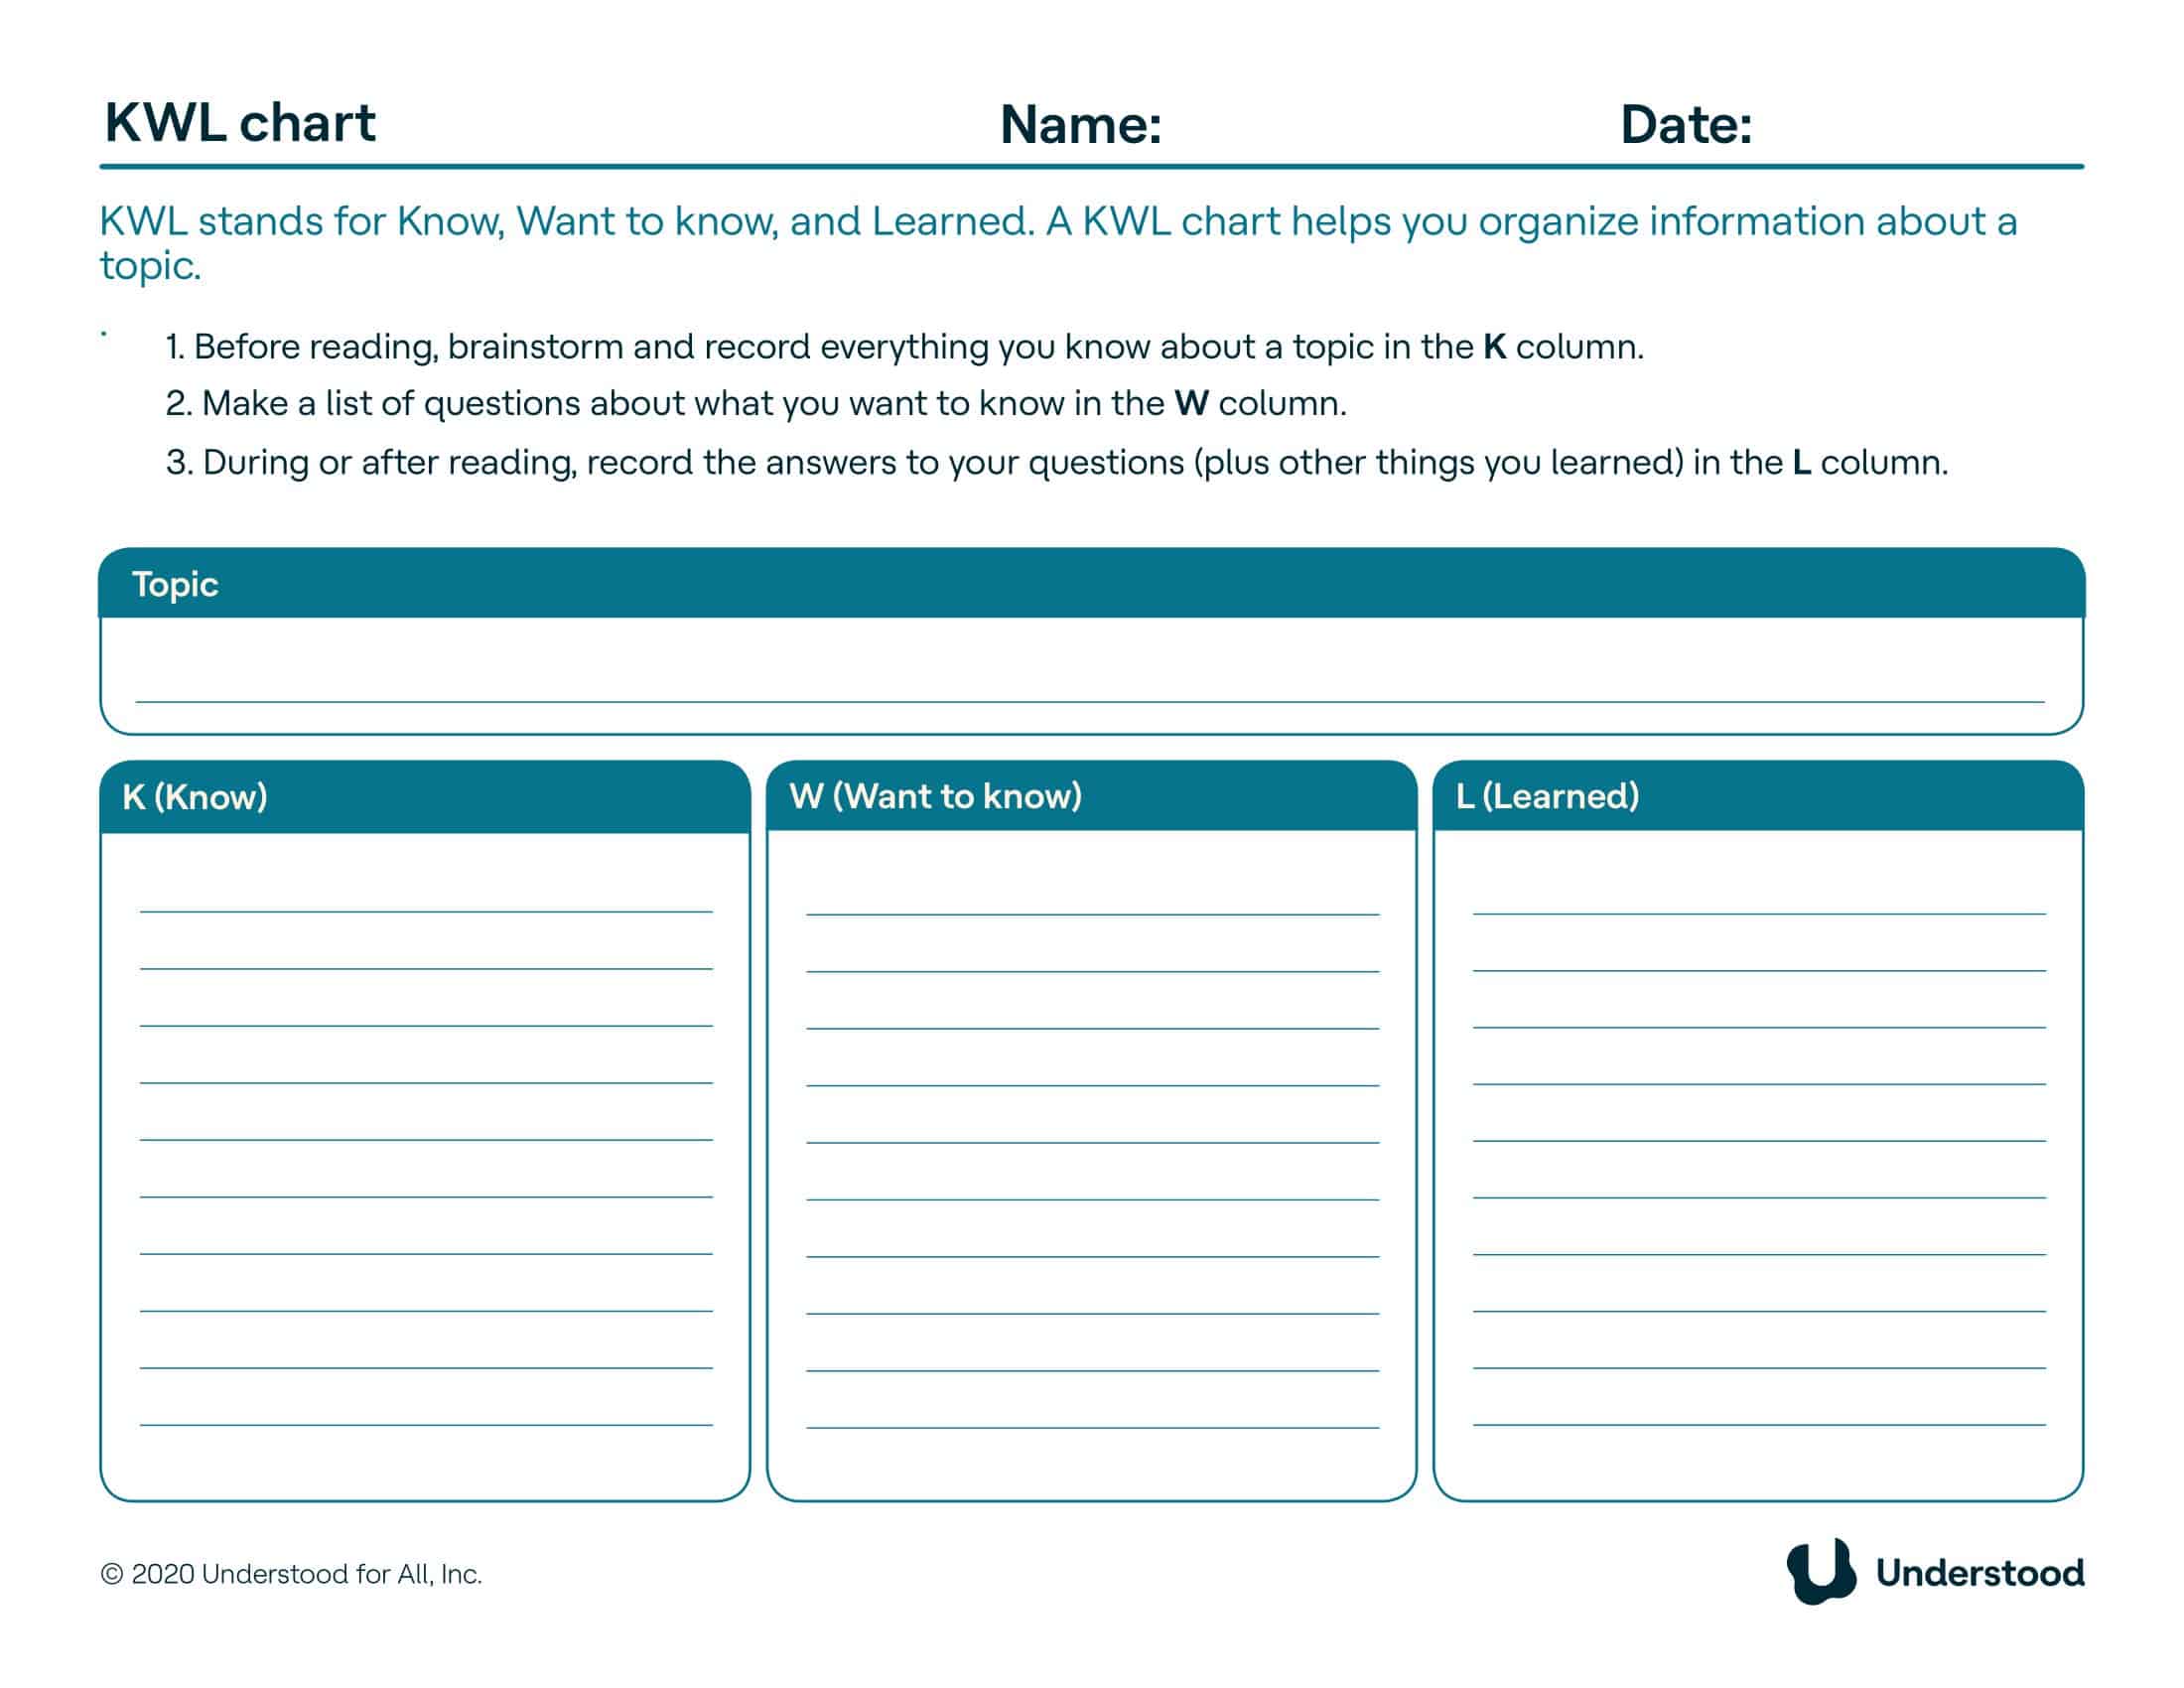
KWL Chart Templates are useful educational tools often employed in classroom settings to enhance learning through active engagement and structured thinking. They are diagrams that help students organize information before, during, and after a lesson or a research project.
The acronym KWL stands for ‘Know‘, ‘Want to know‘, and ‘Learned‘, each of which forms a column in the chart. The ‘Know‘ column captures what students already know about a topic. The ‘Want to know’ column includes what students hope to learn. Finally, the ‘Learned’ column, filled in after the lesson or research, contains what students have learned.
The KWL Chart Templates find application across diverse educational settings and subjects. They are versatile and can be adapted to any topic, ranging from scientific concepts and historical events to literature analysis and language studies. Students of any age can use these charts to improve their comprehension and retention.
Benefits of KWL Charts
As a simplistic yet potent tool for visual learning, the KWL Chart has garnered widespread popularity in educational settings, ranging from traditional classrooms to contemporary virtual learning environments. Given today’s dynamic educational landscape, students of diverse age groups, who now frequently attend classes from their homes, effectively employ the KWL Chart in their learning regimen.
The chart’s strategic design serves as a catalyst, igniting student engagement and participation in learning sessions. It not only serves as a refresher, rejuvenating students’ existing knowledge on a particular topic, but also plays a pivotal role in unveiling gaps in their understanding. The beauty of the KWL Chart lies in its simplicity, enabling students to contribute actively and seamlessly to their learning journey. With that said, let’s explore the multitude of benefits this remarkable template has to offer:
Promotes Active Learning: One of the most significant advantages of a KWL Chart is that it promotes active learning. Instead of simply absorbing information, students are encouraged to engage with the material actively, contributing what they already know and formulating questions about what they want to know.
Engages Prior Knowledge: The “K” in KWL stands for “Know.” This section prompts students to draw on their existing knowledge about a subject. Not only does this set the stage for new information, but it also helps teachers gauge their students’ understanding and knowledge level before the learning process begins.
Sets Learning Goals: The “W” section of the KWL Chart allows students to articulate what they want to learn from a particular topic or lesson. This helps set clear learning goals and gives students a sense of direction and purpose.
Encourages Reflective Learning: The “L” stands for “Learned”, which prompts students to reflect upon and record what they’ve learned after studying a topic. This fosters a deeper understanding of the subject matter and helps cement the new knowledge in their minds.
Supports Differentiated Instruction: KWL Charts are versatile tools that support differentiated instruction, catering to diverse learning styles. Visual learners, in particular, benefit from the chart’s clear structure. Plus, the process encourages critical thinking and self-expression, benefiting a broad range of learners.
Facilitates Assessment: For educators, KWL Charts provide a valuable means of formative assessment. By reviewing students’ charts, teachers can gain insights into their students’ understanding and progress, thereby enabling them to tailor their teaching strategies more effectively.
Encourages Collaborative Learning: KWL Charts can be used as a tool for collaborative learning. When used in group activities, they encourage discussions, facilitate idea exchange, and promote team working skills among learners.
Increases Student Motivation: When students are involved in setting their learning goals and reflecting on their progress, it can boost their motivation and engagement. Seeing their learning journey visually represented in a KWL Chart can foster a sense of achievement and enthusiasm for further learning.
How to use a KWL chart?
Embarking on a journey of learning or teaching a new topic can be both exciting and overwhelming. This is where a KWL Chart comes into play, serving as a simple, yet powerful tool for structuring this process and making it more effective.
Designed around three core principles of understanding – ‘What I Know’, ‘What I Want to Know’, and ‘What I’ve Learned’, the KWL Chart assists in streamlining thoughts, fostering curiosity, and instilling reflective practices in learners. Whether you’re an individual learner or an educator, understanding how to use this chart can greatly enhance the learning experience. In this part, we’ll delve deeply into how to use a KWL Chart and the distinct aspects of each column:
1. Preparation
Before you start, you’ll need to create a KWL chart. This can be done on a whiteboard, a piece of paper, or digitally. The chart is divided into three columns labeled K, W, and L.
K (What You Know):
The first step in using a KWL Chart is filling out the “K” column, which stands for “Know”. This column should contain everything the learner already knows about the topic. Here’s how you can proceed:
- Individual Activity: If you’re a student studying independently, start by jotting down everything you know about the topic. These could be key concepts, facts, names, dates, or any relevant piece of information you’re aware of. Don’t worry about organization at this stage. The aim is to get all your existing knowledge about the topic out on the chart.
- Group Activity: If you’re working in a group, this column becomes a great discussion starter. Each member can contribute their knowledge, enabling a collective brainstorming session. Remember, no piece of information is too small or irrelevant at this stage.
W (What You Want to Know):
The second column “W”, represents what the learner wants to know or learn about the topic. This column is crucial for setting learning objectives and guiding the learning process. Here’s how to use it:
- Individual Activity: As an individual learner, use this section to list questions you have about the topic, areas you’re curious about, or specific information you want to find. These questions will guide your research or study as you delve deeper into the topic.
- Group Activity: In a group setting, each member can contribute their questions and areas of interest. This can lead to a rich discussion and might bring up aspects of the topic others hadn’t considered. The resulting list of questions serves as a collective learning guide for the group.
L (What You’ve Learned):
The final column “L” is for what the learner has learned. This is typically filled out after the learning activity or lesson has taken place. It encourages reflection and helps consolidate new knowledge. Here’s how to use it:
- Individual Activity: As an individual learner, use this column to note down new information you’ve discovered, answers to your questions from the “W” column, or surprising facts you’ve encountered. Reflect on how this new knowledge connects to what you knew before and how it has expanded your understanding of the topic.
- Group Activity: In a group setting, this is an opportunity to share new knowledge with each other. Each member can discuss what they’ve learned, compare this with their initial questions, and reflect on the learning process together.
A well-used KWL chart is more than just a collection of facts; it’s a visual representation of a learner’s journey. Whether used individually or in a group, it’s a powerful tool for fostering active, self-directed learning. Remember, the process of filling out the chart is just as important as the end result, as it nurtures curiosity, critical thinking, and reflective learning.
How do you make a KWL chart?
Before diving into a new subject matter, employing a KWL chart can work wonders in framing the students’ learning journey. As an instructor, taking the initiative to demonstrate the creation of a KWL chart, potentially using a freely available online template, is a step towards enhancing students’ understanding and engagement. Here’s a step-by-step guide outlining this process:
Step 1: Choose Your Medium
Decide where you’ll create your KWL chart. This could be on a piece of paper, a whiteboard, or digitally. If you’re a teacher, you might want to use a large chart paper or interactive whiteboard that the entire class can see. If you’re a student studying independently, a piece of notebook paper or a digital document might be more suitable.
Step 2: Draw the Chart
Draw a large rectangle and divide it into three columns. The size of the rectangle will depend on the space you have available, but ensure that each column is wide enough to record information comfortably.
Step 3: Label the Columns
Label each column with the respective headings: “K” (What I Know), “W” (What I Want to Know), and “L” (What I Learned).
Step 4: Choose the Topic
Identify the topic you’re going to explore. This could be a new subject you’re about to study, a book you’re about to read, a project you’re starting, etc. Write this topic at the top of your chart for clarity.
Step 5: Fill in the ‘K’ Column
In the ‘K’ column, record everything you already know about the topic. Don’t worry about how important or minor the points seem at this stage; the goal is to get all your pre-existing knowledge down.
Step 6: Fill in the ‘W’ Column
Next, move on to the ‘W’ column. Here, write down everything you want to know or are wondering about the topic. These could be questions, aspects you’re interested in, or areas you’re confused about.
Step 7: Engage with the Learning Material
Now it’s time to study, research, or engage with your topic. Use your ‘W’ column as a guide for what to focus on, but also stay open to learning new aspects that you hadn’t considered.
Step 8: Fill in the ‘L’ Column
After you’ve completed your study or project, fill in the ‘L’ column. This should include new information you’ve learned, answers to your ‘W’ column questions, and insights you’ve gained. Reflect on how this new knowledge connects to what you knew and what you wanted to find out.
Step 9: Review and Reflect
Finally, review your chart. Reflect on your learning journey, how your understanding of the topic has changed, and any new questions or interest areas that have arisen. This step can also involve sharing and discussing your chart with others.
KWL Chart Example
Topic: The Solar System
K (What We Know):
- The solar system consists of the sun and everything that orbits around it, including planets, moons, asteroids, comets, and meteoroids.
- There are eight known planets.
- The Earth is the third planet from the sun.
- The moon orbits around the Earth.
W (What We Want to Know):
- What are the names of all the planets in our solar system?
- How does the sun’s gravity keep the planets in orbit?
- What is the difference between asteroids, comets, and meteoroids?
- How do moons differ from planets?
- What is the largest planet in our solar system?
L (What We’ve Learned): (this would be filled out after studying the unit)
- The eight planets in our solar system are Mercury, Venus, Earth, Mars, Jupiter, Saturn, Uranus, and Neptune.
- The sun’s gravity pulls on the planets, keeping them in their orbits. The strength of the gravitational force depends on the mass of the objects and the distance between them.
- Asteroids are rocky bodies that orbit the sun, mostly found in the asteroid belt between Mars and Jupiter. Comets are icy bodies that have highly elliptical orbits, while meteoroids are small rocky or metallic bodies in outer space.
- Moons are natural satellites that orbit a planet, while planets orbit a star like the sun. Moons vary greatly in size and composition.
- The largest planet in our solar system is Jupiter.
Conclusion
In conclusion, a KWL Chart is an incredibly versatile educational tool that fosters active engagement, guides the learning journey, and encourages reflective practice. Its simplicity belies its power in helping learners, whether in groups or individually, navigate new knowledge landscapes. By systematically documenting what is already known, what needs to be discovered, and finally, what has been learned, the KWL Chart seamlessly bridges the gap between prior knowledge and new learning. More than a mere chart, it’s a strategic roadmap for effective learning, making it an invaluable asset in any learning environment. Whether you’re a student, a teacher, or a lifelong learner, harnessing the potential of the KWL Chart can undoubtedly enhance your educational endeavors.
FAQs
Are there any variations or adaptations of the KWL Chart?
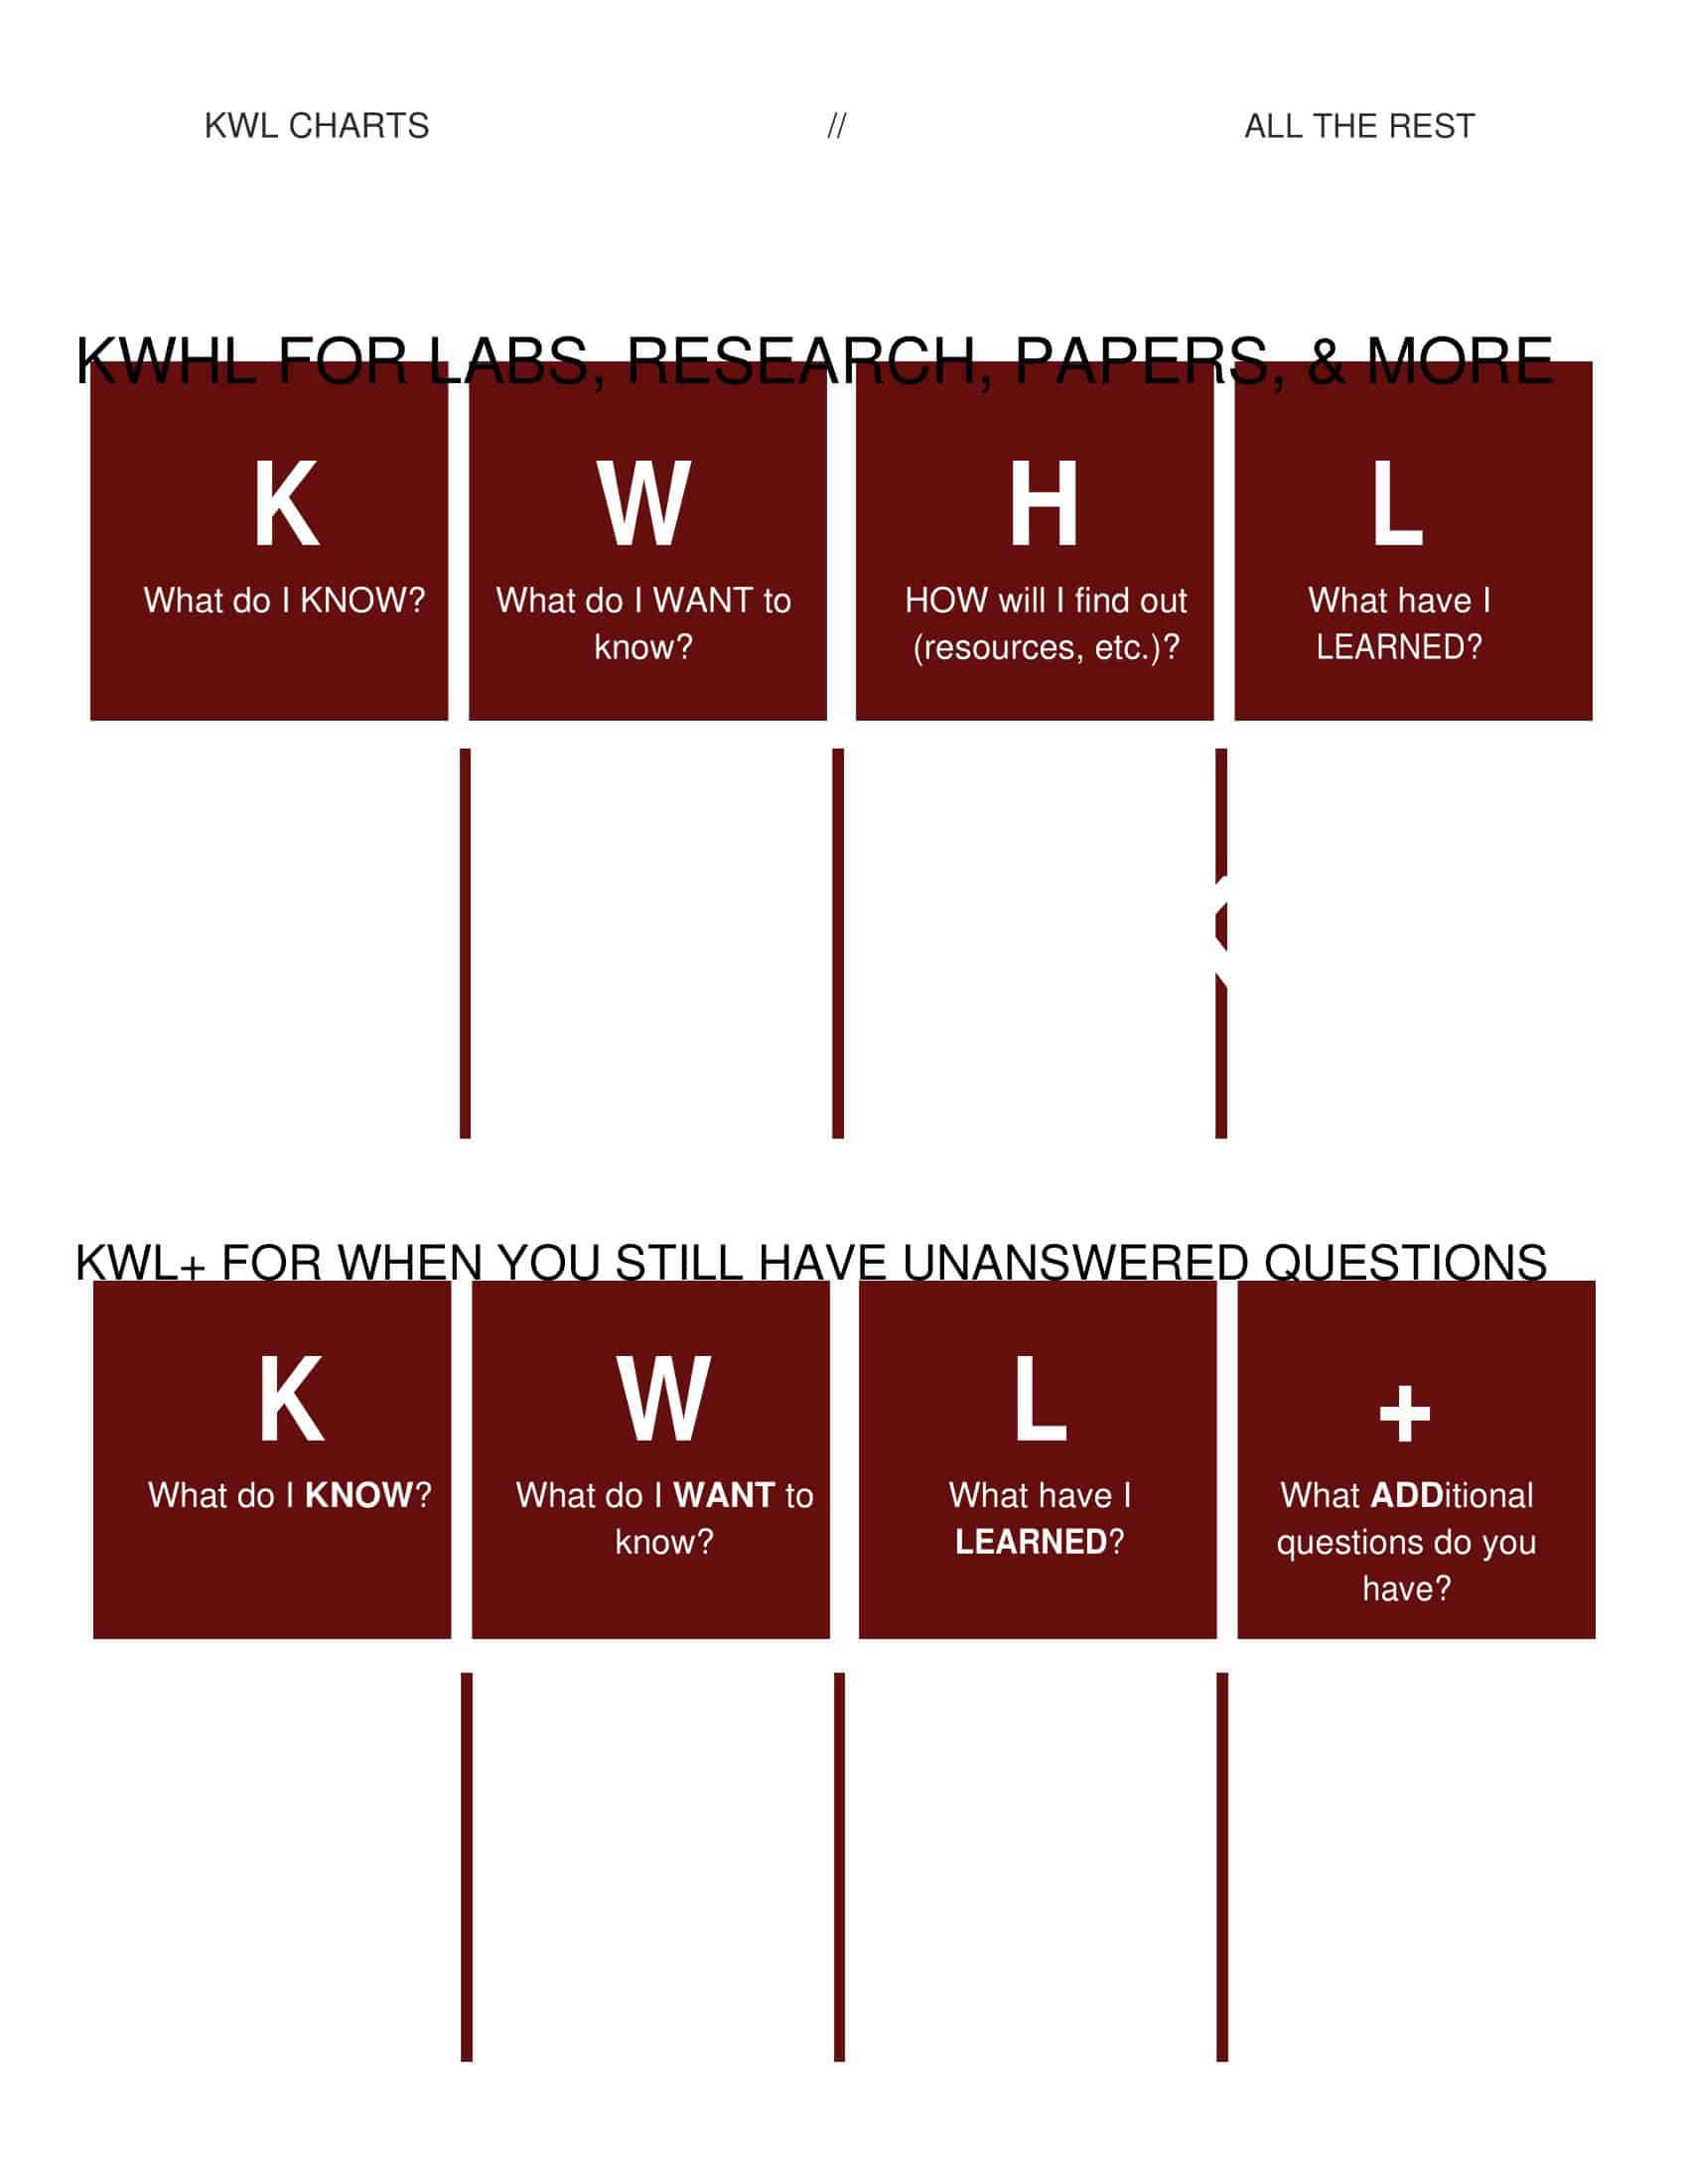
Yes, there are variations and adaptations of the KWL Chart. Some educators modify it to include an “H” column for “How I can Learn more” or an “S” column for “Sources.” Others use digital versions of the chart or incorporate technology tools to enhance the experience.
Can a KWL Chart be used beyond the classroom?
Yes, a KWL Chart can be a useful tool outside of the classroom as well. It can be utilized for personal research, planning projects, or exploring new topics of interest. The structure of the chart helps individuals organize their thoughts and guide their learning process.
Can a KWL Chart be used for any subject or topic?
Yes, a KWL Chart can be used for any subject or topic. It is a versatile tool that can be applied to various academic subjects such as science, history, literature, and math, as well as for personal research or exploration of non-academic topics.
At what grade level is a KWL Chart typically used?
A KWL Chart can be used across various grade levels, from elementary school to high school and even in higher education. The complexity of the chart and the level of student engagement may vary based on the age and grade level of the students.
How does a KWL Chart promote critical thinking and inquiry skills?
A KWL Chart promotes critical thinking and inquiry skills by encouraging students to generate questions about the topic they are studying. It prompts them to think deeply, analyze information gaps, and seek answers through further research or investigation.
Can a KWL Chart be used in collaborative group work?
Yes, a KWL Chart can be used in collaborative group work. It can be a valuable tool for students to brainstorm and share their collective knowledge and questions. Each group member can contribute to the chart and engage in discussions to explore the topic more comprehensively.
How can teachers assess student learning using a KWL Chart?
Teachers can assess student learning using a KWL Chart by reviewing the information recorded in the “L” column, which highlights what students have learned. Teachers can analyze the depth of understanding, identify misconceptions, and provide feedback or additional guidance based on the students’ reflections.
Are there any digital tools or software available for creating KWL Charts?
Yes, there are several digital tools and software available for creating KWL Charts. Some popular options include online graphic organizers like Canva, Google Docs or Slides, Microsoft PowerPoint or Word, or specialized educational platforms that offer customizable templates for KWL Charts.
Can a KWL Chart be used as a formative assessment tool?
Yes, a KWL Chart can be used as a formative assessment tool. By examining students’ responses in the “K” and “W” columns, teachers can assess their prior knowledge and identify knowledge gaps or misconceptions. This information can guide instructional planning and differentiate teaching strategies.
Is a KWL Chart only useful at the beginning and end of a unit?
While a KWL Chart is commonly used at the beginning of a unit to activate prior knowledge and at the end to summarize learning, it can also be used as an ongoing tool throughout a unit. Students can update the chart as they progress, adding new questions and information as they delve deeper into the topic.
Can a KWL Chart be adapted for individual learning styles or preferences?
Yes, a KWL Chart can be adapted for individual learning styles or preferences. For example, visual learners might prefer using colors, symbols, or illustrations in their charts. Auditory learners can discuss their responses verbally or record audio notes. Kinesthetic learners may benefit from creating physical or interactive charts.
Are there any alternatives to a KWL Chart for organizing prior knowledge and learning goals?
Yes, there are alternative graphic organizers that serve a similar purpose to a KWL Chart. Some alternatives include the KWHL Chart (adding an “H” for “How I will find the information”), the PMI Chart (Plus, Minus, Interesting), or concept maps and mind maps. These tools can be used based on the specific learning objectives and preferences of the teacher or students.


![Free Printable Pie Chart Templates [Excel, PDF, Word] Maker 1 Pie Chart](https://www.typecalendar.com/wp-content/uploads/2023/06/Pie-Chart-150x150.jpg 150w, https://www.typecalendar.com/wp-content/uploads/2023/06/Pie-Chart-1200x1200.jpg 1200w)
![Free Printable Roommate Agreement Templates [Word, PDF] 2 Roommate Agreement](https://www.typecalendar.com/wp-content/uploads/2023/06/Roommate-Agreement-150x150.jpg)
![Free Printable Credit Card Authorization Form Templates [PDF, Word, Excel] 3 Credit Card Authorization Form](https://www.typecalendar.com/wp-content/uploads/2023/06/Credit-Card-Authorization-Form-150x150.jpg)
