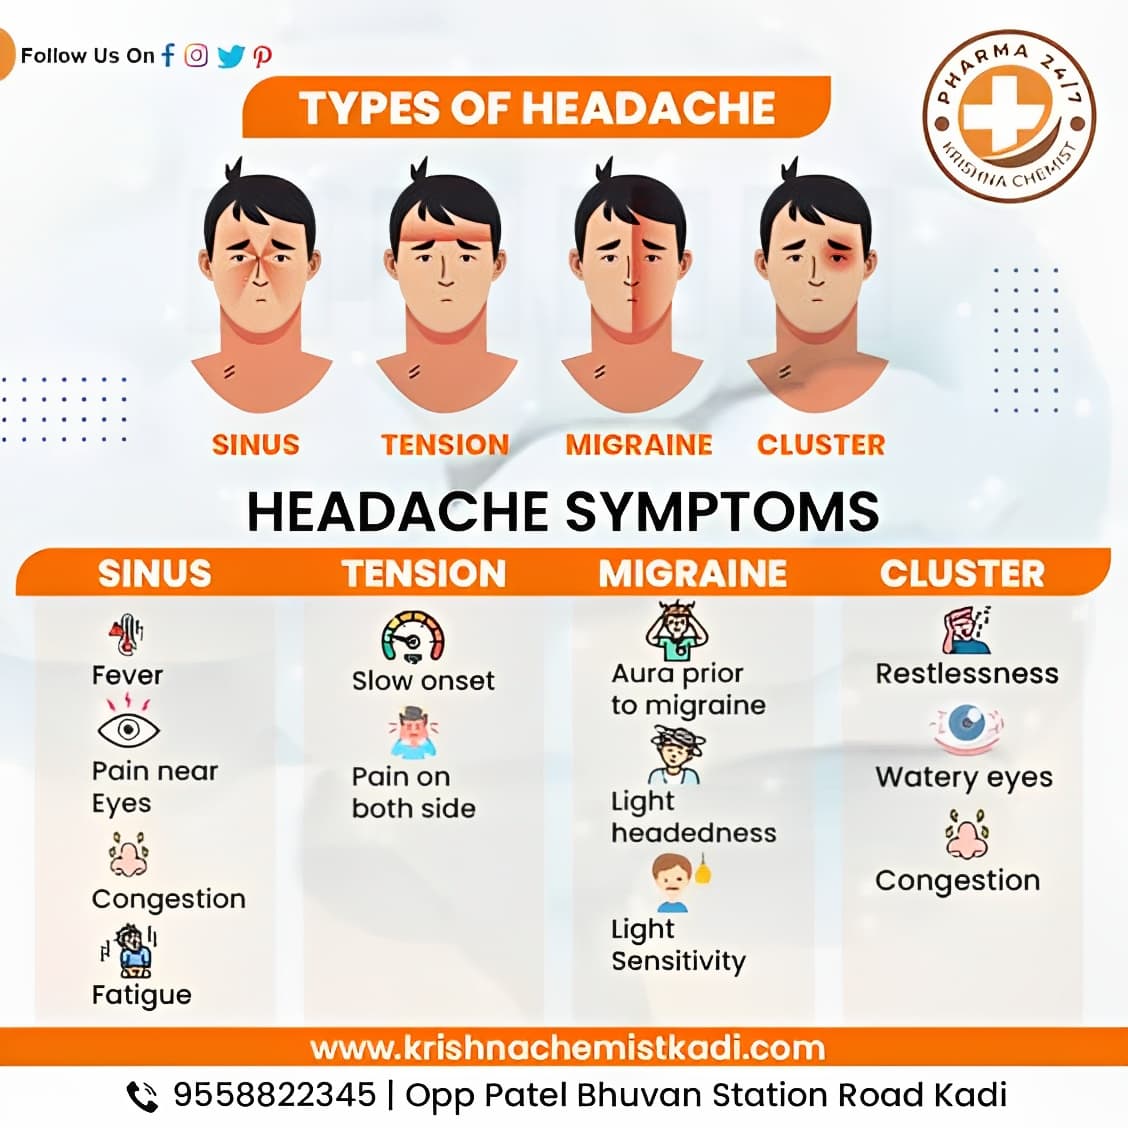
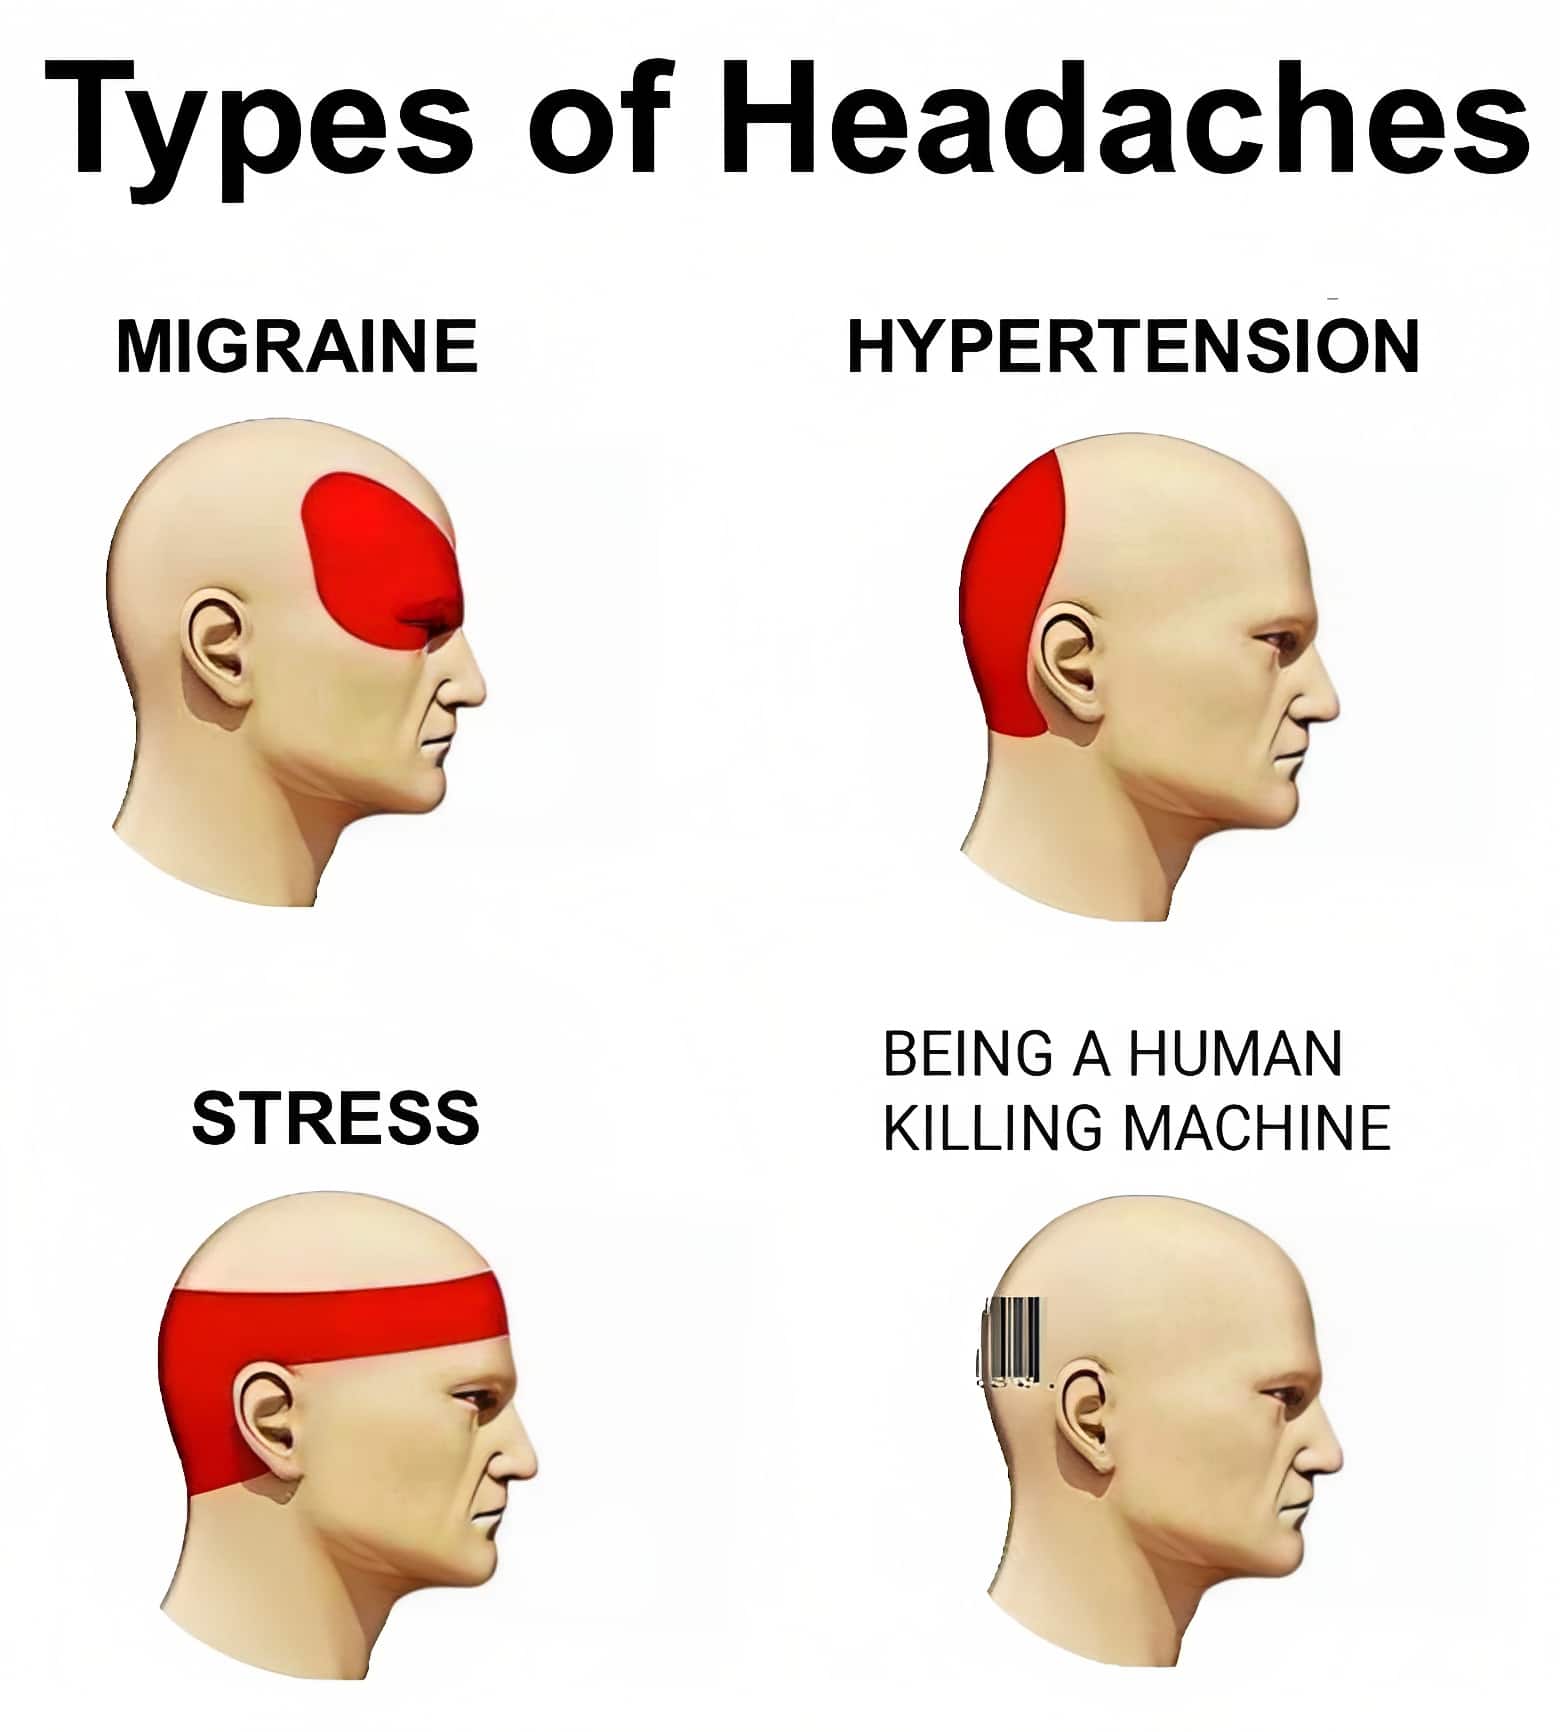
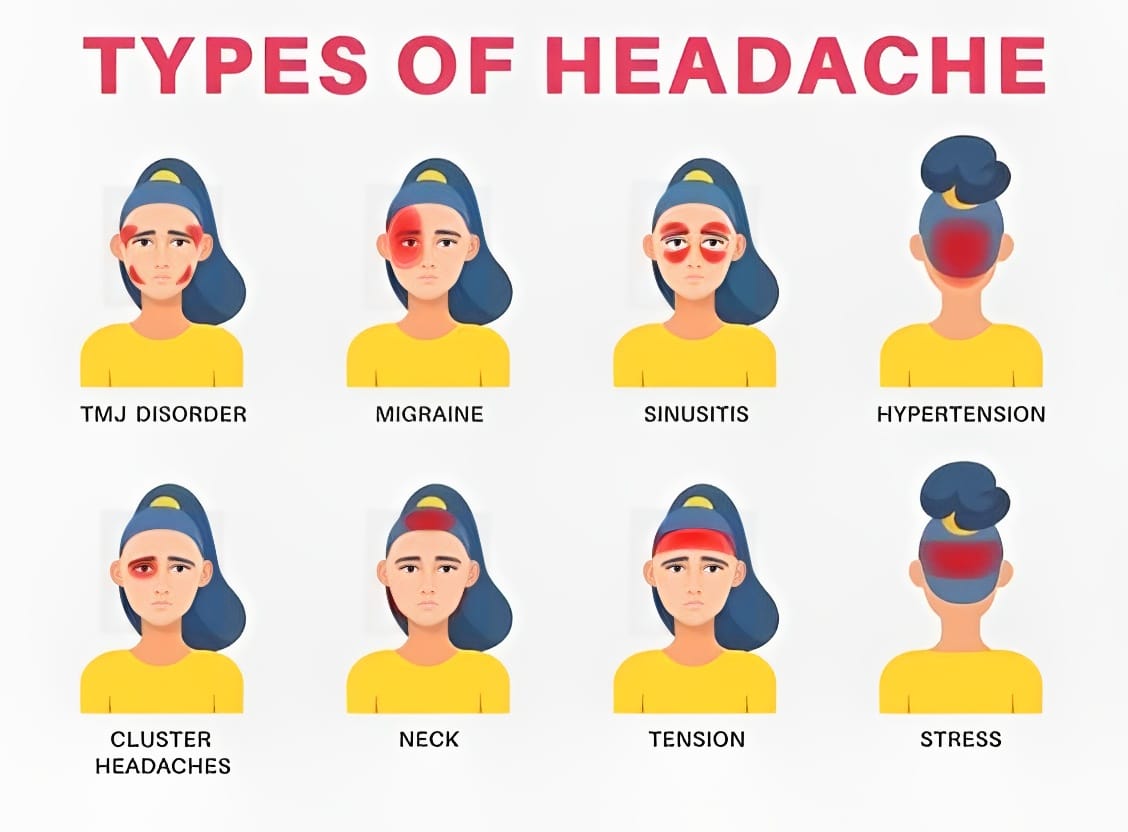
It’s hard to capture a migraine that erupts midday in a single sentence. However, a well‑designed headache chart makes the type, severity, duration, and accompanying symptoms visible at a glance. For anyone keeping a diary, the “Headache Diary” captures the details. The chart acts as a “snapshot” for clinic visits, for informing a teacher, or for reviewing a medication plan. That’s why TypeCalendar offers more than 30 printable headache chart templates prepared for different use cases, free of charge and watermark‑free.
Table of Contents
What Does a Headache Chart Do and How Does It Help?

The chart presents data in blocks that you can scan at a glance rather than wading through sentences. Time of onset, peak, and decline curve; level on a 0–10 pain‑intensity scale; pain qualities (“pulsing,” “throbbing,” “pressure”); and accompanying symptoms (light or sound sensitivity, nausea, aura). When everything appears on a single page, the patient can spot trigger patterns more easily, and the physician can grasp the data quickly. Suppose your pain spikes three times a week around 10:00 a.m. and eases after caffeine. Instead of explaining, just put the printout on the table.
Headache Chart Templates
Types of Headache Chart Templates on TypeCalendar
We organized the collection around three main approaches to meet different needs. Time-based charts show the start and end of pain on a daily or weekly basis with color bands; Ideal for those looking for a “migraine severity chart”. Pages laid out as a symptom/trigger matrix list triggers on the left (insomnia, caffeine, hormonal shifts, barometric pressure) and symptoms across the top; as you mark cells, a heat map emerges.
In kid‑friendly headache chart versions, facial expressions and simple icons replace the 0–10 scale; thus, children ages 7–12 can express themselves easily. In addition, medication‑timing charts show dose time and duration of action on the same line; you can see at a glance which drug provides how many hours of relief.
Formats, Printing Tips, and Ease of Use Guidelines
All templates come in high-resolution PDF and editable Word/Google Docs formats, ready to print;some graphics-based forms are also available in an extra SVG or PNG version with a transparent background.When you print in “Actual Size” on A4 or US Letter sizes on a home printer, the lines are not cropped and the colors do not fade.You can change the color palette to your own style in Word files and add your clinic logo or teacher notes to text boxes. SVGs can be recolorized without losing scale for your reports or presentations, especially advantageous for those who do data visualization. If you plan to laminate, 160 g/m² matte coated paper is both economical in terms of ink and allows you to mark it repeatedly with marker pens.
How to Use a Headache Chart in Daily Life
When you feel a slight throbbing in the morning, mark a small dot on the chart; if the intensity rises in the afternoon, update that day with a darker color or a bold line. When the weekend is over, go back to the page and see if there are any noticeable clusters: Maybe every Monday morning, maybe in conjunction with a change in weather. If your child is holding his head because it “hurts so much”, use the facial expression chart to fill in together which day, which lesson, and how severe it is; print it out in color to show your teacher. Before going to the doctor, converting the graph of the last 14 days into a separate file and sending it via e-mail allows for efficient use of the examination time.
Download Free Headache Chart Templates and Customize the Colors
All Headache Chart templates in TypeCalendar are free, watermark-free and can be downloaded with one click. Choose the format you need, personalize it in minutes, and fill out your first chart today. After a few weeks, as the pages fill up, you’ll see your pain isn’t random but follows a manageable pattern giving you a real advantage in treatment decisions and daily life.


![Free Printable Pie Chart Templates [Excel, PDF, Word] Maker 1 Pie Chart](https://www.typecalendar.com/wp-content/uploads/2023/06/Pie-Chart-150x150.jpg 150w, https://www.typecalendar.com/wp-content/uploads/2023/06/Pie-Chart-1200x1200.jpg 1200w)
![%100 Free Hoodie Templates [Printable] +PDF 2 Hoodie Template](https://www.typecalendar.com/wp-content/uploads/2023/05/Hoodie-Template-1-150x150.jpg)
![Free Printable Reward Chart Templates [Word, PDF] Teachers 3 Reward Chart](https://www.typecalendar.com/wp-content/uploads/2023/03/Reward-Chart-150x150.jpg 150w, https://www.typecalendar.com/wp-content/uploads/2023/03/Reward-Chart-1200x1200.jpg 1200w)
