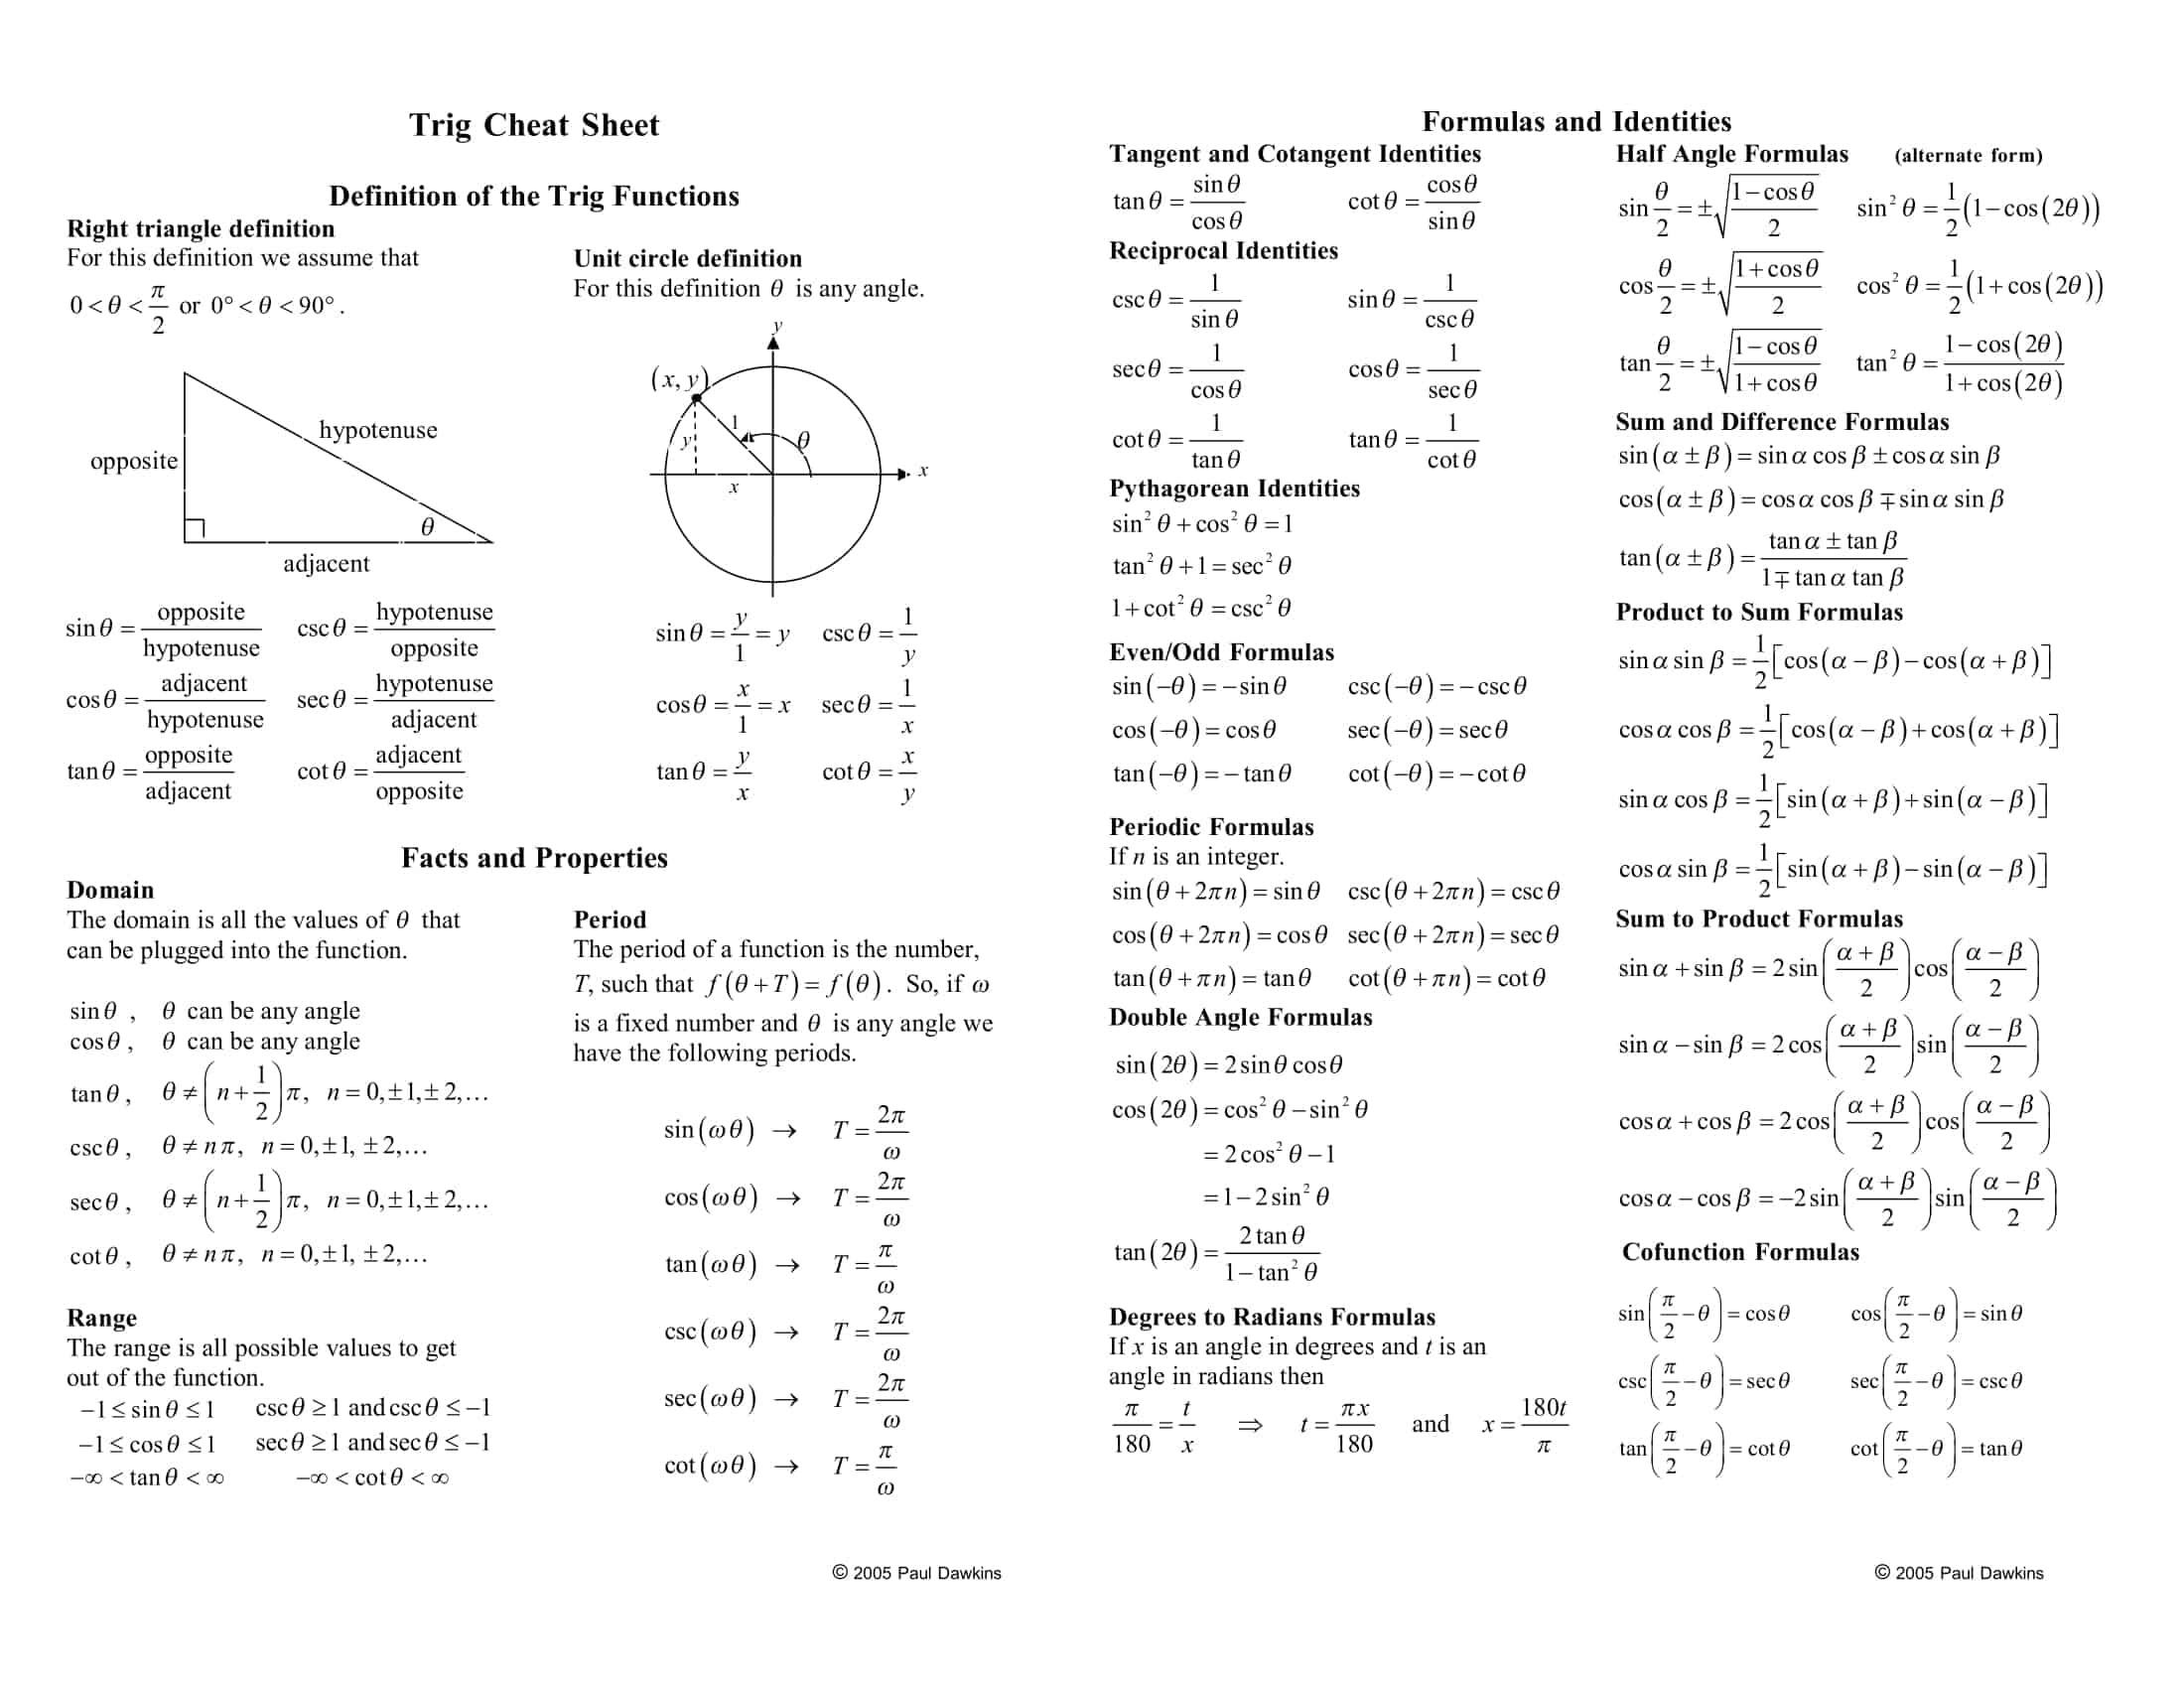
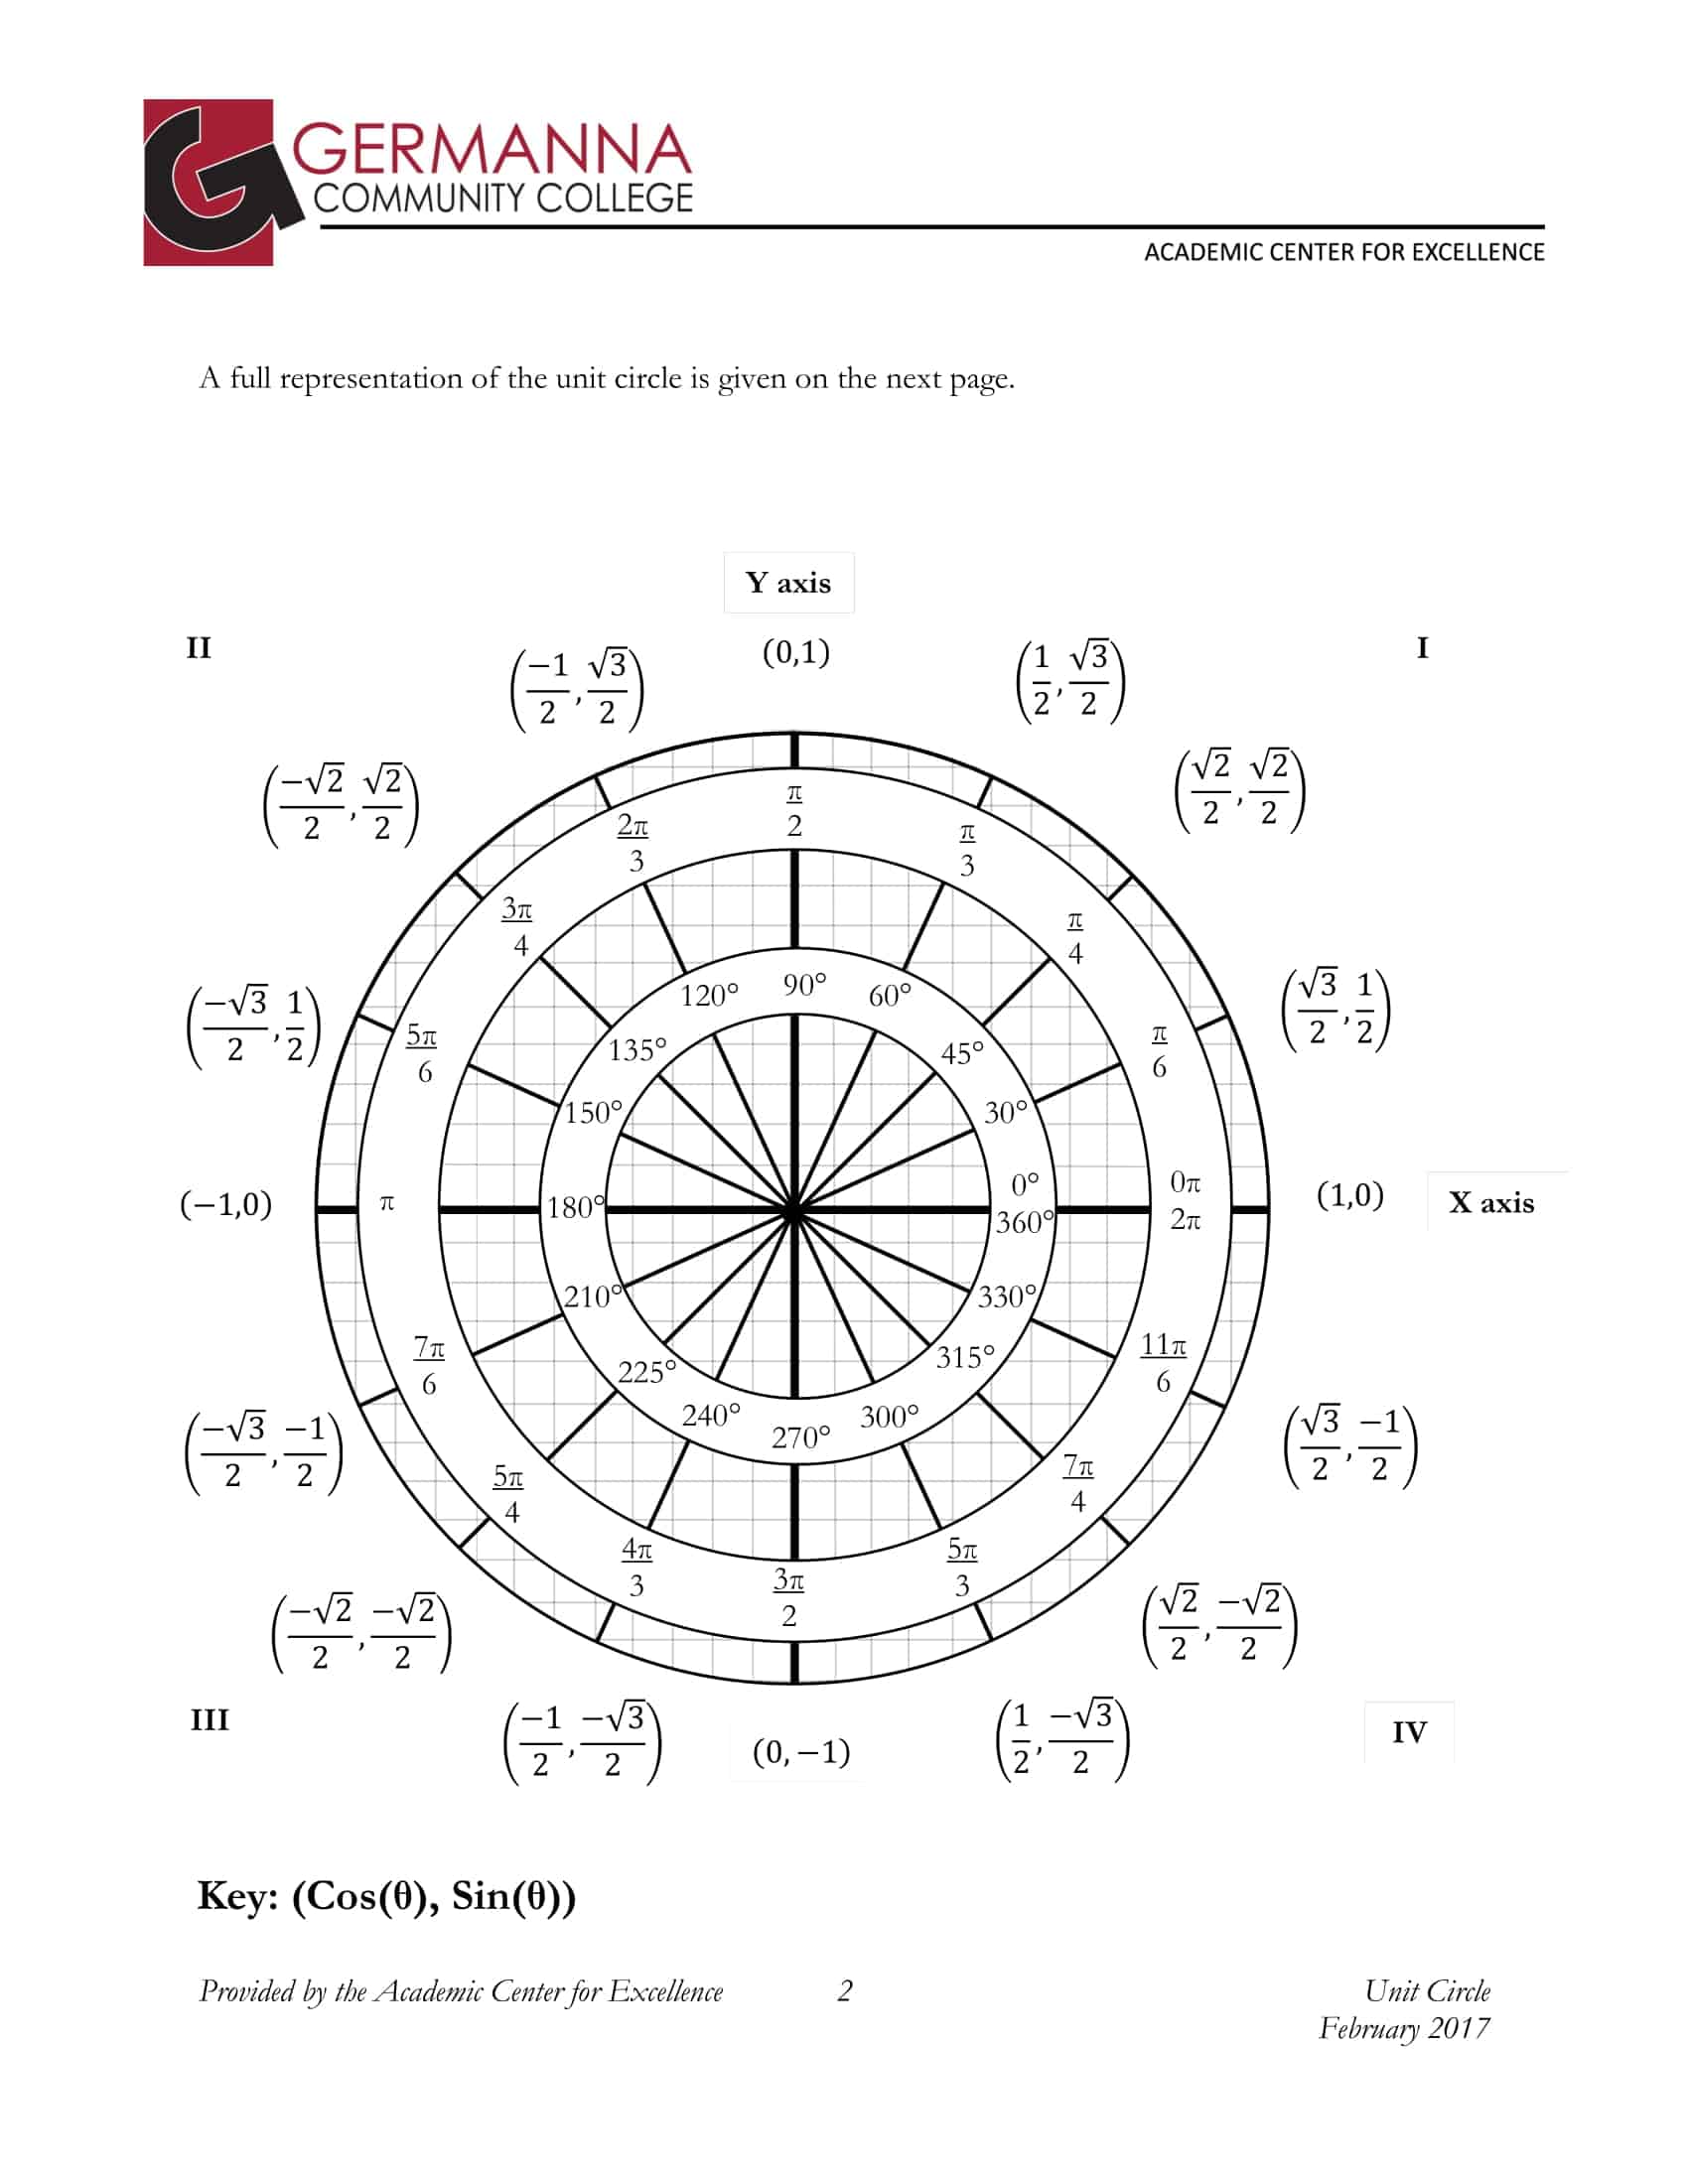
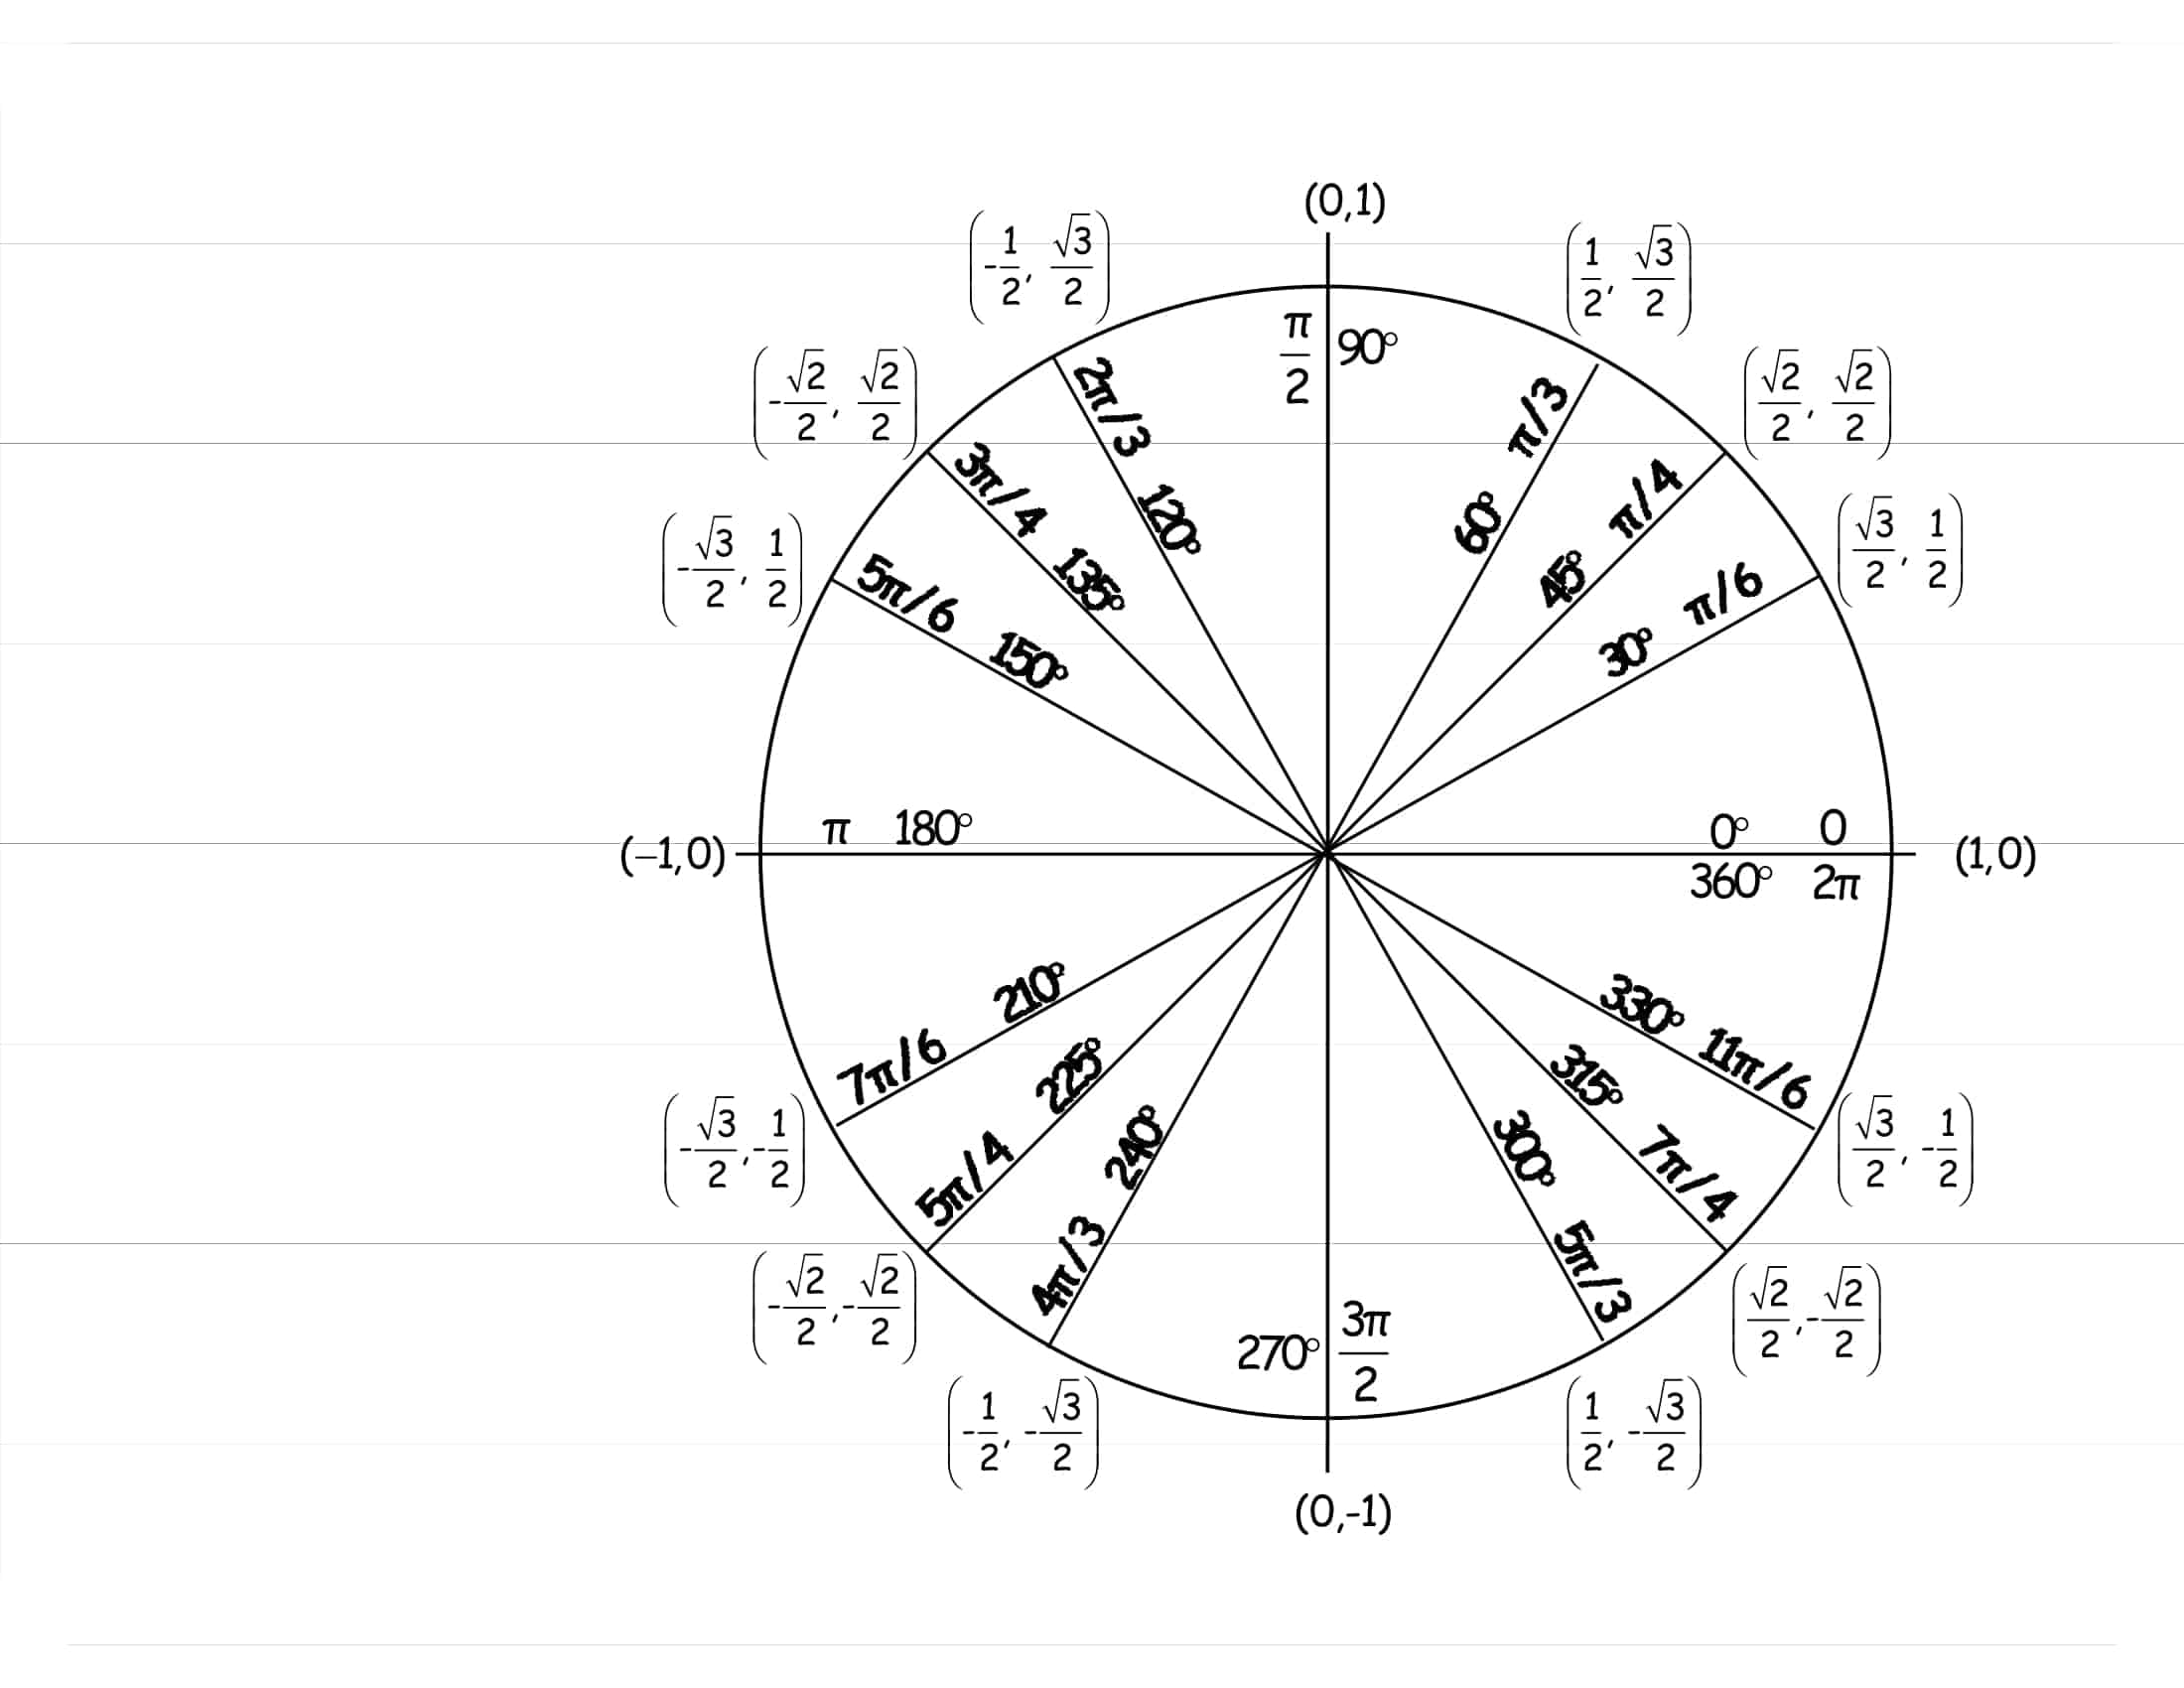
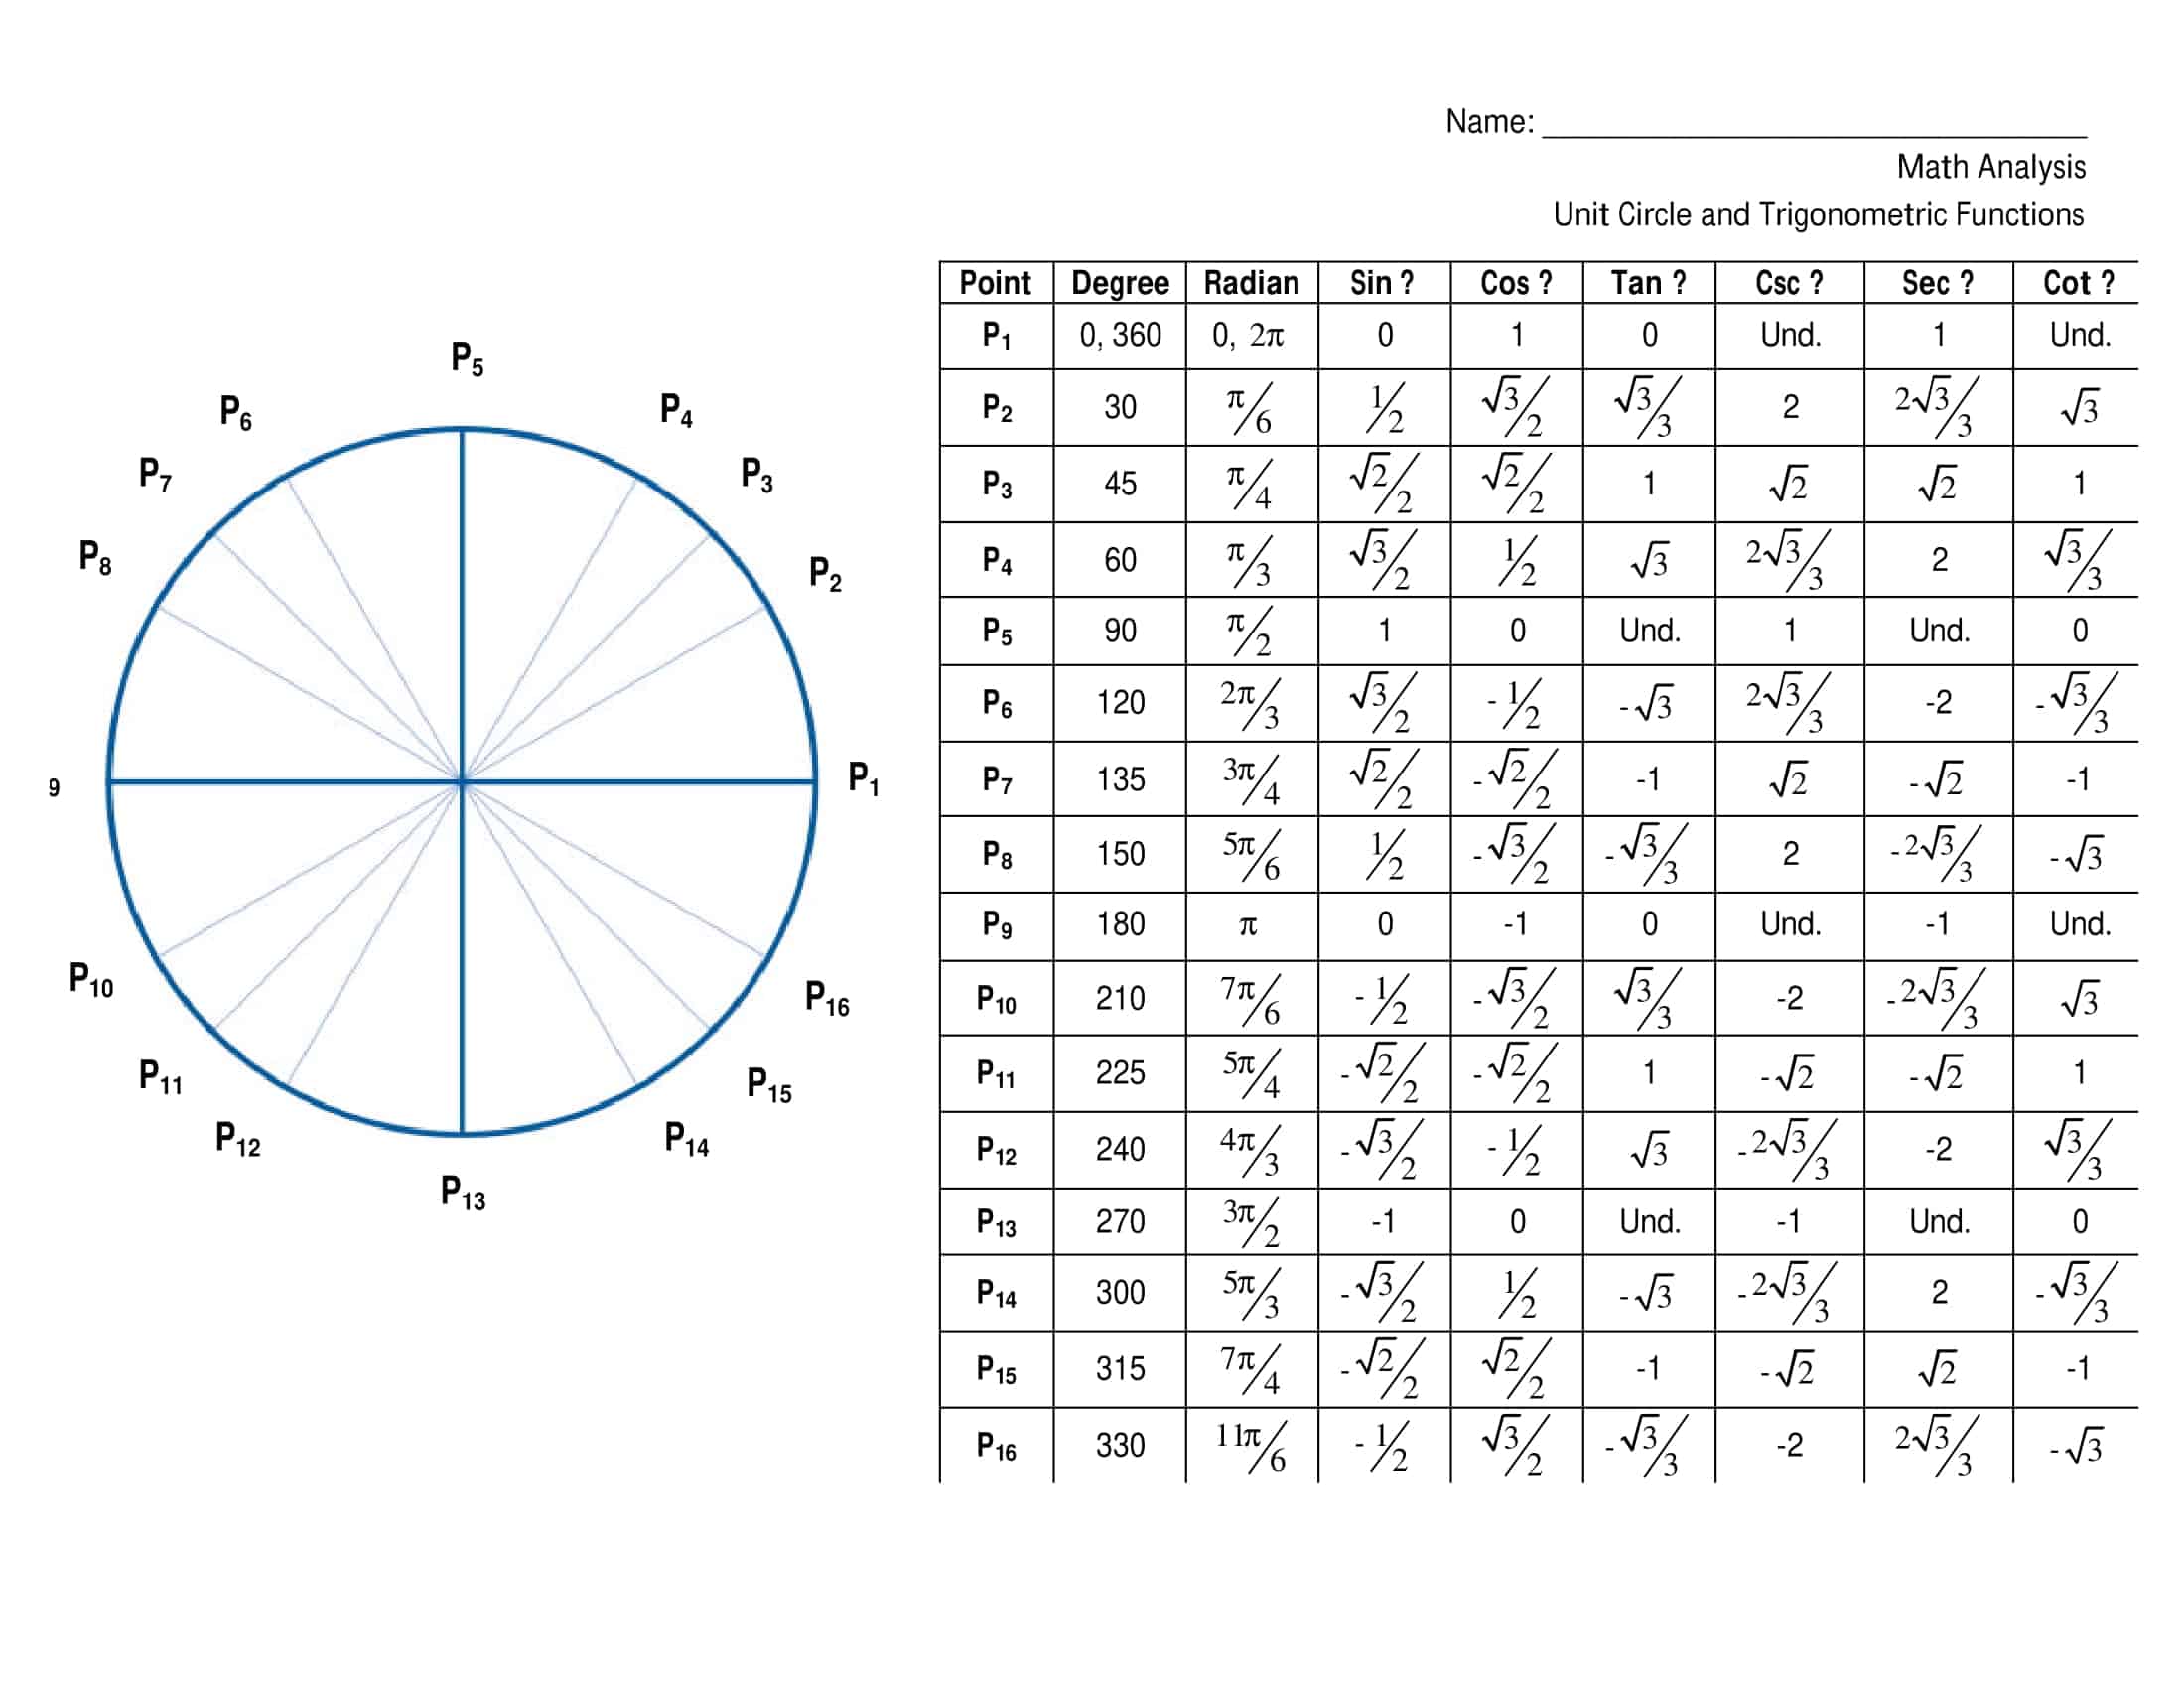
Trying to recall the value of sin 45° during exam day, or locating cos π ⁄ 3 on a table, demands rote memorization. By contrast, a well‑designed unit‑circle chart engages visual memory by displaying every trigonometric ratio at a glance. The coordinates of every point one unit from the origin span both degrees and radians and list sine cosine as well as tangent‑cotangent values. In short, the same diagram answers trigonometry’s “why” and “how.”

Table of Contents
55+ Printable Unit Circle Templates
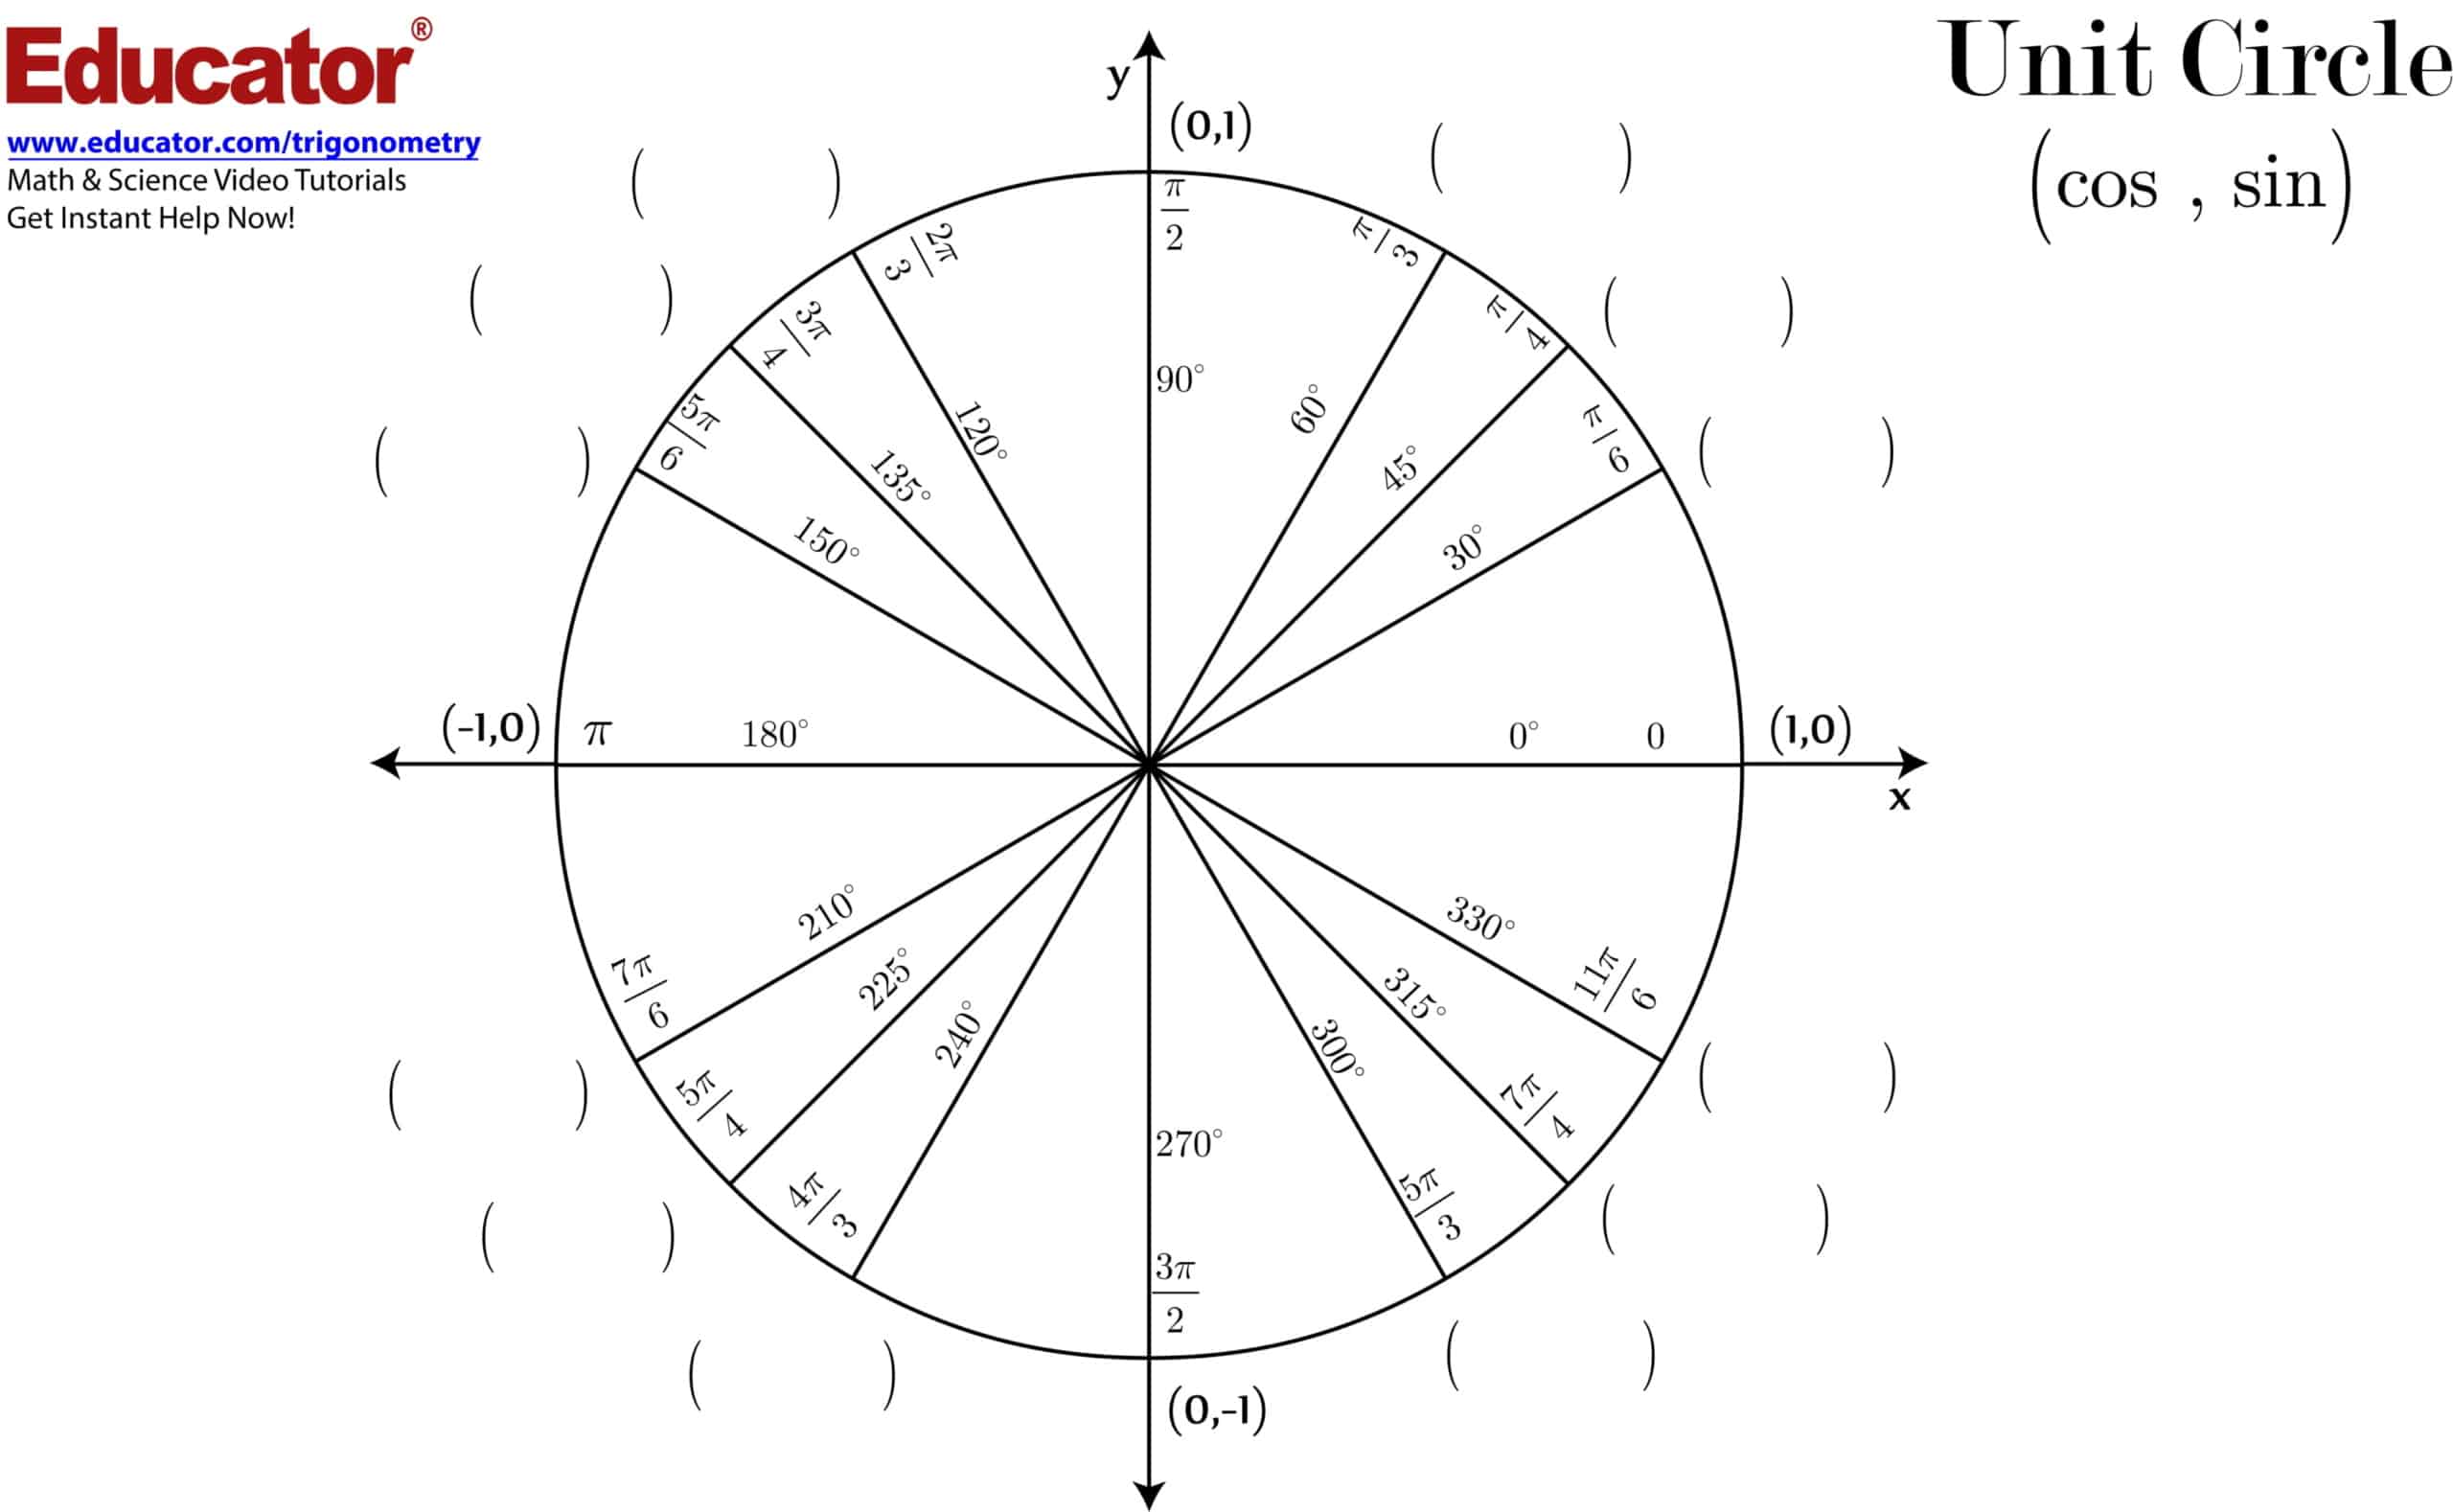
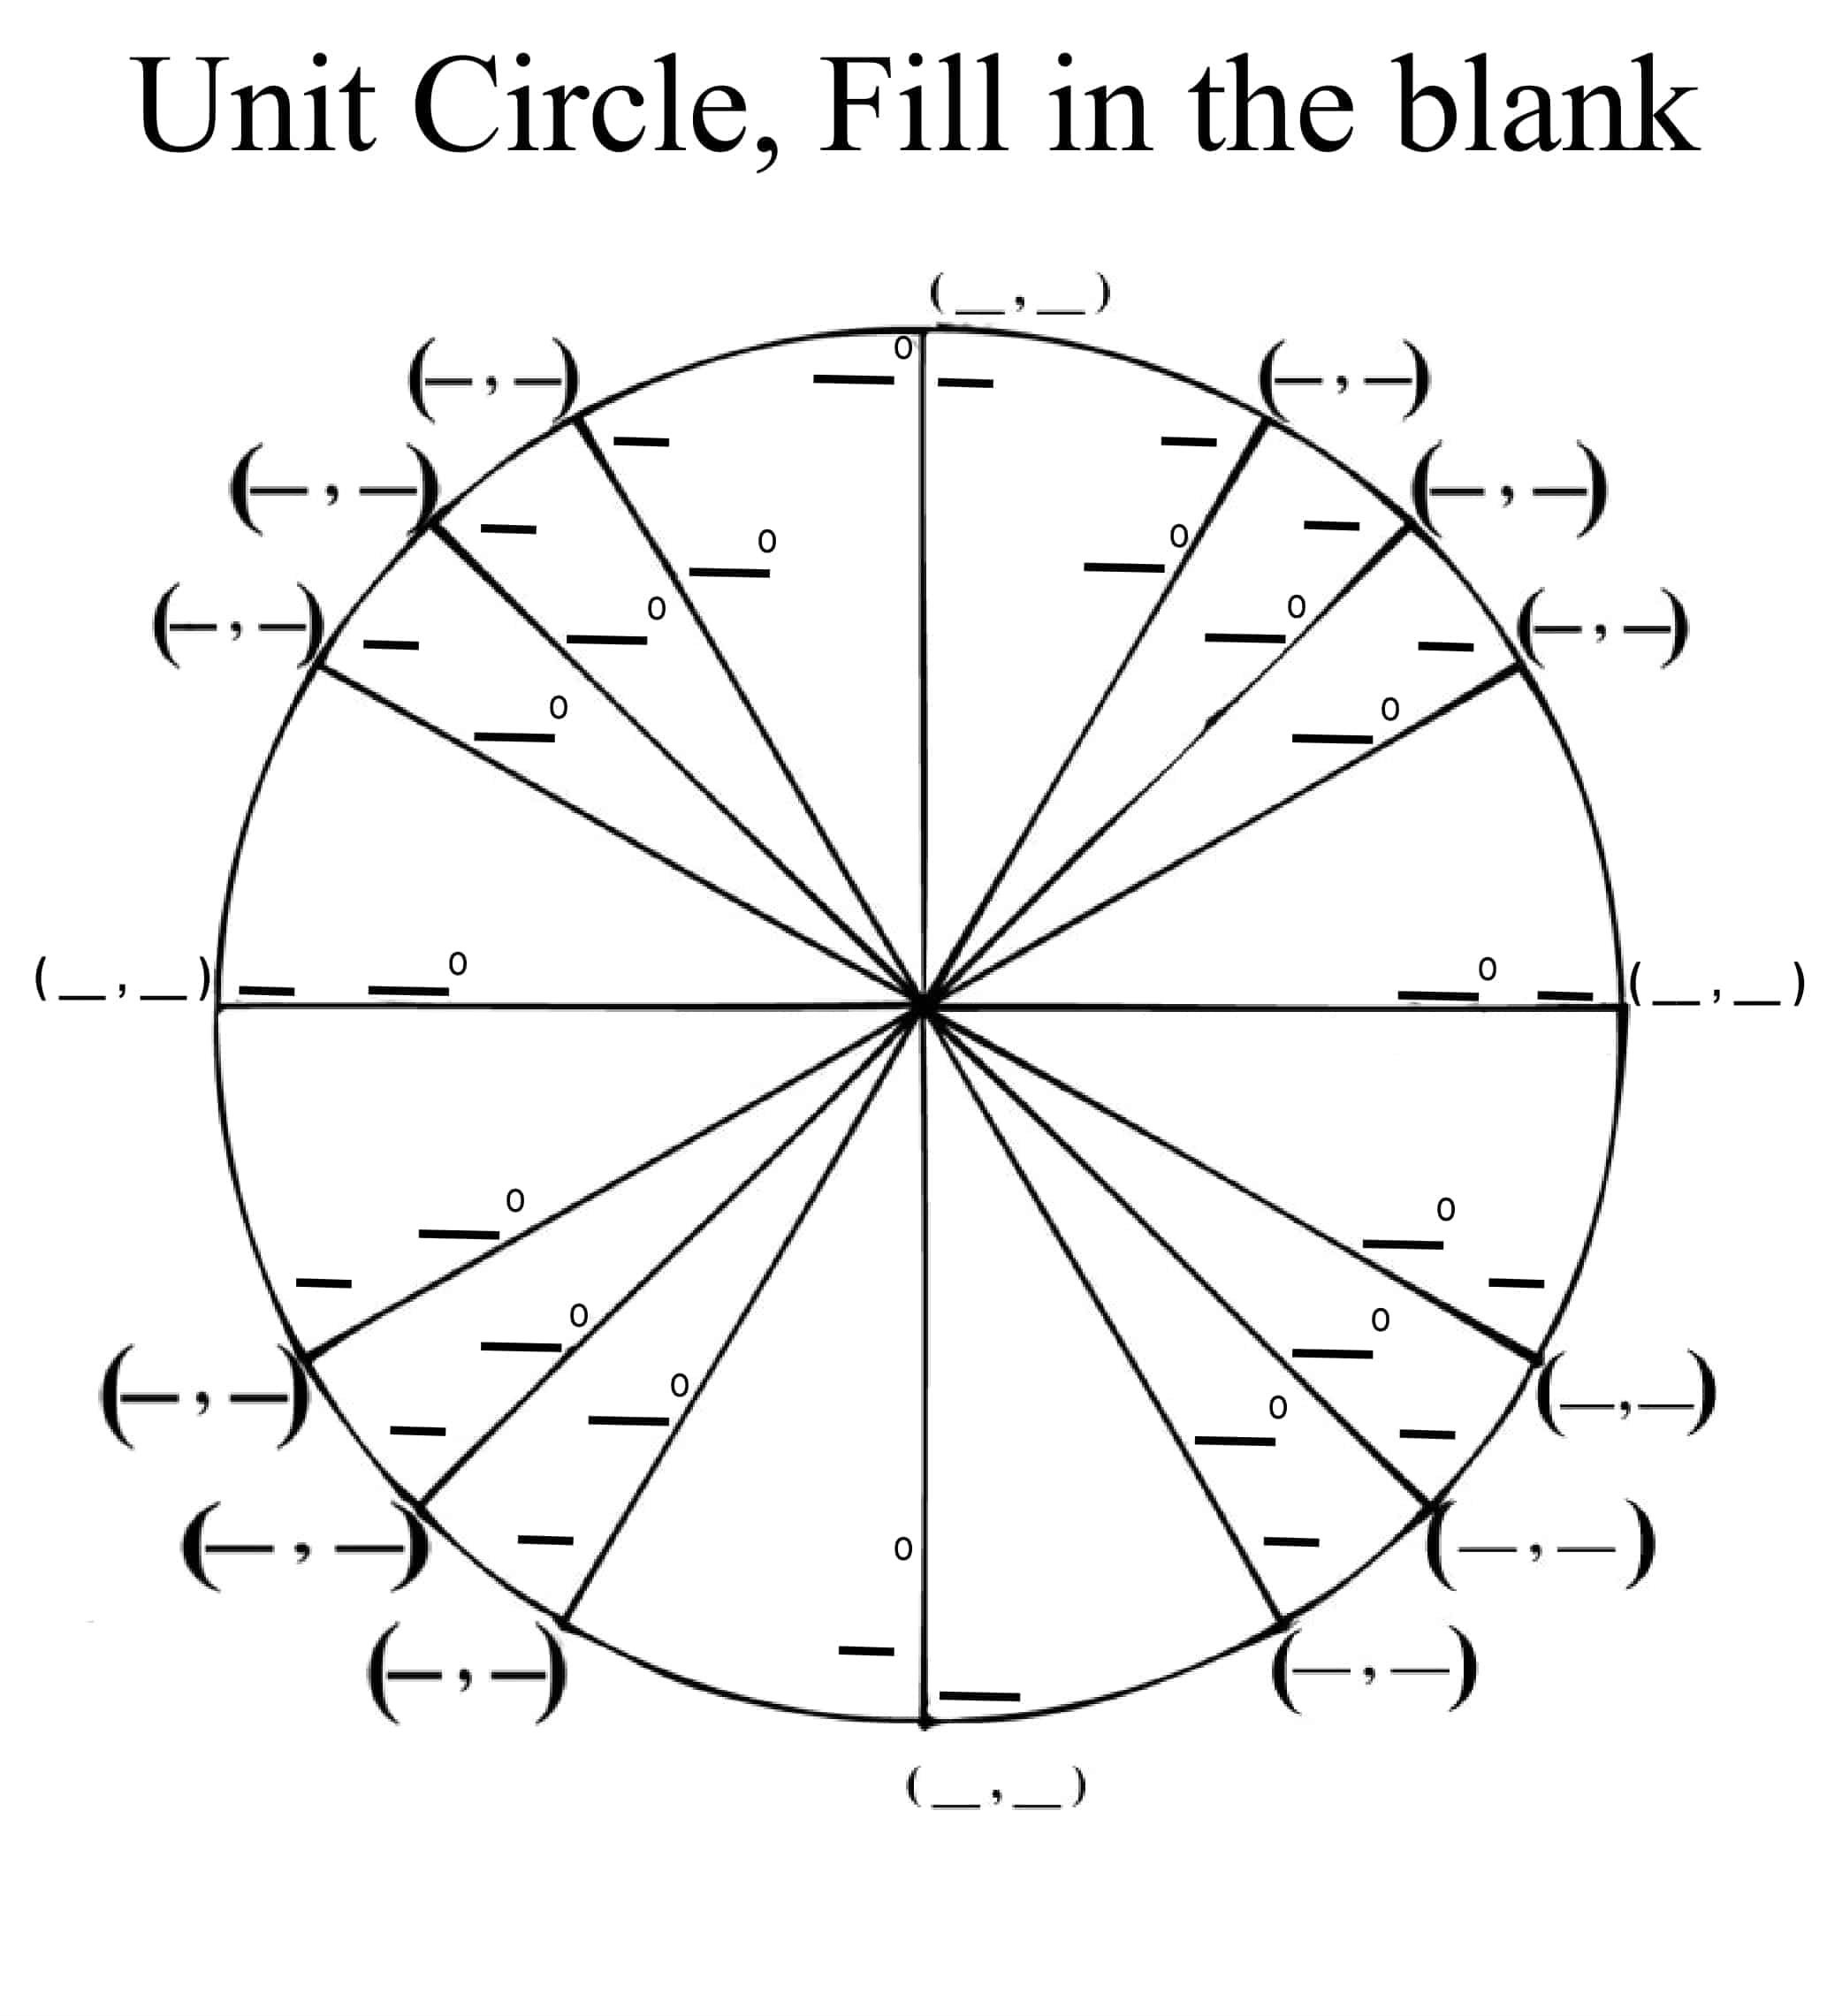
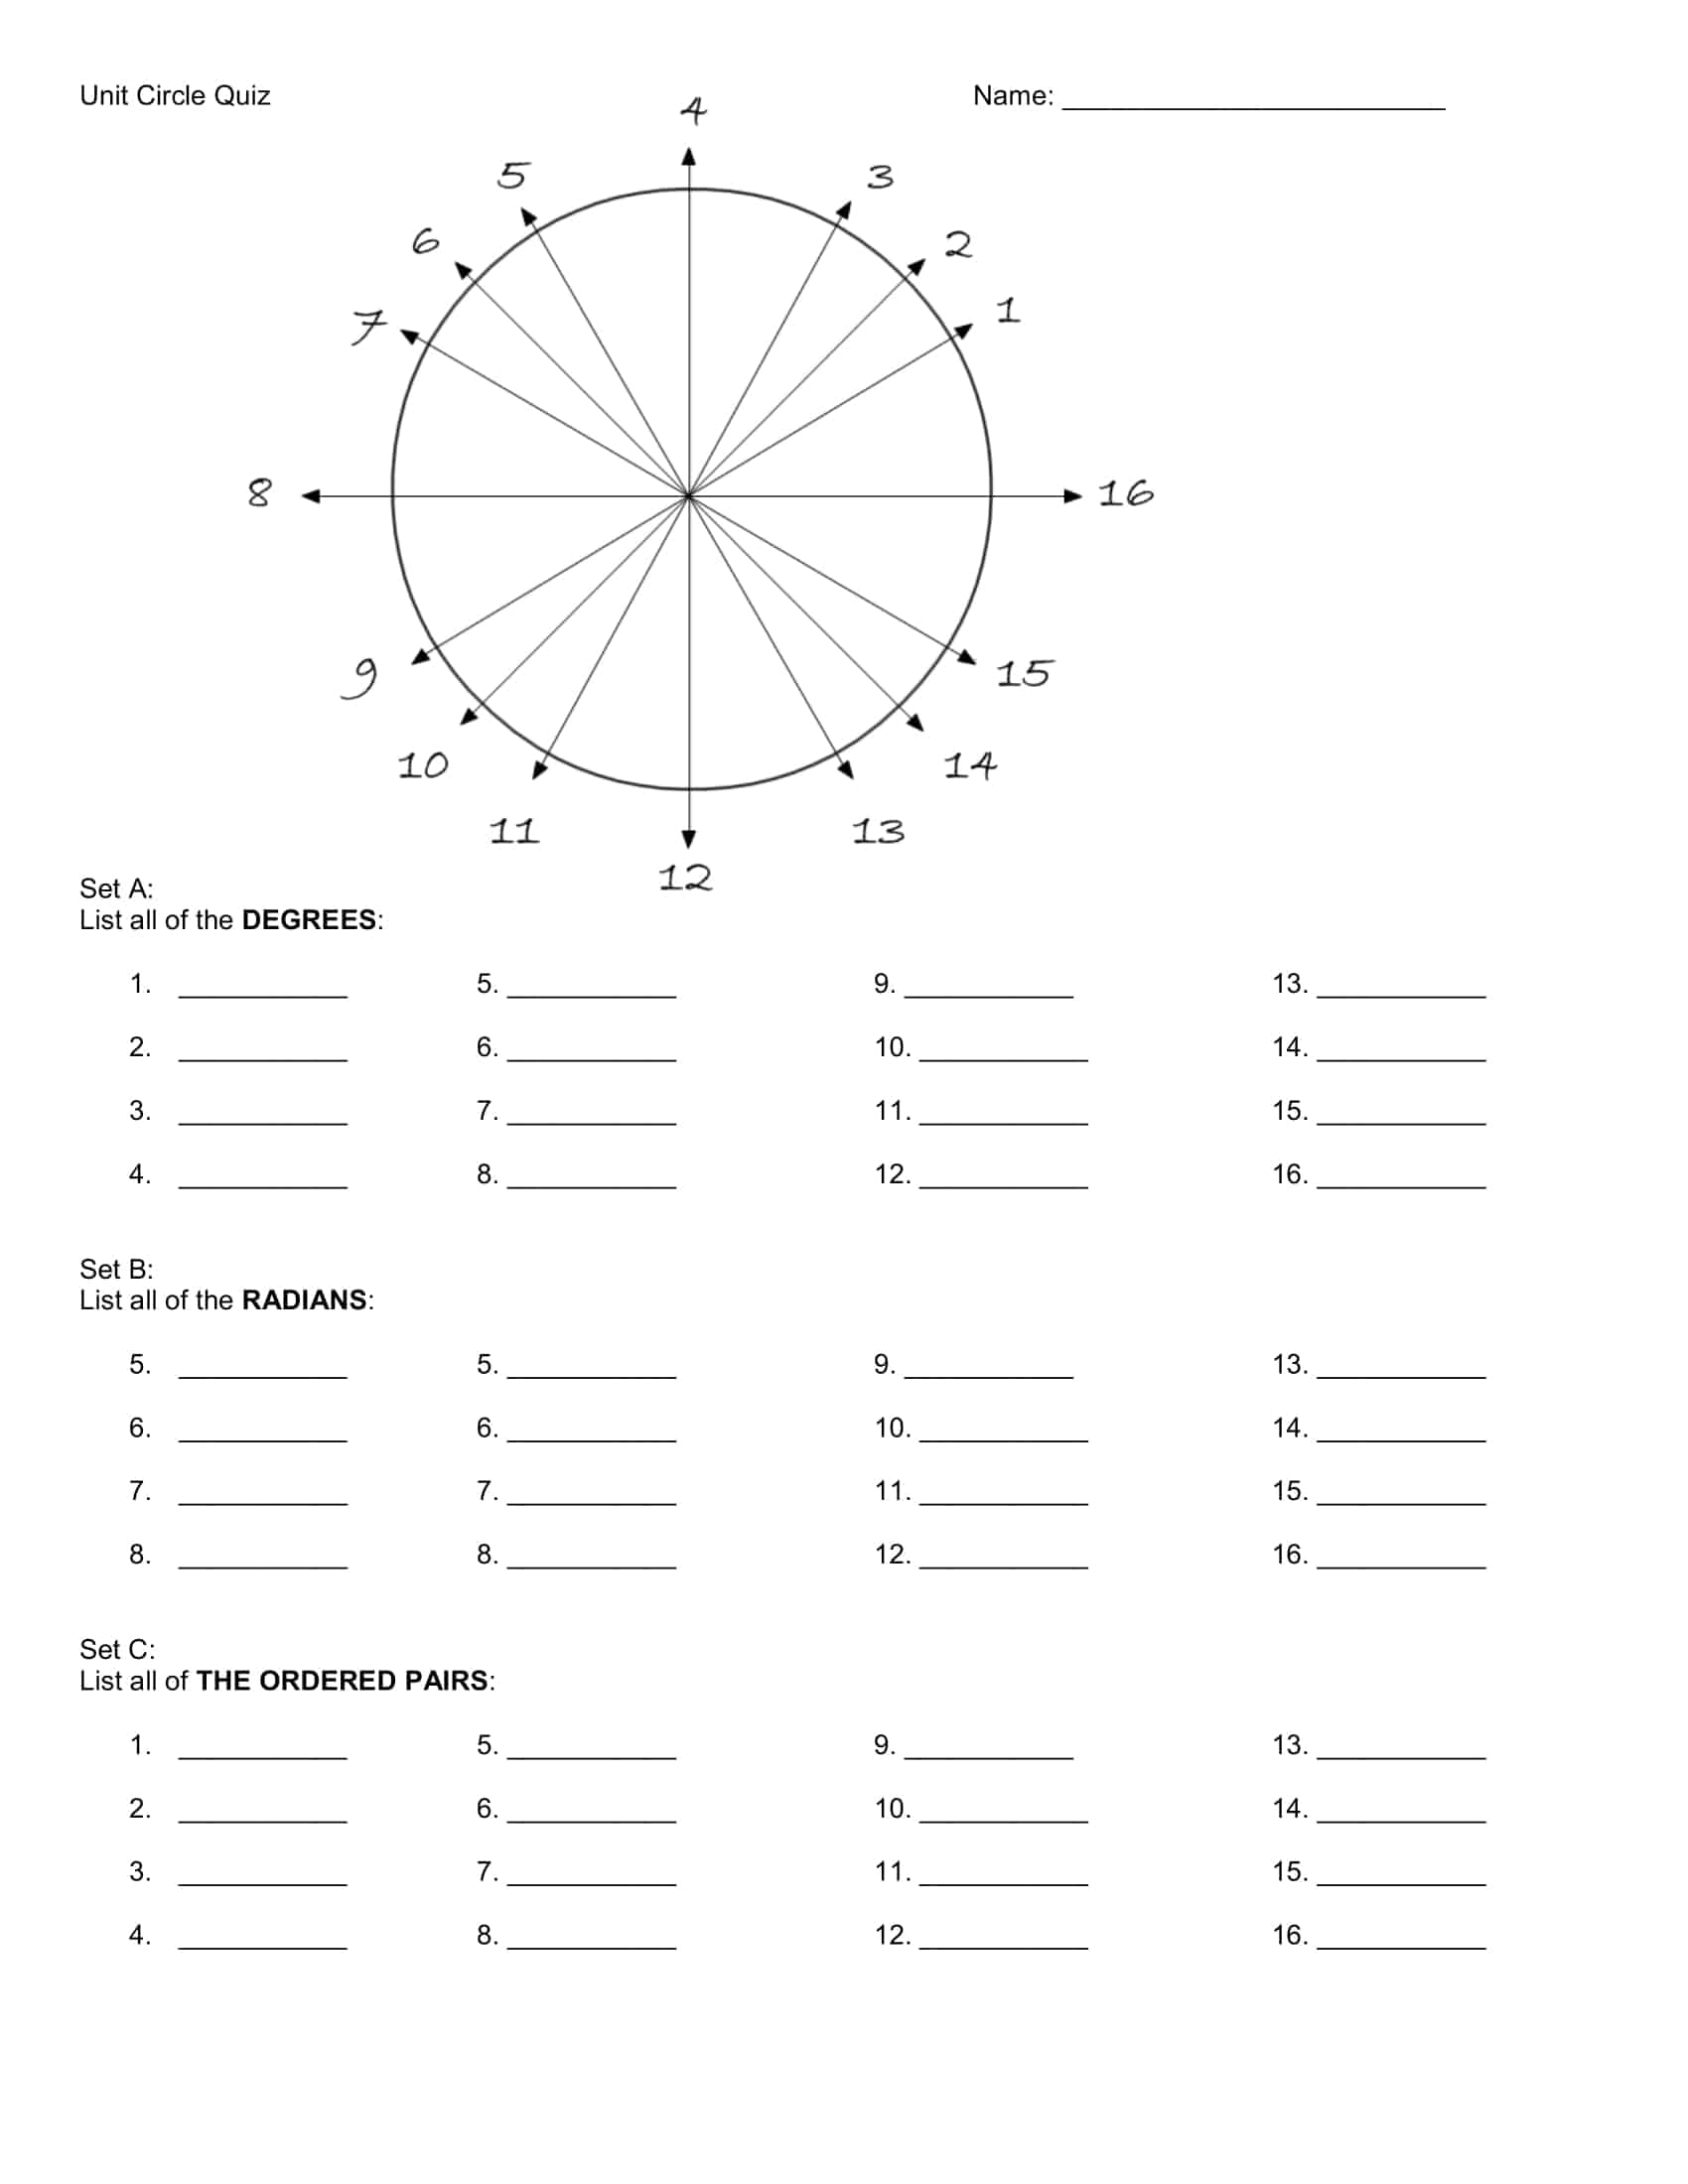
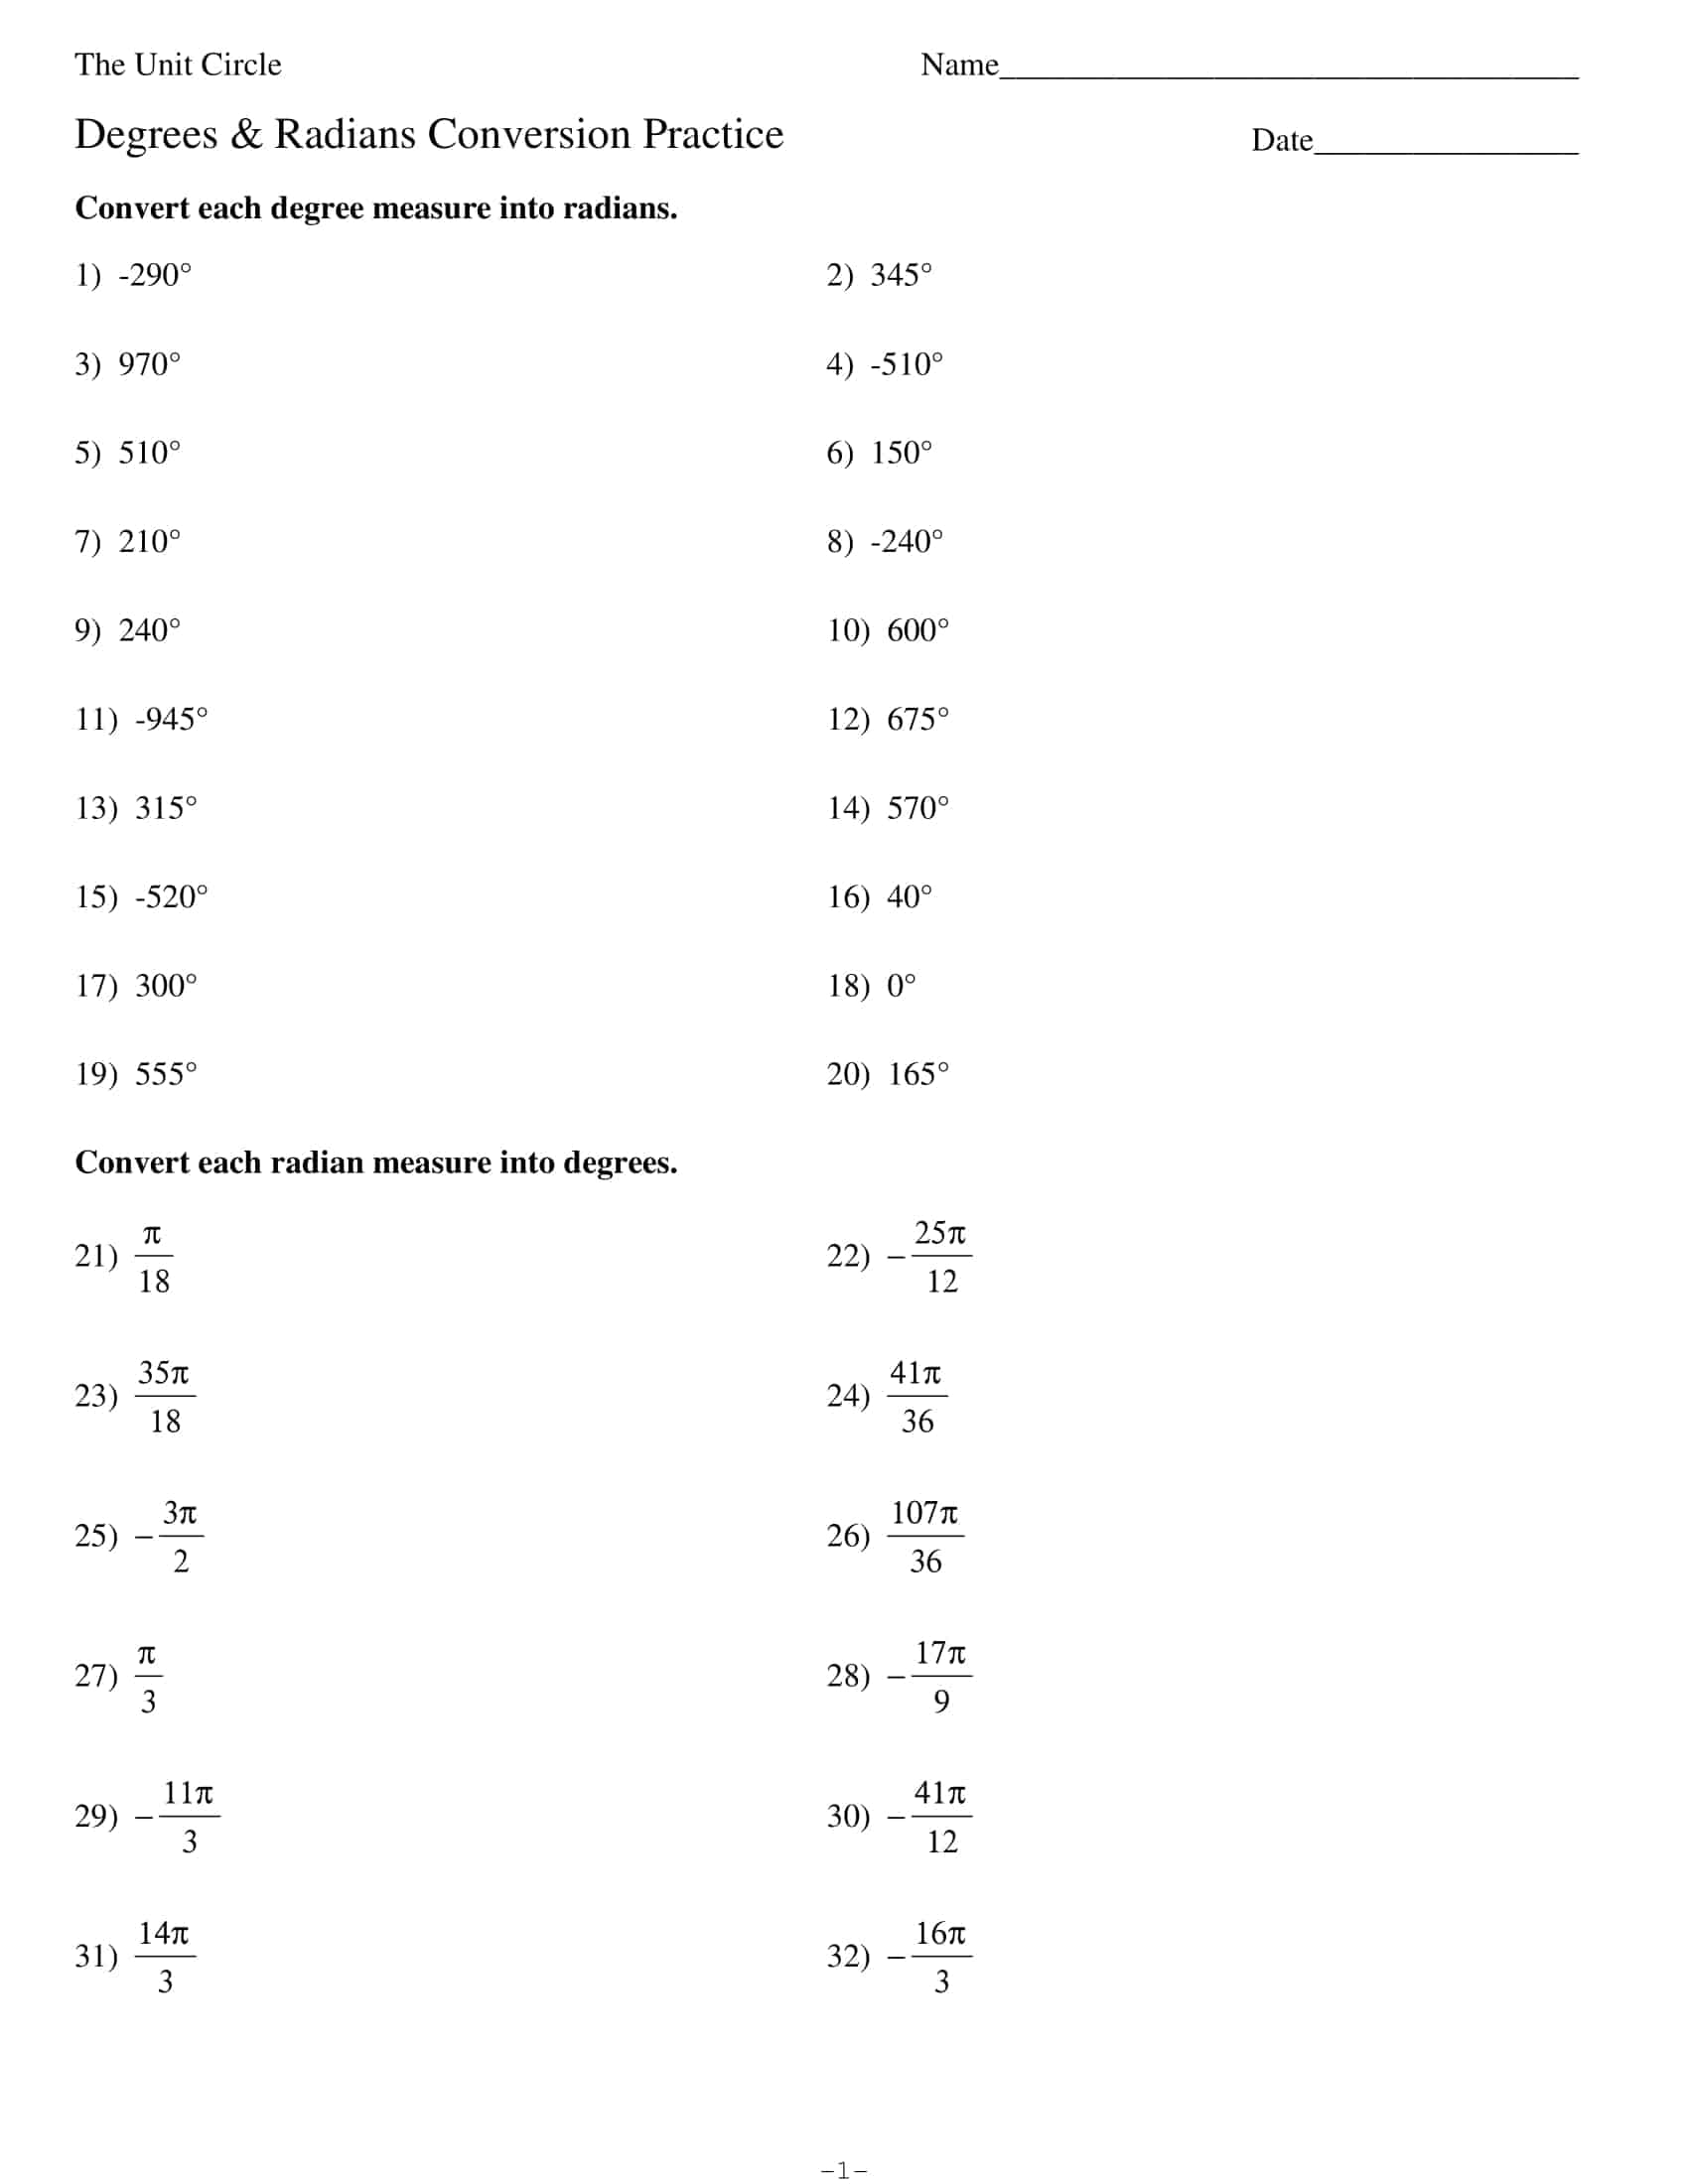
TypeCalendar offers more than 55 unit‑circle templates for learners from high school geometry to college calculus. In addition to the standard “0°-360° / 0–2π” diagram, the simple model with only special angles (30°-45°-60°), the “radical form” version showing sin‑cos values in root format, and advanced versions that add the complete tan+cot table as a side column are included in the folder. The color‑coded “Quadrant Highlight” template shades Quadrants I‑IV in four pastel tones, while the “Reference Angle Overlay” template marks each angle’s reference line with a clean arrow.
File Formats: PDF, DOCX, SVG, and More
The TypeCalendar team brings its famous “one template—many channels” philosophy to this unit circle collection. First, we created a 300 dpi, high‑resolution PDF. When printed in A4 and US Letter sizes, at 300 dpi quality, even the root expressions can be read without jagged edges. TWe added a 2‑cm calibration bar to prevent “fit‑to‑page” scaling errors that can warp angle values. Just print the PDF, verify the bar with a ruler, laminate it, and pin it to the classroom board worry free.
We didn’t forget Microsoft Word fans either: a fully editable .docx version is included. In the .docx version, we locked the diagram layers but left the comment boxes open, allowing teachers to insert notes and students to add short exercises. Because cloud collaboration matters, we also provide a Google Docs copy of every template, letting team members fill in angles and coordinates simultaneously in seconds.
If your design team insists on brand colors, grab the full‑vector SVG files re‑tint them in Illustrator and scale them to poster size with zero quality loss. Finally, the PowerPoint ready version lets you drag the chart onto a slide, overlay an animated sine wave, and transform any lecture into an interactive workshop.
Classroom, Office, and DIY Use Cases
- High‑School Trigonometry: A color coded special angles template helps students memorize the 12 most‑used angles and their radical values.
- Engineering Courses: The “Radians–Degrees Dual” diagram links to the complex number plane when teaching Fourier analysis.
- Online Lessons: Convert the SVG to a 1080 × 1080 px PNG overlay for YouTube; every value stays crystal‑clear on screen.
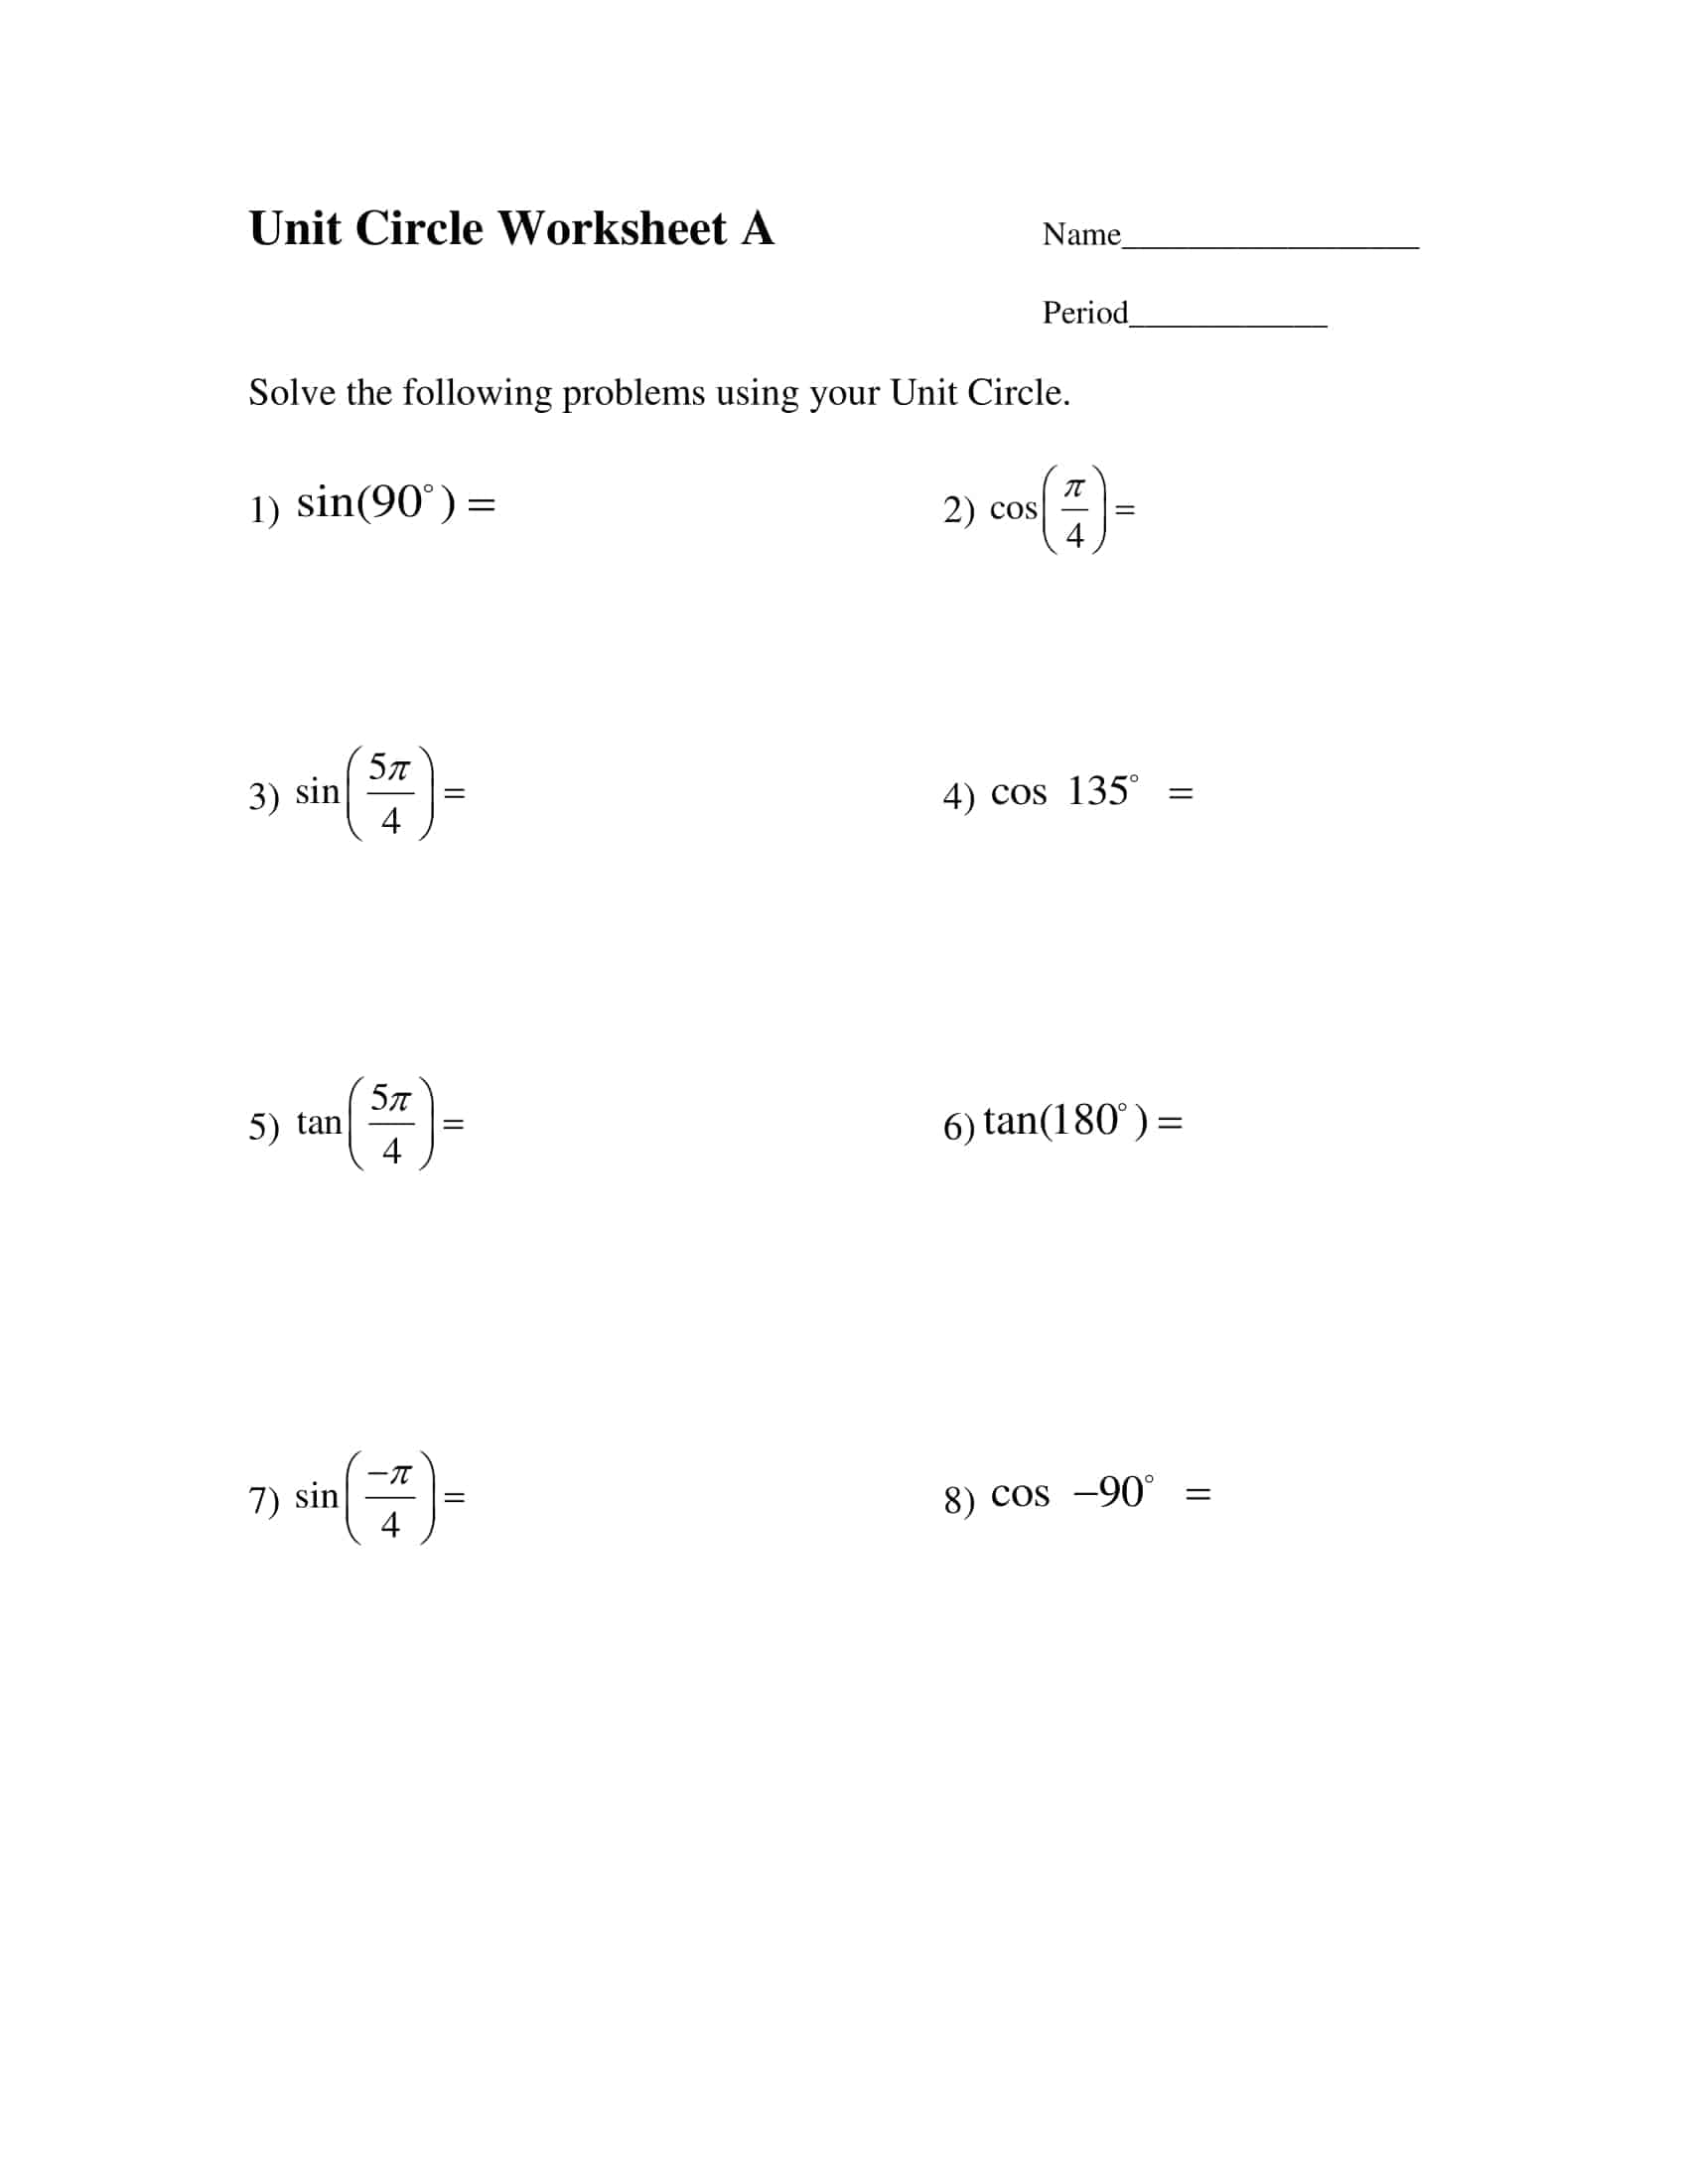
- Personal Study Booklet: Drop the “blank‑coordinate” chart into Word, save the answer key as a separate PDF, and your self quiz cycle is set.
Pro Customization Tips for Designers and Teachers
If you want to place a school or course logo in the center of the diagram, open the SVG file and embed your PNG in the <g id=”logo”> layer; set the visibility box to 80% opacity, the trig values will not remain in the background. In Google Docs, convert the radical‑form values to decimals instantly with the built‑in “decimal‑toggle” macro perfect for engineering homework.
Download and Learn Faster Today
Whether you need to visualize trigonometric functions, accelerate last‑minute exam review, or provide students with a polished visual aid, TypeCalendar’s Unit‑Circle Diagram & Chart templates have you covered. Choose from 55 + templates, match them to your color scheme, export to PDF, and start teaching today. On the 360‑degree journey around a circle, sine cosine values stop being mere formulas and lock themselves into your visual memory.
















![Free Printable Food Diary Templates [Word, Excel, PDF] 1 Food Diary](https://www.typecalendar.com/wp-content/uploads/2023/05/Food-Diary-1-150x150.jpg 150w, https://www.typecalendar.com/wp-content/uploads/2023/05/Food-Diary-1-1200x1200.jpg 1200w)
![Free Printable Credit Card Authorization Form Templates [PDF, Word, Excel] 2 Credit Card Authorization Form](https://www.typecalendar.com/wp-content/uploads/2023/06/Credit-Card-Authorization-Form-150x150.jpg)
![Free Printable Stock Ledger Templates [Excel,PDF, Word] 3 Stock Ledger](https://www.typecalendar.com/wp-content/uploads/2023/08/Stock-Ledger-150x150.jpg)
