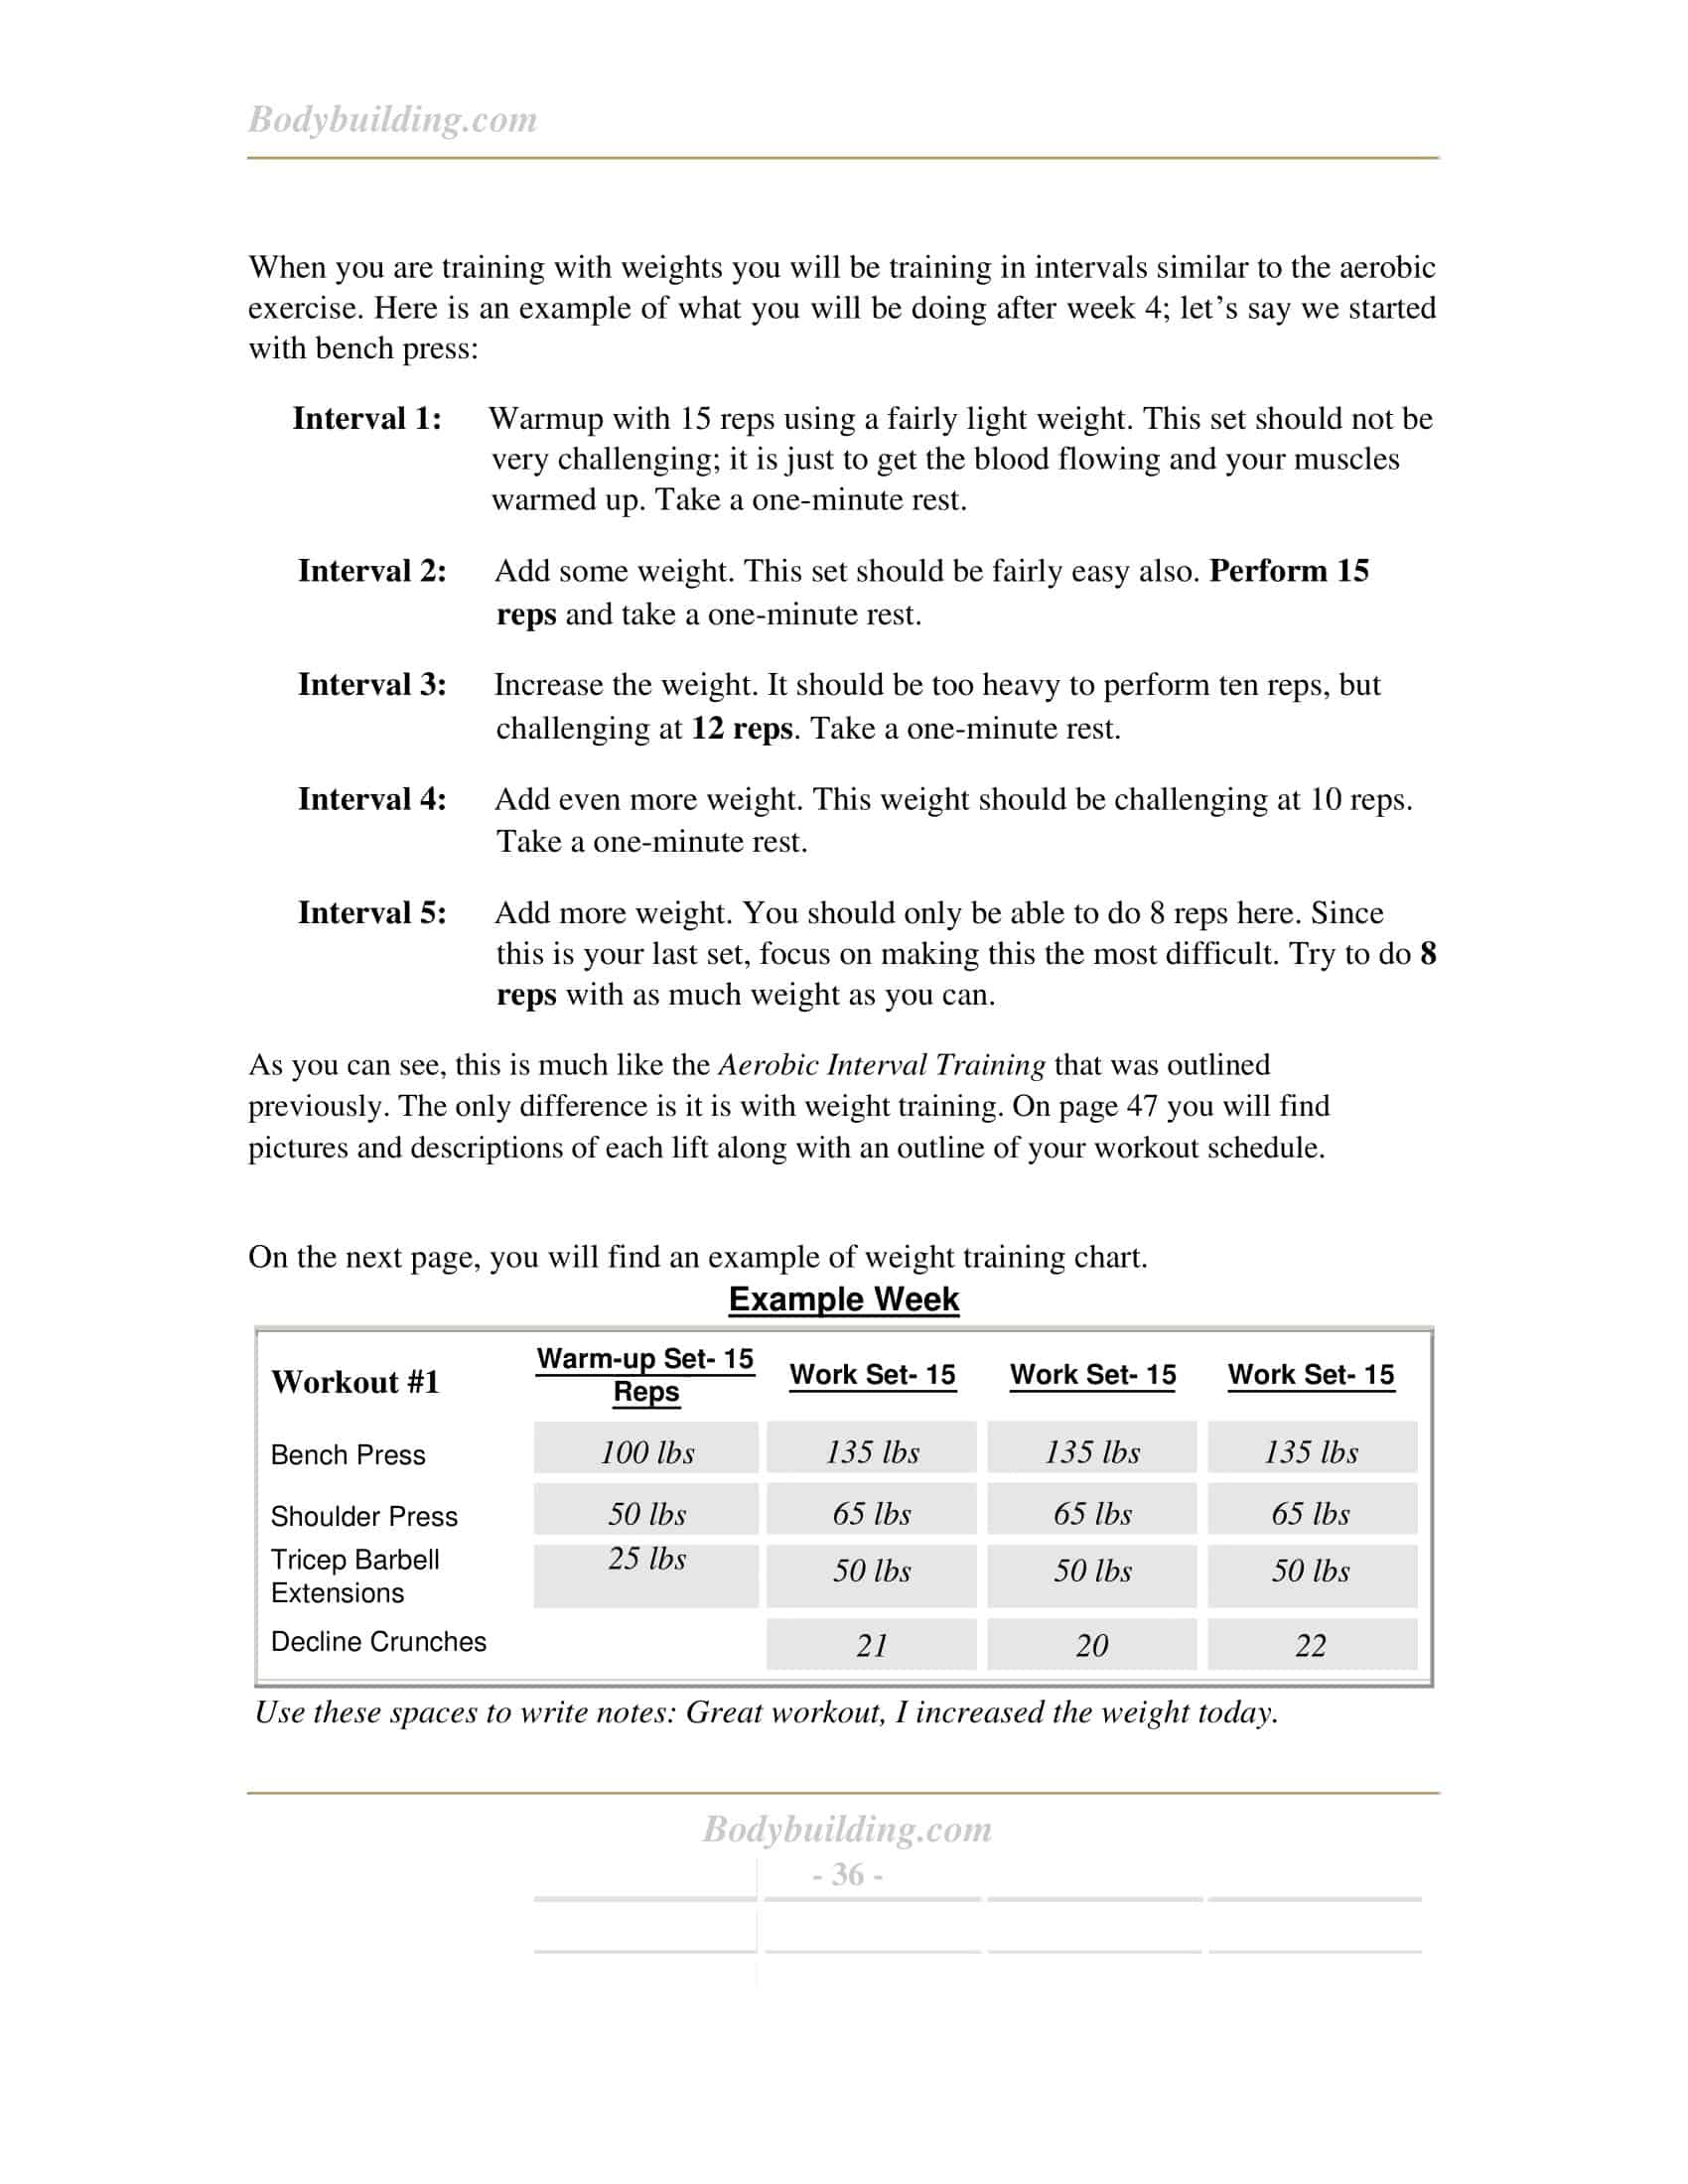
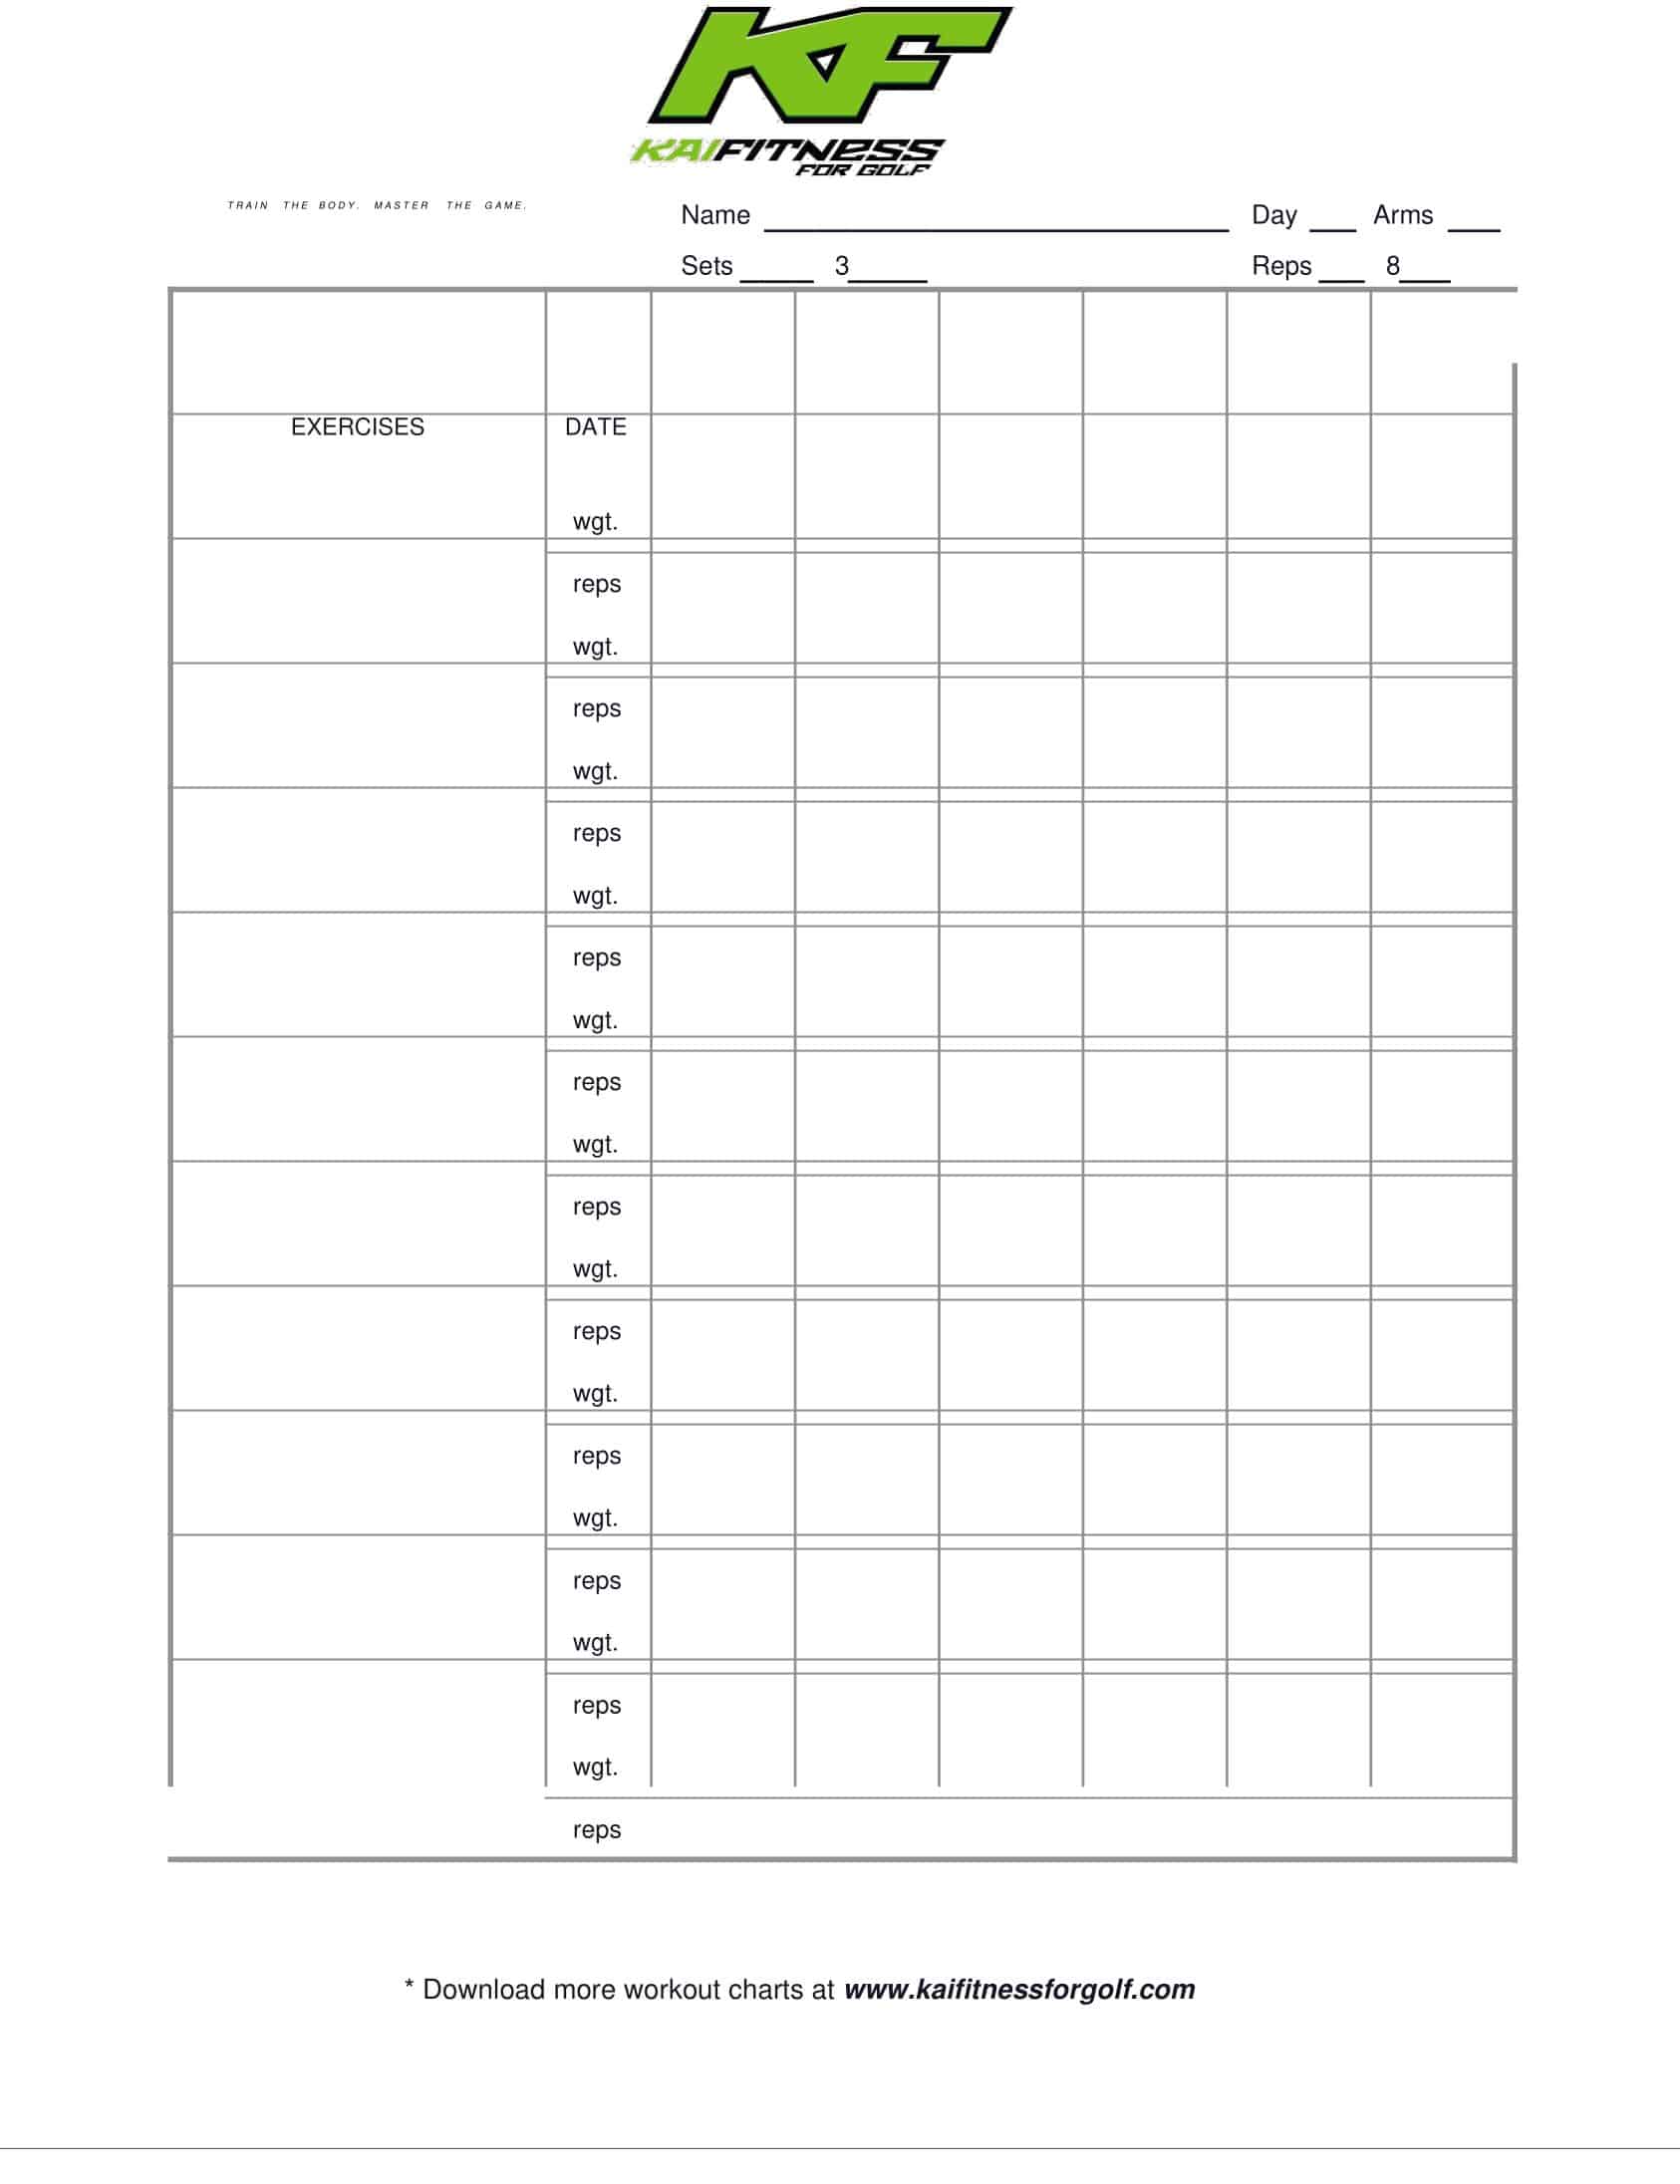
When the warm-up is over and you switch to weights, remembering the weight on the bar or the time on the treadmill by saying, “I think it was like this last week,” is to leave the progress to chance. That’s where the Exercise Chart comes in; it turns workout data into a tangible record, moving set-repetition counts, rest intervals and heart rate values from memory to paper.
As the TypeCalendar team, we have designed 56 detailed Exercise Charts to cover every discipline, from strength training to running program, from rehabilitation to HIIT session. These tables instantly show which muscle group has recovered and by how much, which exercise deserves a load increase, and which distance has plateaued by transferring set and repetition numbers, rest periods, pulse zones, and 1 RM percentages from memory to paper (or screen). Thus, training becomes a data driven plan instead of a gamble.
Table of Contents
Exercise Chart Effects on Daily Performance

Filling out a chart takes seconds at the end of the workout, but the long-term effect is great. The line of progress becomes more evident as the cells fill up, making you watch your motivation like an outside observer. When a visual warning appears that the same muscle group is receiving high loads on consecutive days, you can pre-empt the risk of injury by revising the program. When rest periods are recorded as part of the development process rather than as a “sin”, your recovery process becomes a controllable variable.
TypeCalendar’s Collection of 56 Exercise Chart Templates
Not every discipline fits a one-size-fits-all chart, which is why TypeCalendar has developed a total of 56 detailed Exercise Charts for a wide range of people, from those who do sports at home without equipment to professional athletes who train in Olympic lifting. Strength programs come with set sections where 1RM percentages are automatically colored, while running and cycling focused outlines fit distance-pace-incline tracking into a single line.
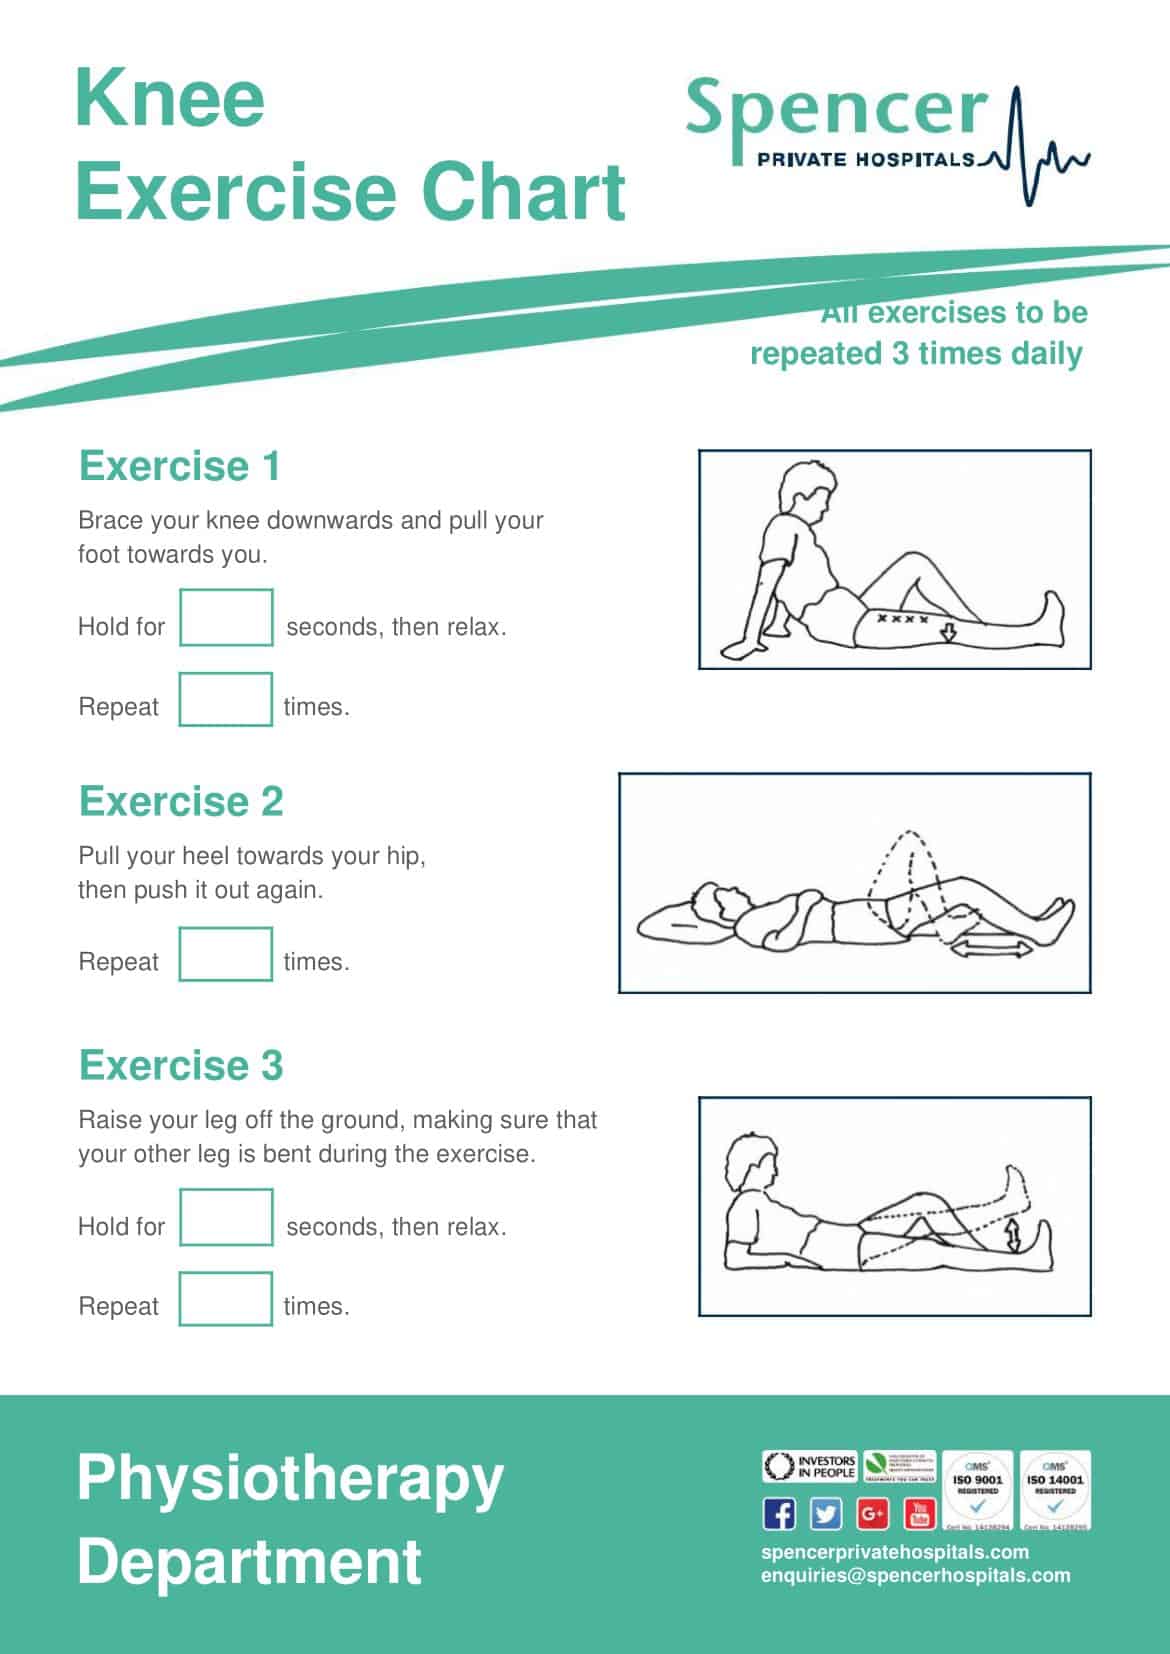
HIIT flow charts divide rest and work blocks by seconds, while yoga-mobility charts add pose time and breathing pattern space. Rehabilitation forms record the physiotherapist’s observation with additional columns including ROM measurement and pain scale. Each template includes a “target date” and “percentage complete” indicator, visualizing progress with a bar.
File Formats and Flexibility
Each painting in the collection is presented with print-as logic in 300 dpi CMYK PDF format, which does not deteriorate in printing; it is ideal for laminating and filling in the living room with a pencil. For those who want a more dynamic follow-up, the 1RM, pulse zone and tempo calculator formulas are embedded in the XLSX and Google Sheets versions; the chart is updated instantly when the figure is entered.
Download and Start Training
Whether your goal is fat burning or power increase, sustainable development is only possible with a data-based record. Download TypeCalendar’s 56-template Exercise Chart pack now and add the paper or digital chart to your routine; focus on the question “how far will I progress today?” rather than “what will I do next?”


![Free Printable Credit Card Authorization Form Templates [PDF, Word, Excel] 1 Credit Card Authorization Form](https://www.typecalendar.com/wp-content/uploads/2023/06/Credit-Card-Authorization-Form-150x150.jpg)
![Free Printable Stock Ledger Templates [Excel,PDF, Word] 2 Stock Ledger](https://www.typecalendar.com/wp-content/uploads/2023/08/Stock-Ledger-150x150.jpg)
![Free Printable Financial Projections Templates [Excel, PDF] 3 Financial Projection](https://www.typecalendar.com/wp-content/uploads/2023/05/Financial-Projection-1-150x150.jpg)
