Infographics are popularly used in this era of information overload. Flow charts make comparing and contrasting your options much easier, especially using software that creates flowcharts. Information can be distributed more clearly with a flow chart because the charting program allows you to highlight important information factors, making it easy for readers to digest the essential details quickly. A well-designed infographic or flow chart takes advantage of space, color, and size to draw attention to what is most important.
Table of Contents
What is a flow chart?

A flowchart is a graphical representation of a logic sequence, business or production process, organizational chart, or similar formal structure. A flowchart aims to provide people with a common language or reference point when dealing with a project or process.
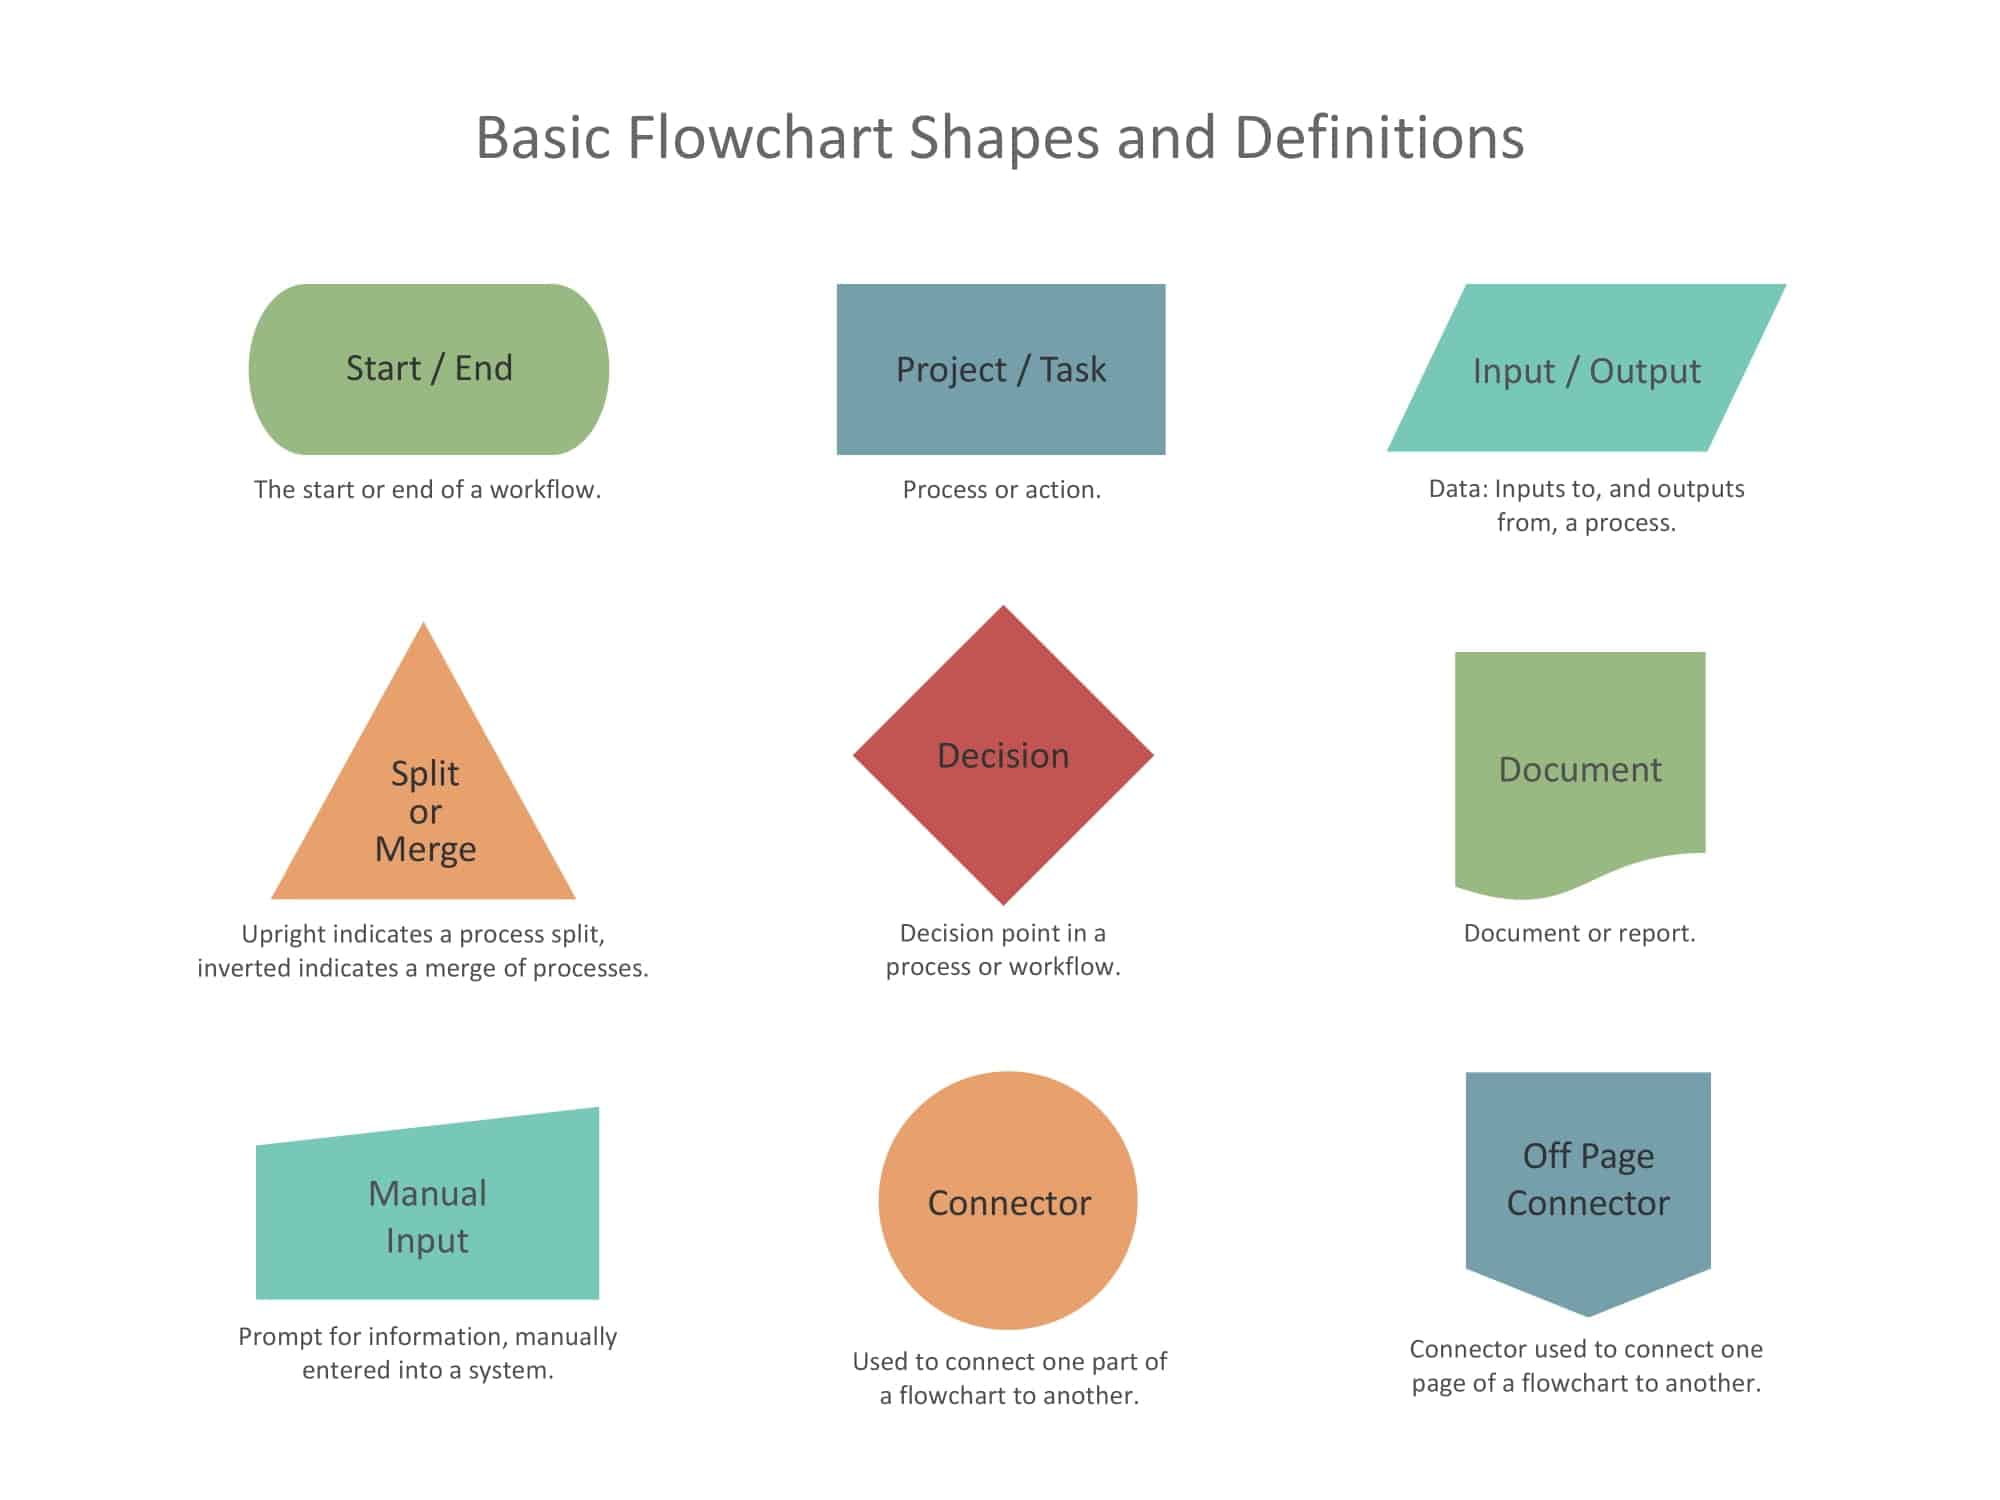
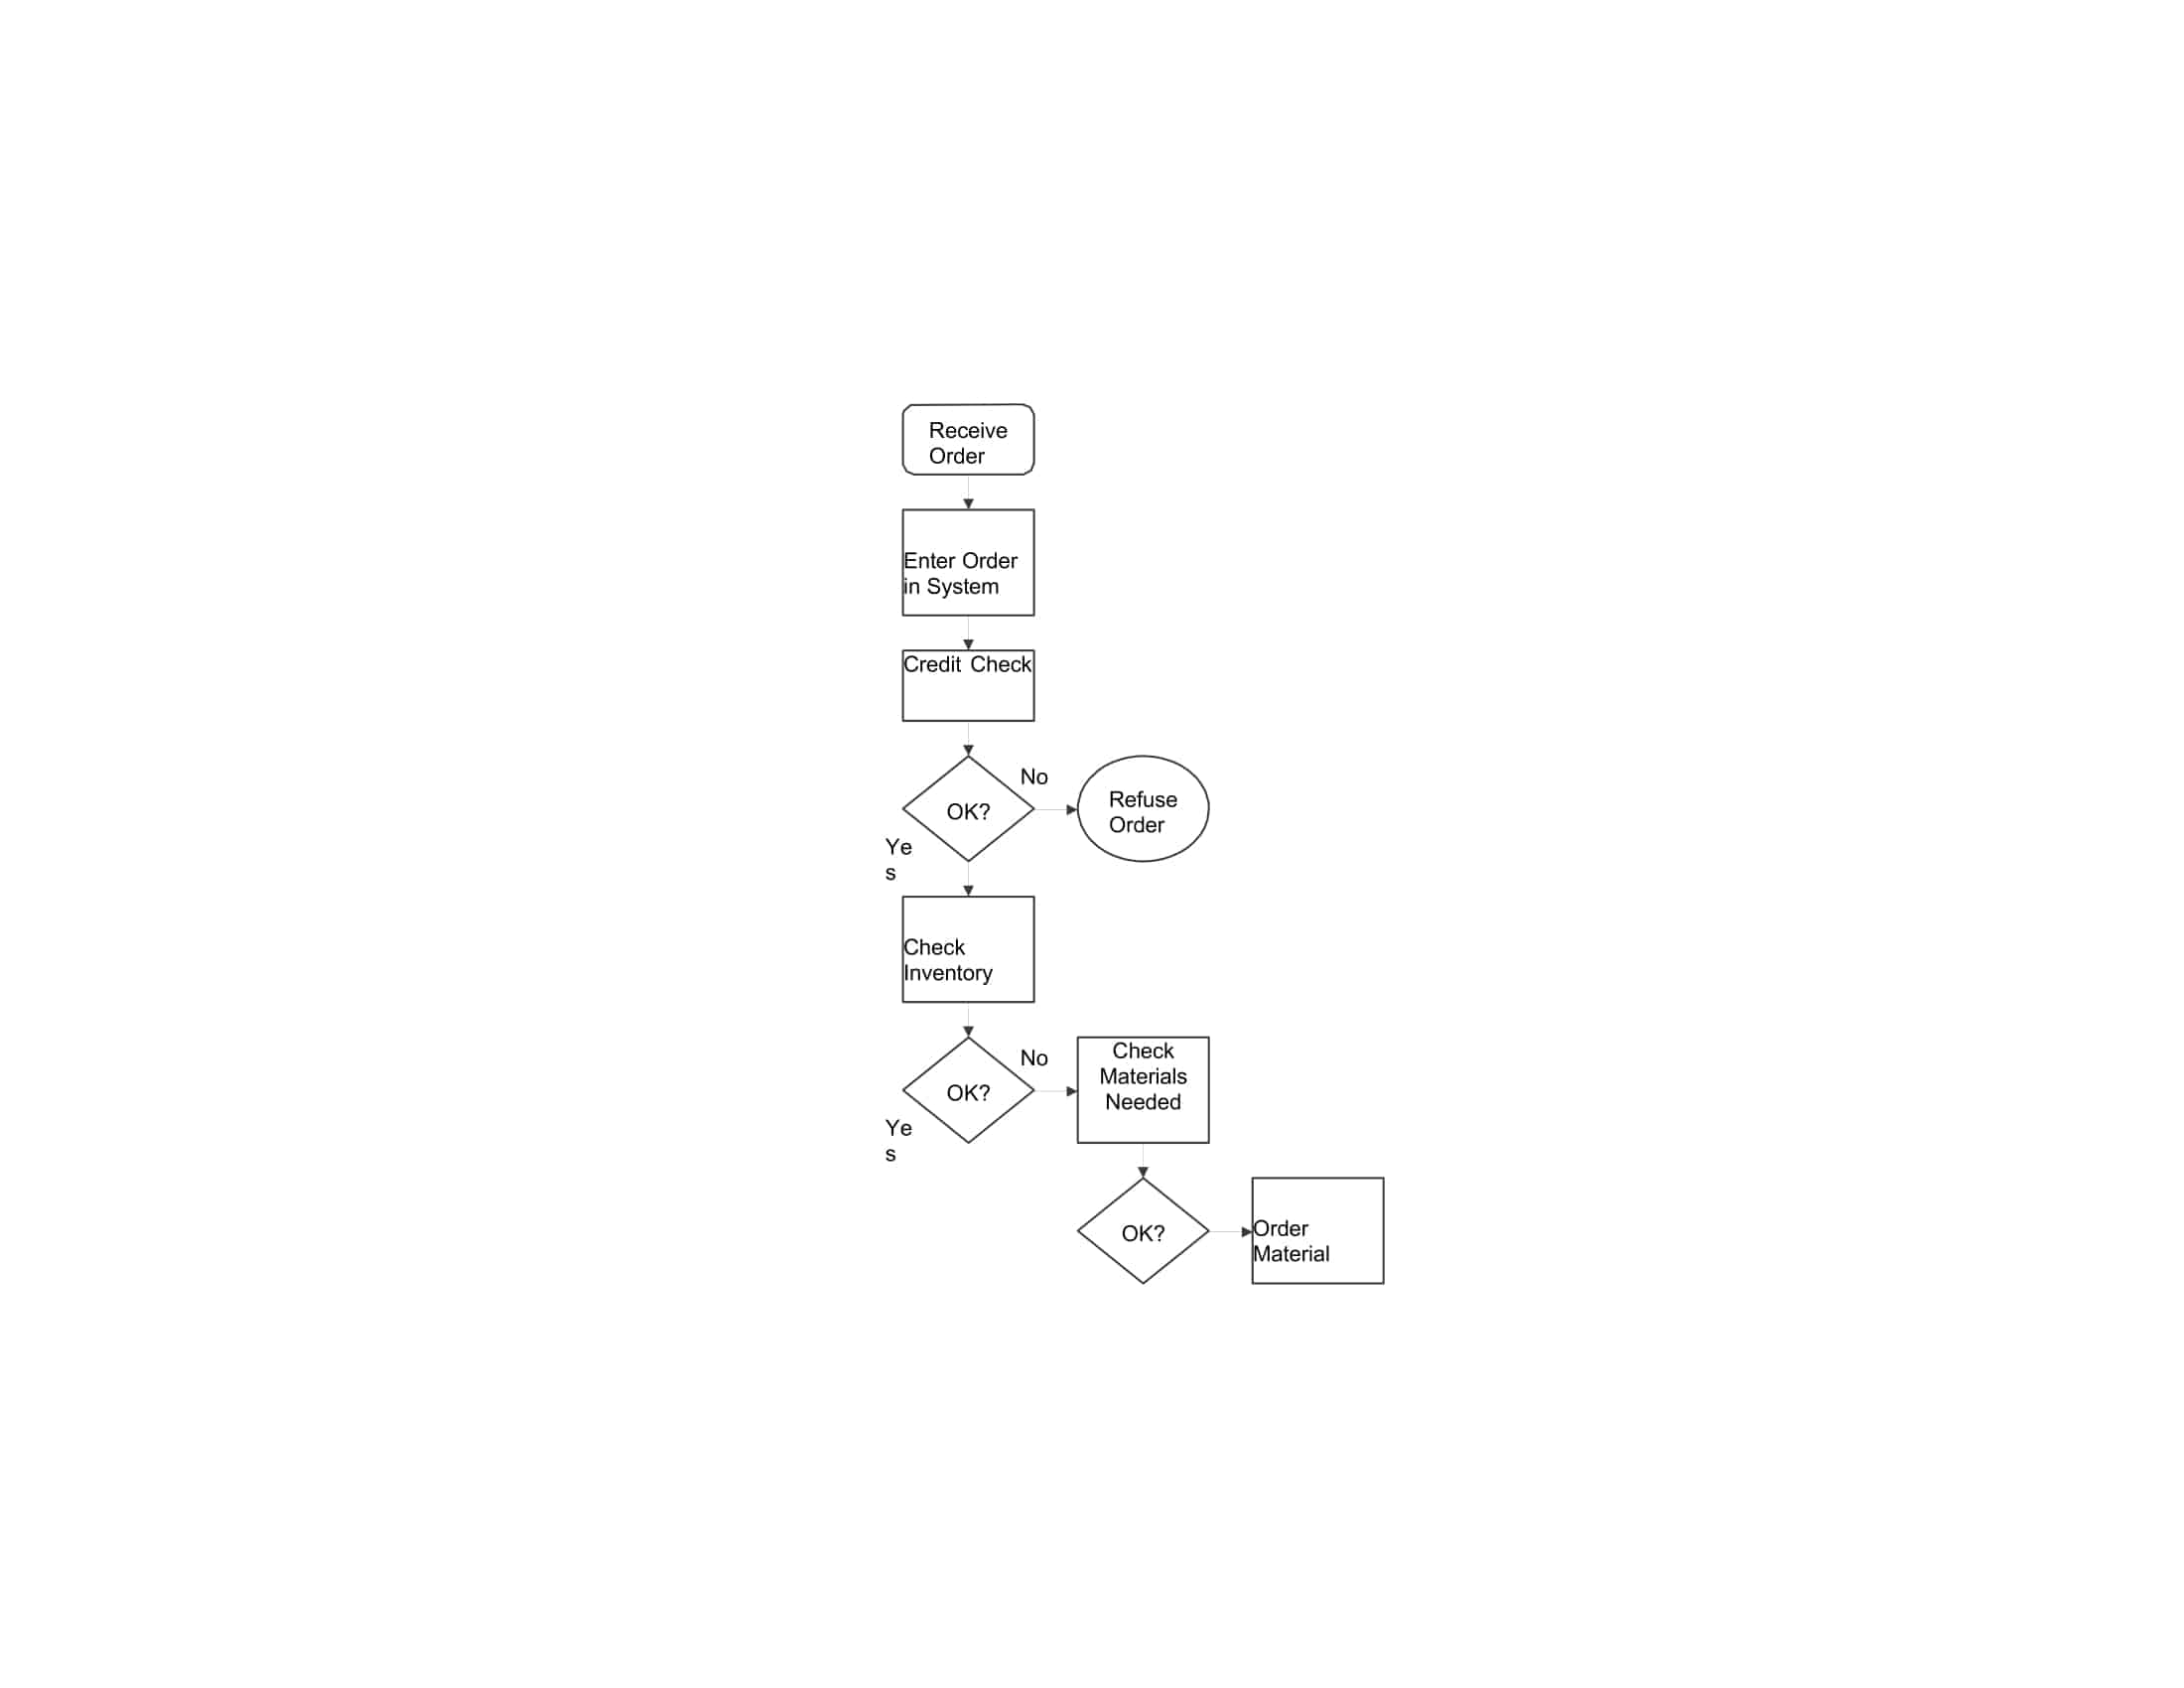
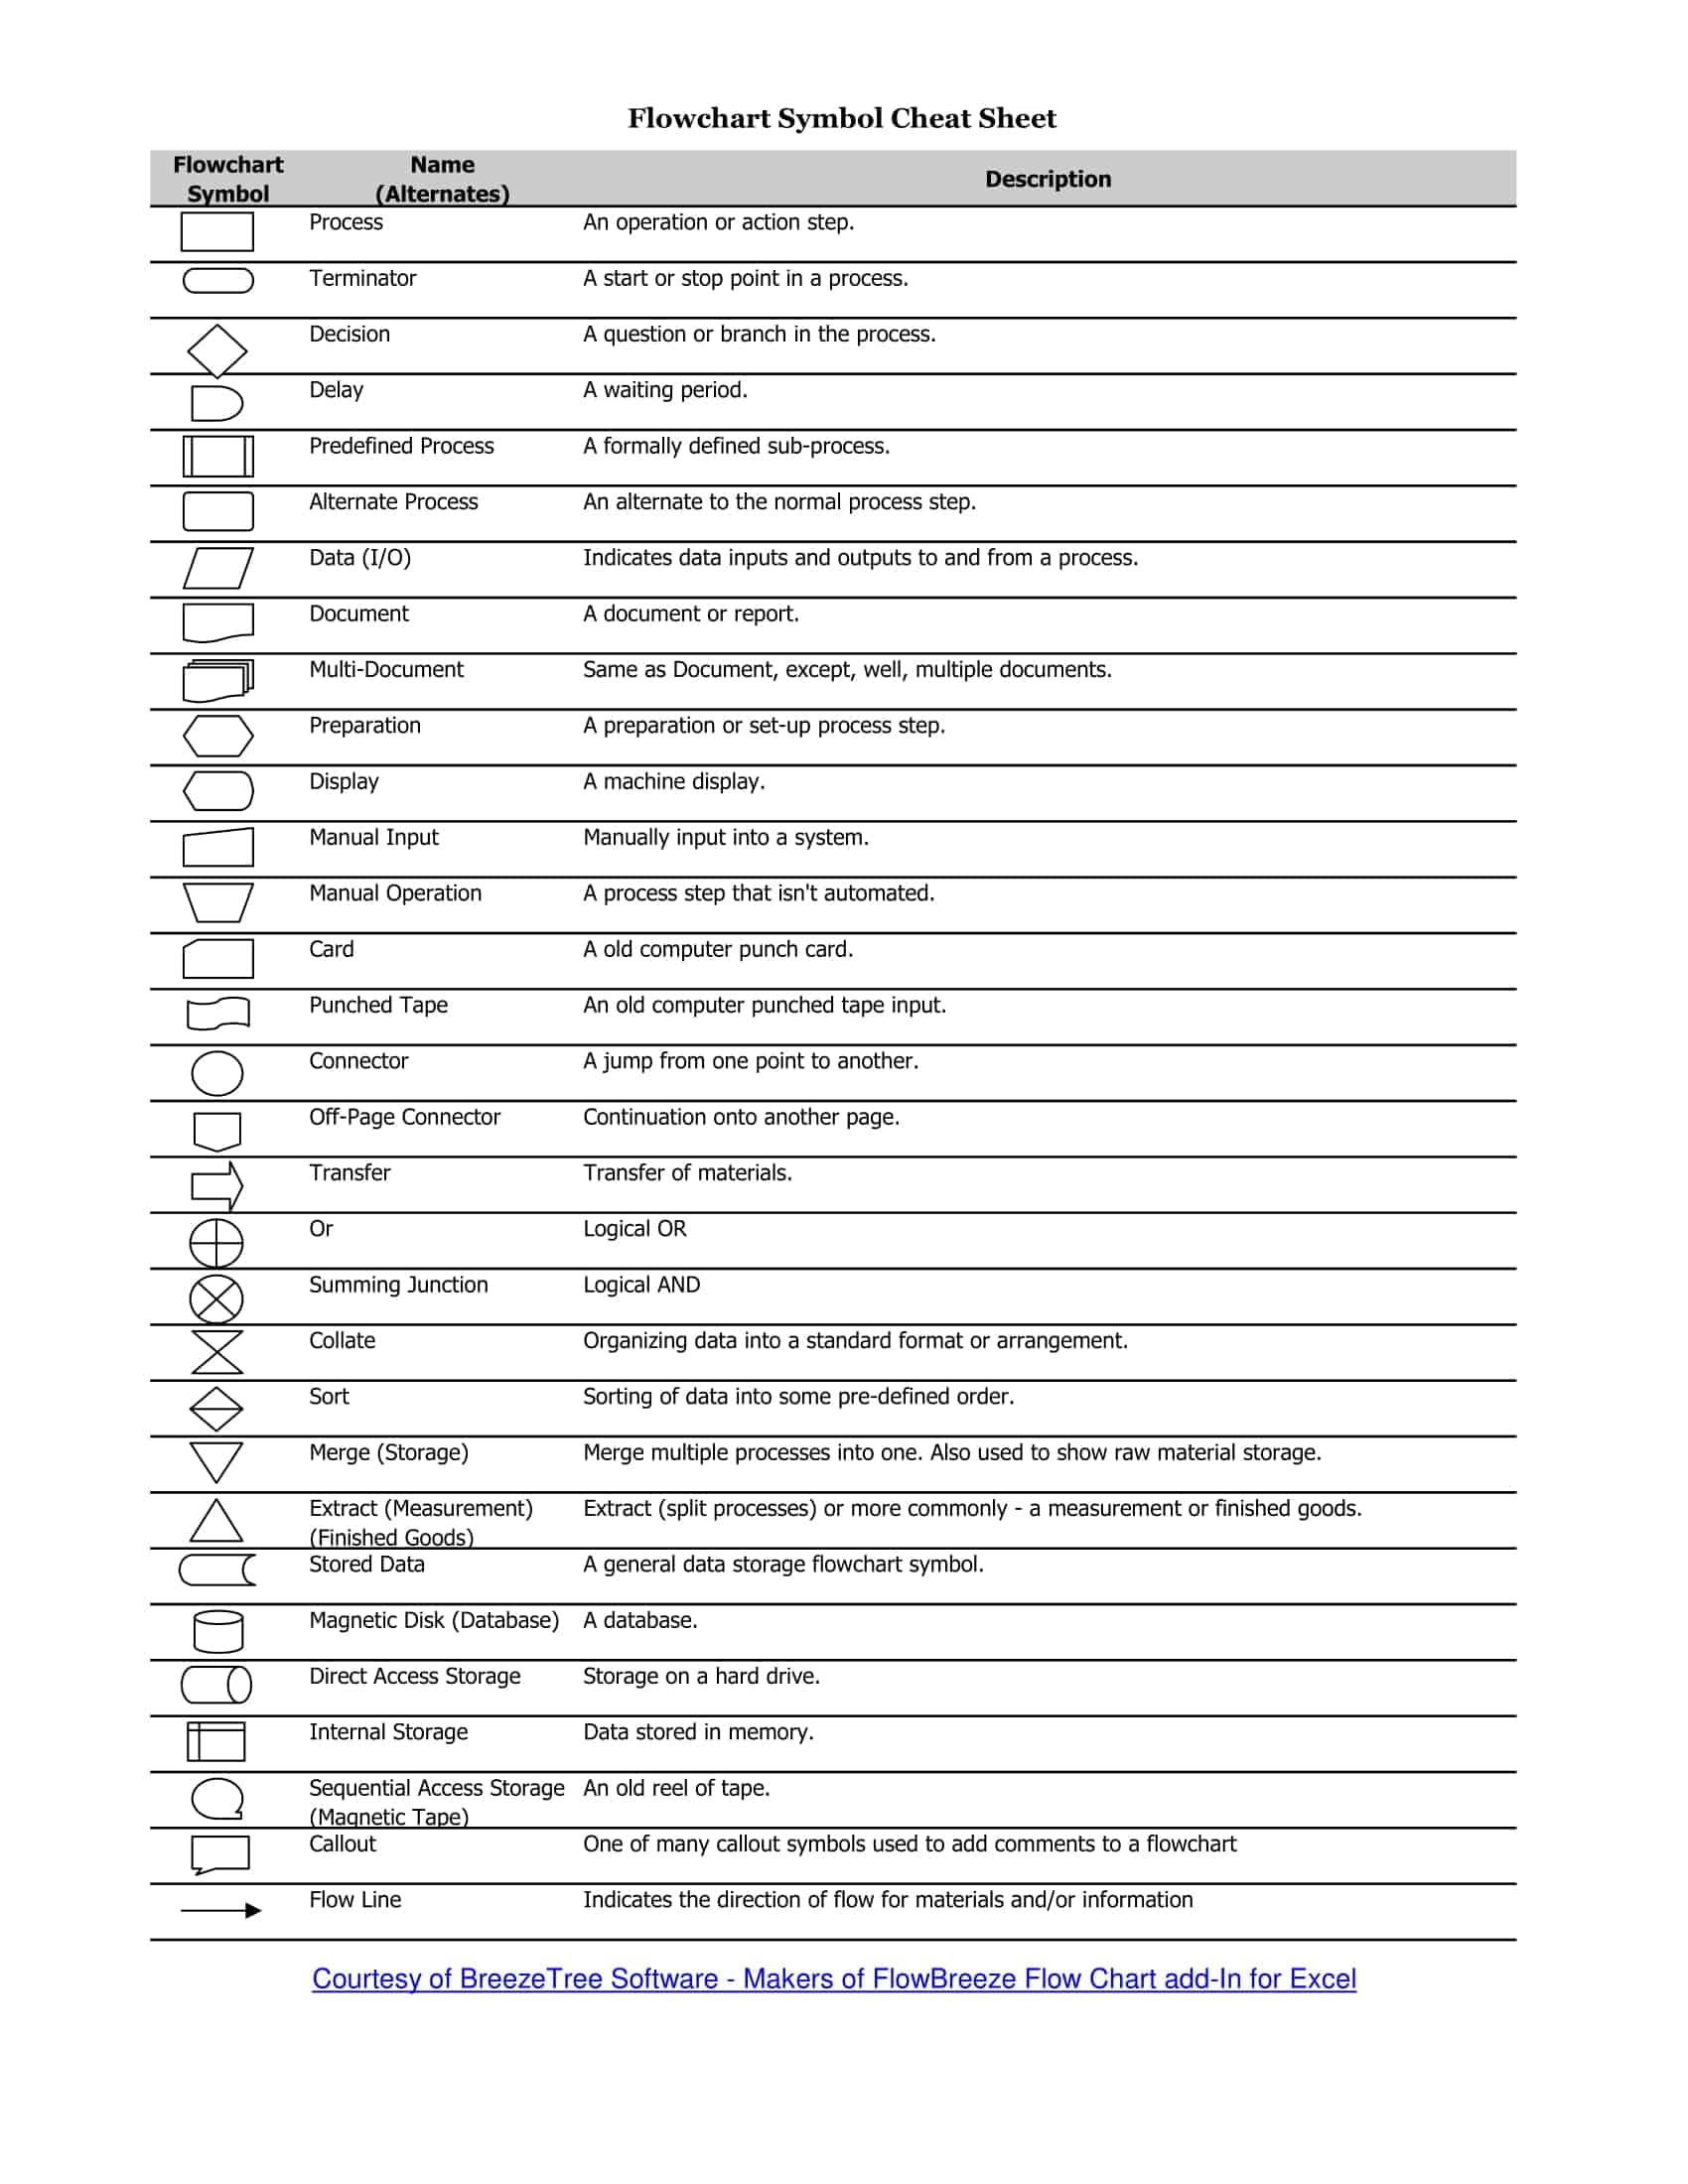
Flowcharts use simple geometric symbols and arrows to describe relationships. For example, in programming, the start or end of a program is represented by an oval shape. A transaction is represented by a rectangle, while a decision is represented by a diamond shape. In addition, the Internet is specified as a cloud.
Flow: A representation of a set of logic operations to satisfy certain requirements. It can be irregular, natural, uncorrected, or fraught with problems. Therefore, it may appear as if it does not appear in some cases.
Chart: A presentation or written explanation of some regular and common parts of the flow. A chart is conducive to communication and concentration. This means the submission of references for process engineering.
Flow Chart Templates
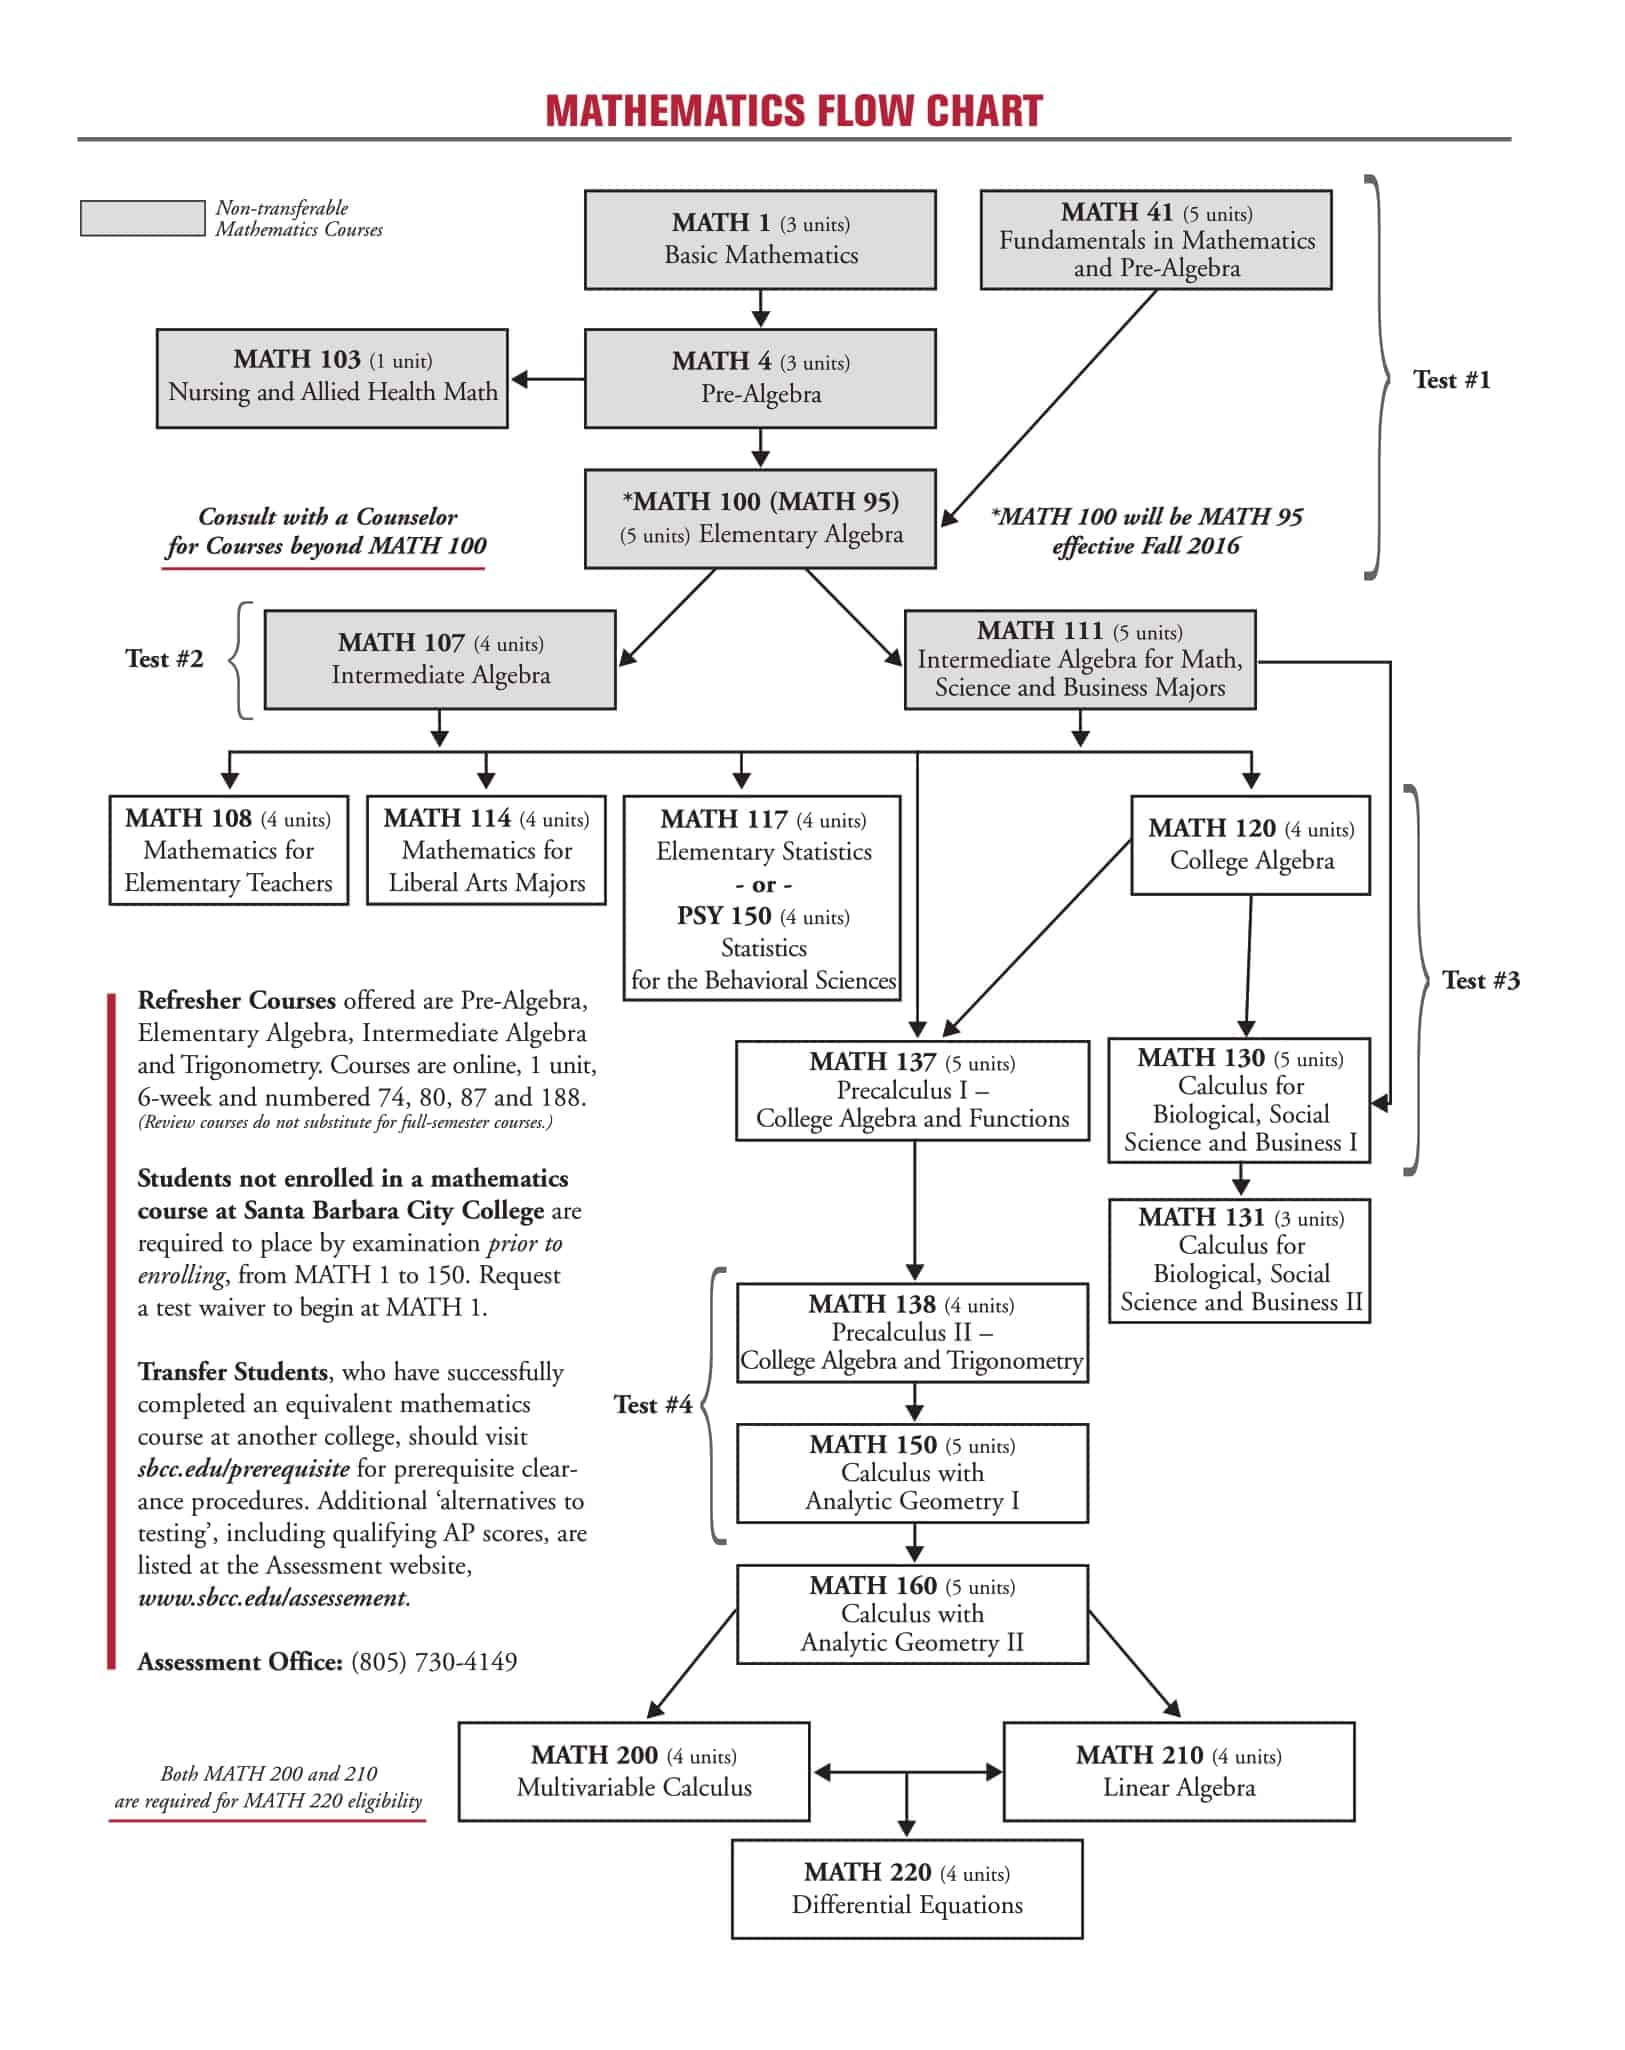
Flow chart templates are visual representations that depict the sequential flow and progression of a process or system. These templates provide a structured framework for mapping out the steps, decisions, and outcomes of a process in a clear and organized manner. Flow charts use various symbols and arrows to illustrate the flow of information, materials, or actions, allowing individuals to easily understand and analyze the process.
Flow chart templates are widely used in a range of fields, including project management, business process analysis, software development, and quality control. They enable individuals and teams to identify bottlenecks, inefficiencies, and potential areas for improvement within a process. With the help of flow chart templates, individuals can enhance their understanding of complex processes, streamline workflows, and communicate ideas effectively to others.
What Are the Benefits of a Flow Chart?
Flowcharts improve communication. For example, when a change is made to a manufacturing process, an updated flowchart allows anyone affected to easily see the change and how it fits into the overall manufacturing system. In terms of training, flowcharts make it easier for new employees to understand how each of their steps will complete the whole process.
An important benefit of flowcharts is that they provide documentation of a process. Flowcharts are extremely helpful when problems arise, as they allow you to follow the process from one step to the next. This allows you to identify when the problem occurs easily.
The flowchart also guides managers overseeing operations. This helps ensure compliance with policies and regulations. For example, managers may refer to an accounting procedures flowchart to verify that bookkeeping activities are conducted according to generally accepted accounting principles.
In addition to the above, flowcharts have several benefits, such as:
It helps to clarify how things are currently working and how they can be improved.
It helps you find the essential elements of a process while drawing clear lines between where one action ends, and the next action begins.
It encourages communication between participants and creates a shared understanding of the process.
Most Common Types of Flowcharts
While the variations and versions of flowcharts are endless, there are four types of flowcharts that are particularly versatile. These four common diagrams are great for describing the business, manufacturing, or administrative processes, seeing how an organization works or how different departments work together.
- Process Flow Chart
A process flowchart is probably the most versatile of the four commonly used types of flowcharts. Because it can be applied to almost anything. A process flowchart can be used for the following reasons:
Plan roles and responsibilities in an organization for clarity.
Prepare a proposal for a new process or project to understand its scope and steps.
- Workflow Chart
A workflow diagram shows how a business or process works. The following example shows the steps required for a potential customer to renew a policy through a company’s site. This type of workflow diagram can be used for:
- Training of new employees
- Discovery of potential problem areas
- Clarification of business activities by showing a high-level overview
- The Swimlane Flowchart
The Swimlane flowchart is useful when showing multiple information streams side by side. Swimlane diagrams can really look like a workflow diagram. But the key point here is that it allows you to create different categories where the event happens.
A Swimlane flowchart or flowchart is excellent for documenting the entire process that interacts with different parts of an organization or requires collaboration between different teams. The following example shows how an internal department works in parallel with an outward-facing department and when they interact with each other in the process.
- Data Flow Chart
A data flowchart shows the way data is handled. Useful when you want to design or analyze a system. Although most often used for software development and software design, it can also be used to analyze any type of information flow, such as how information moves in a business. The following example shows a typical sales funnel. In this case, data is consumer behavior.
Conclusion
A flowchart is known as a diagram that illustrates a process, system, or computer algorithm. They are widely used in many fields to document, review, plan, develop, and often communicate complex processes with clear, easy-to-understand diagrams.
Flowcharts, sometimes referred to as flowcharts, use rectangles, ovals, diamonds, and potentially numerous other shapes to describe the step type, with connecting arrows to identify the flow type and sequence. They can range from simple, hand-drawn graphics to comprehensive computer-drawn diagrams illustrating multiple steps and routes.
Keep your audience in mind and pass the details on the chart to them. Open communication is the primary goal of flowcharts.
If the process you’ve drawn involves different teams or departments, consider using a float level diagram to define responsibilities and turnovers clearly.
Use on-page or off-page connectors to organize and logically stream your chart. This allows you to break up a chart into separate pages and still have a good flow.
FAQs
Is there a flow chart template in Word?
Yes, Microsoft Word has flowchart templates that you can use to easily create flowcharts. To find them, go to the Insert tab in the ribbon and click on Shape. Then select the Flowchart category which contains various flowchart templates like basic flowchart, cross functional flowchart, and more. Simply click on the template you want and it will appear on your document ready for you to edit. The shapes will have placeholder text that you can replace with your own.
Does Word or Excel have a flow chart template?
Both Microsoft Word and Excel come with built-in flowchart templates that make it easy to create flowcharts without any additional software.
In Word, go to the Insert tab, click Shapes, and under Categories select Flowchart to see all the flowchart templates. In Excel, go to the Insert tab, click Illustrations, then choose a flowchart type like Basic Flowchart or Cross-Functional Flowchart. The templates contain placeholder shapes and text that you can quickly customize.
How to do flowchart in Excel?
Here are some tips for making flowcharts in Excel:
- Use SmartArt – Go to the Insert tab and click on SmartArt. Select a flowchart layout in the Process category. Customize it by adding/deleting shapes and editing the text.
- Use Shapes – Insert different flowchart shapes like process, decision, terminator, etc from the Illustrations group. Connect them with connectors.
- Add text boxes – Type the flowchart steps in text boxes and connect them with arrows drawn with connectors.
- Use Gridlines – Turn on View > Gridlines so shapes and connectors align properly.
- Adjust layout – Size and arrange shapes for a clear flow. Use alignment tools to organize neatly.
- Add color – Use shape fill, line colors and fonts to highlight different steps and make it easier to follow.
- Link data – Connect Excel data to flowchart boxes to create data-driven charts.
What is the best program to make flowcharts with office?
The best programs for making flowcharts with Microsoft Office are Word, PowerPoint, and Visio.
Word has handy flowchart templates that provide starter layouts and shapes to quickly create basic flowcharts. PowerPoint also has various flowchart templates and easy tools for connecting shapes/steps.
For more advanced flowcharts, Microsoft Visio integrates seamlessly with Office and has extensive flowcharting capabilities. It includes numerous built-in templates and shape libraries specifically for flowcharts and diagrams. Visio also has powerful features like data linking, organization charts, and visualization tools that make it the top choice for robust flowcharts with Office.
Overall, Word and PowerPoint are great for simple flowcharts, while Visio is ideal for complex or data-driven flowcharts to leverage its advanced diagramming features. The tight integration with Office makes them all convenient flowcharting tools.





![Free Printable Credit Card Authorization Form Templates [PDF, Word, Excel] 1 Credit Card Authorization Form](https://www.typecalendar.com/wp-content/uploads/2023/06/Credit-Card-Authorization-Form-150x150.jpg)
![Free Printable Stock Ledger Templates [Excel,PDF, Word] 2 Stock Ledger](https://www.typecalendar.com/wp-content/uploads/2023/08/Stock-Ledger-150x150.jpg)
![Free Printable Financial Projections Templates [Excel, PDF] 3 Financial Projection](https://www.typecalendar.com/wp-content/uploads/2023/05/Financial-Projection-1-150x150.jpg)
