Understanding the scope and effectiveness of any process or system often hinges upon the power of well-crafted surveys. This serves as the foundation for data collection, enabling entities to tap into the perceptions, opinions, and behaviors of a target audience.
This article presents a comprehensive overview of various survey templates that are tailored to cater to different research contexts – from customer satisfaction, employee engagement, event feedback to academic research. Each template, encapsulating a unique set of questions and structure, helps researchers to extract meaningful insights, thereby contributing significantly to decision-making and strategic planning.
Table of Contents
What is a survey?

A survey is a research method used for collecting data from a predefined group of respondents to gain information and insights on various topics of interest. It employs a series of questions aimed at extracting specific data from a particular group of people. Surveys may be conducted in various forms like online polls, paper questionnaires, phone surveys, or face-to-face interviews.
They are highly versatile tools used in many fields including market research, social science, health research, and others, providing quantitative or qualitative information about people’s opinions, behaviors, experiences or characteristics. The gathered information, when properly analyzed, can aid in informed decision-making, policy formation, and understanding trends or patterns among the surveyed population.
Survey Templates
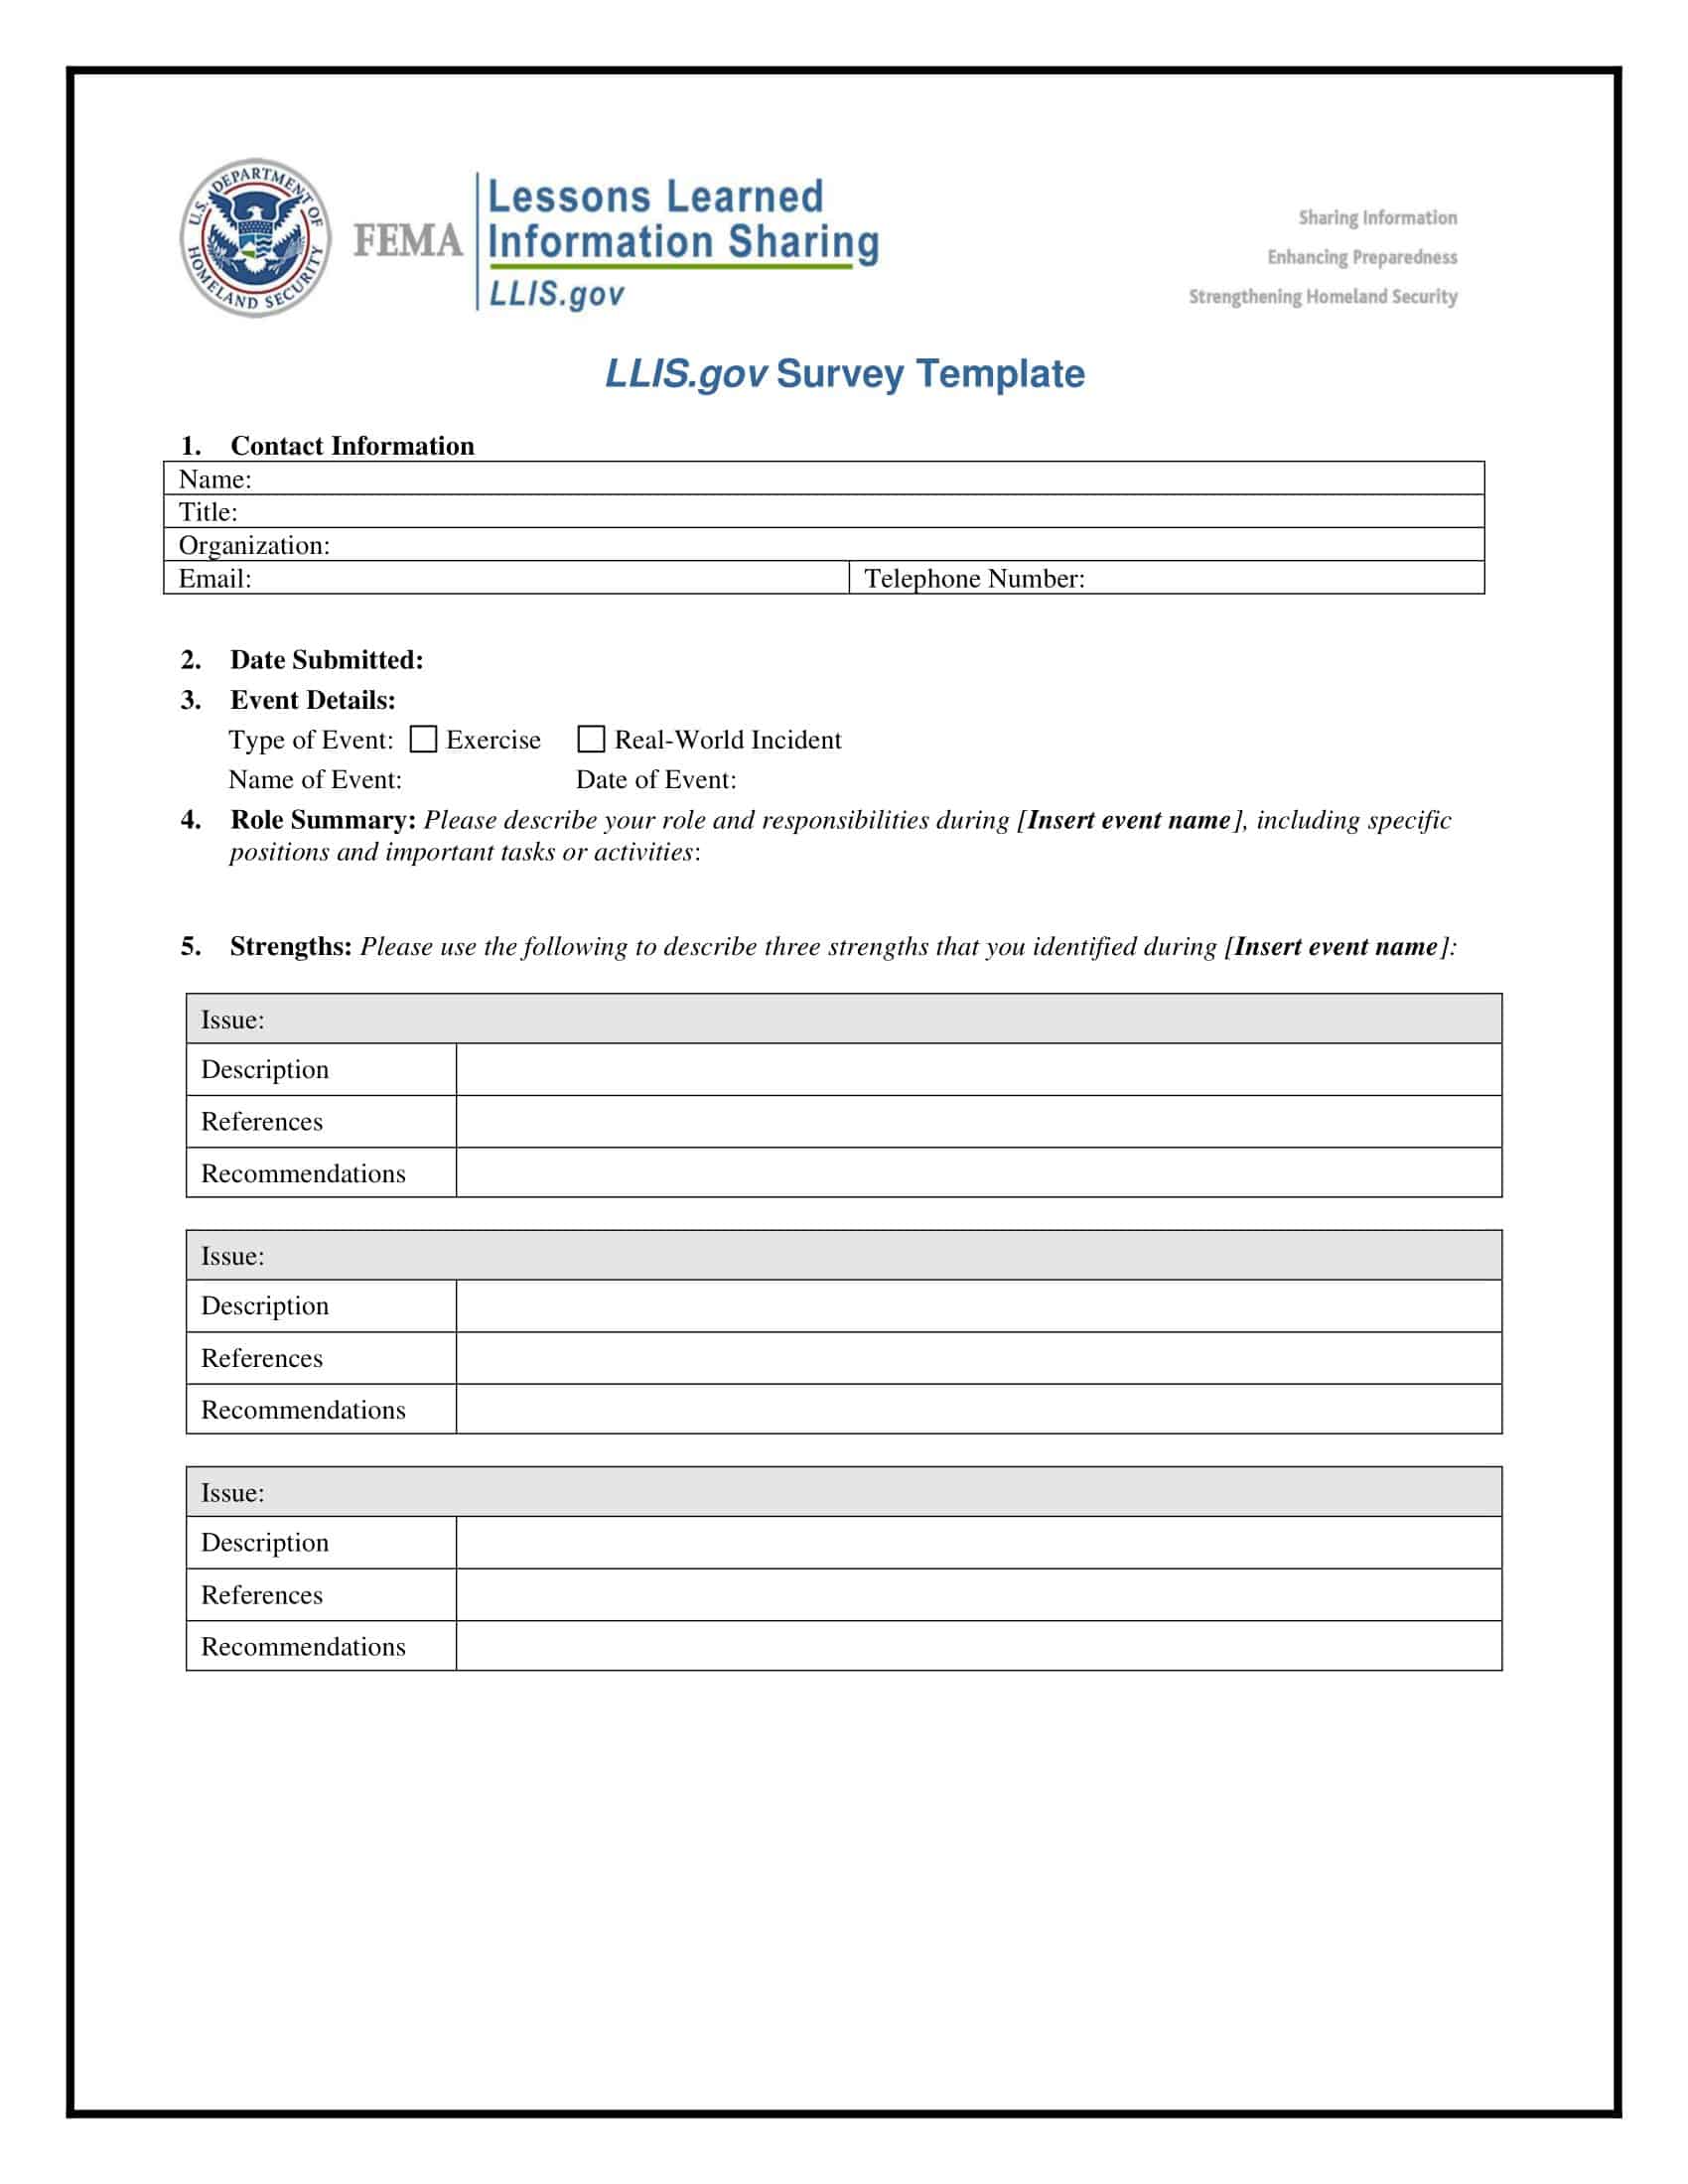
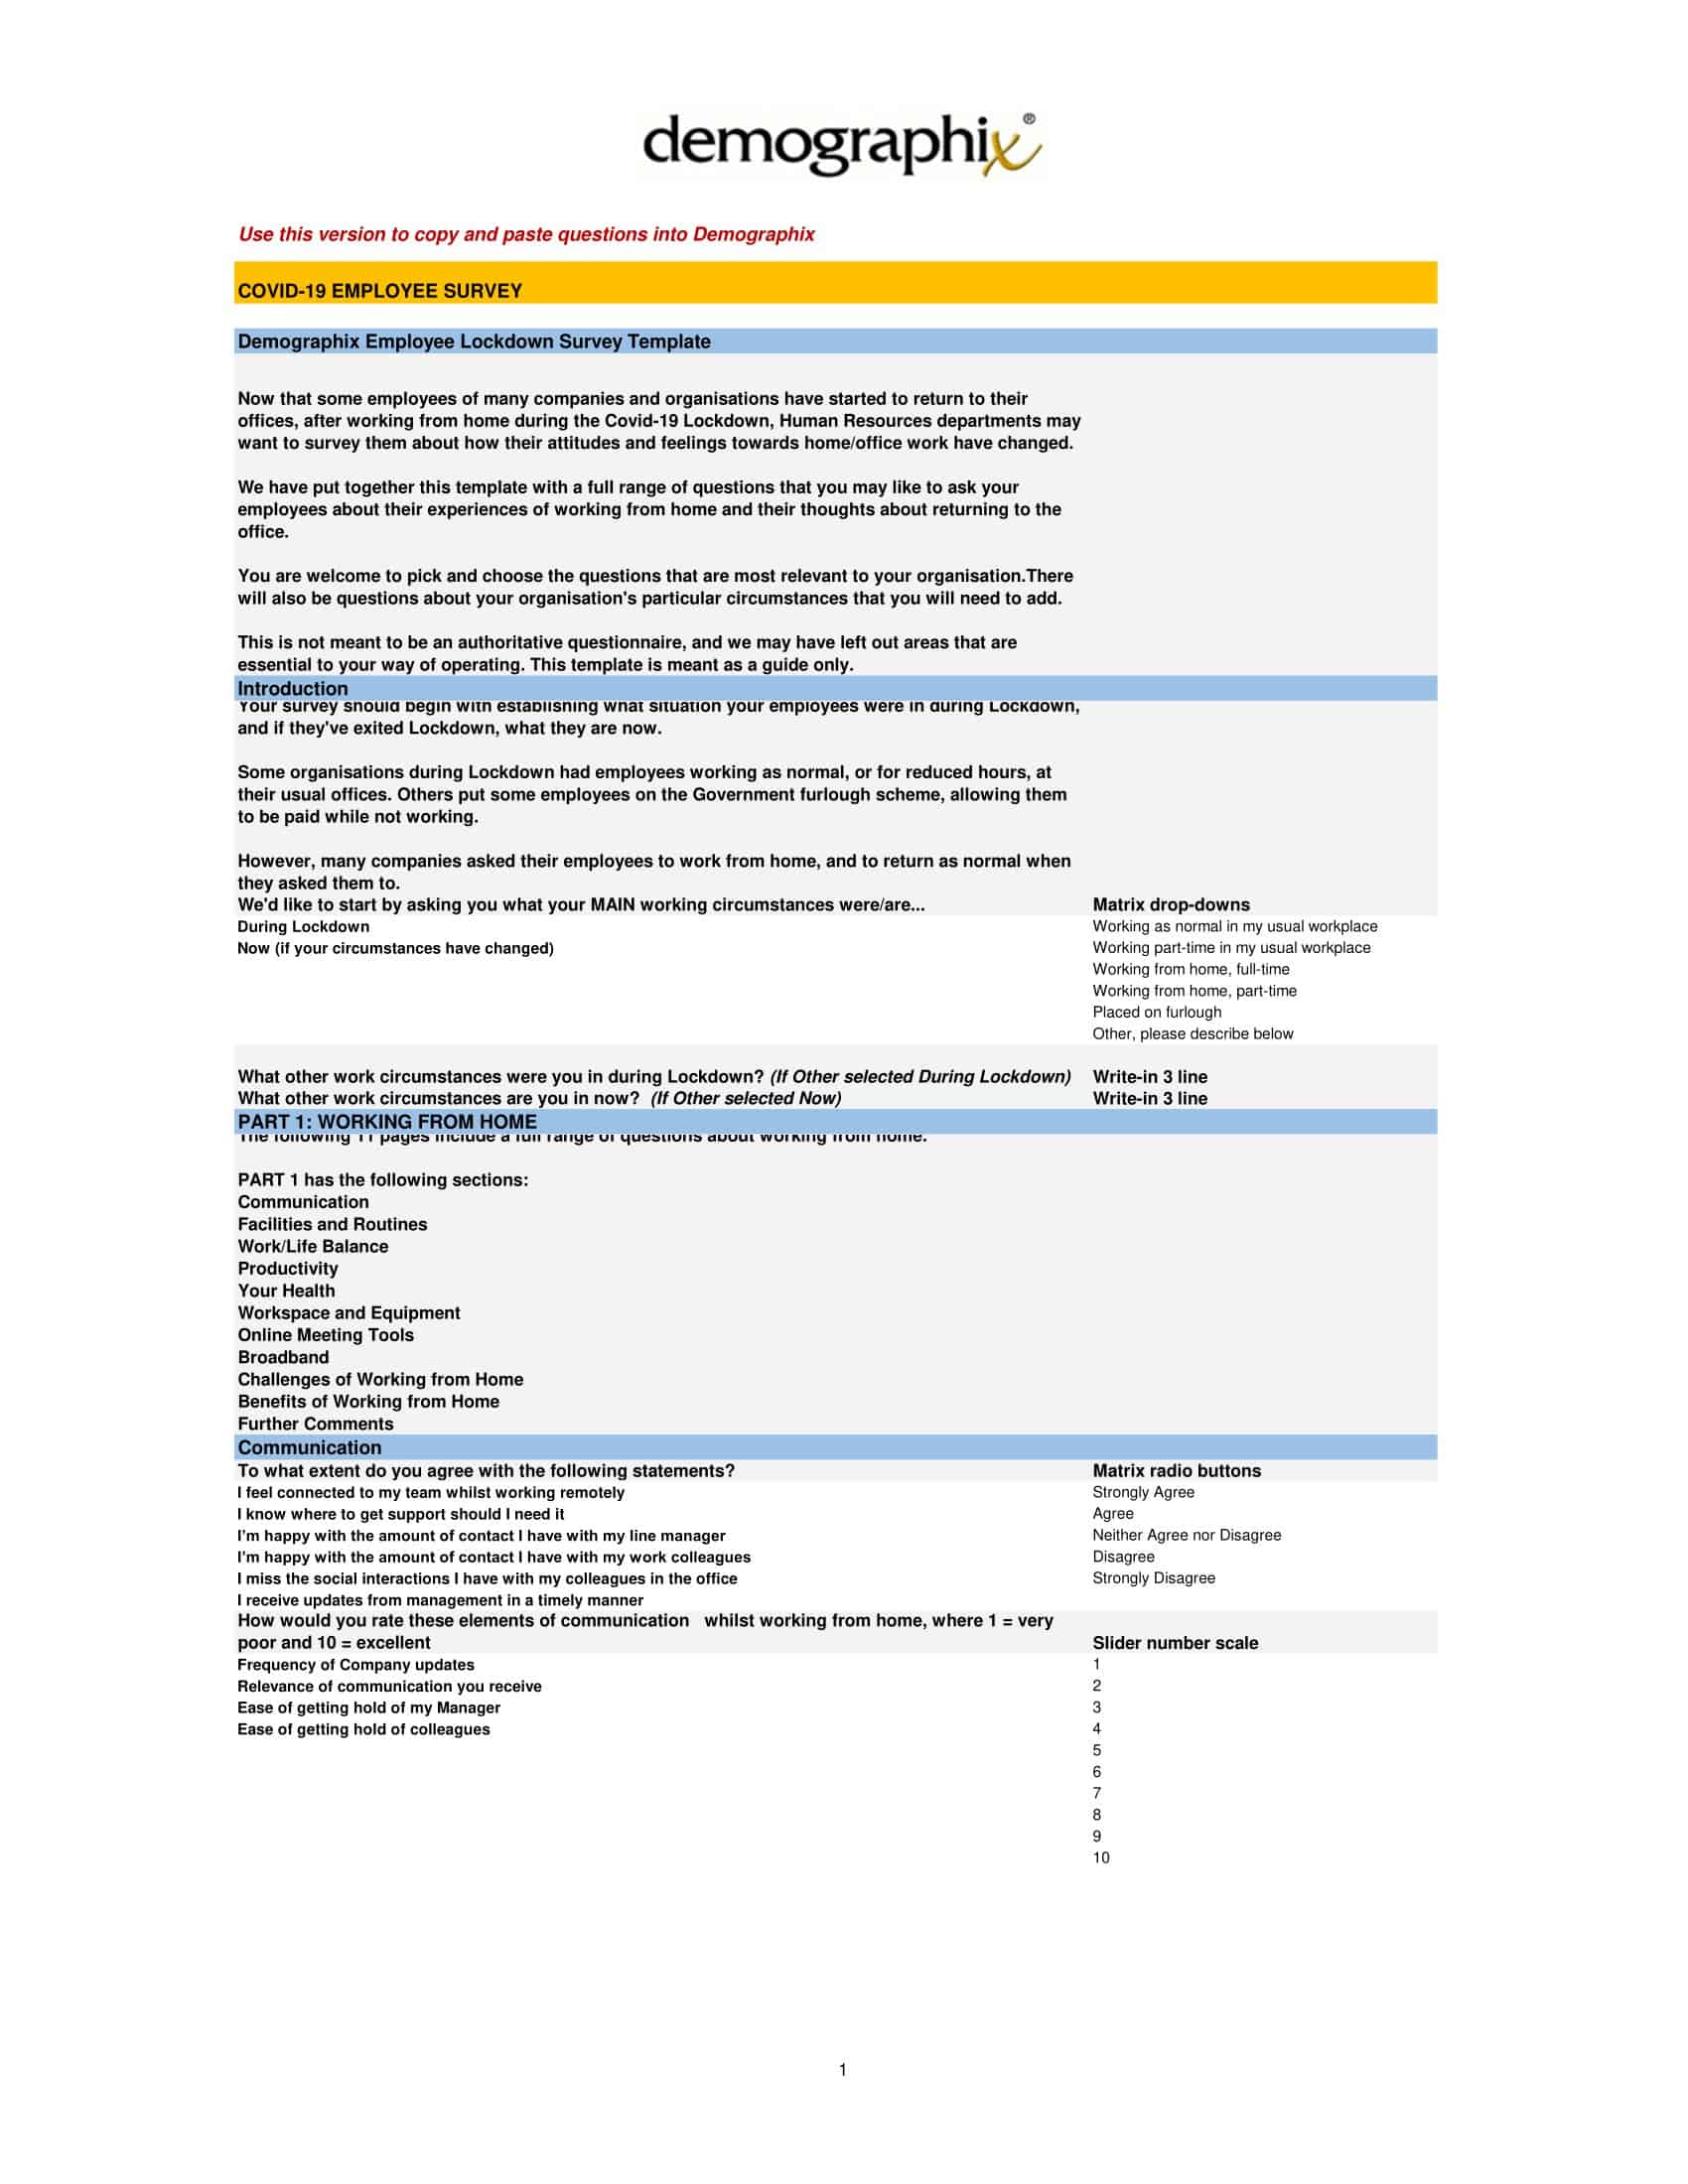
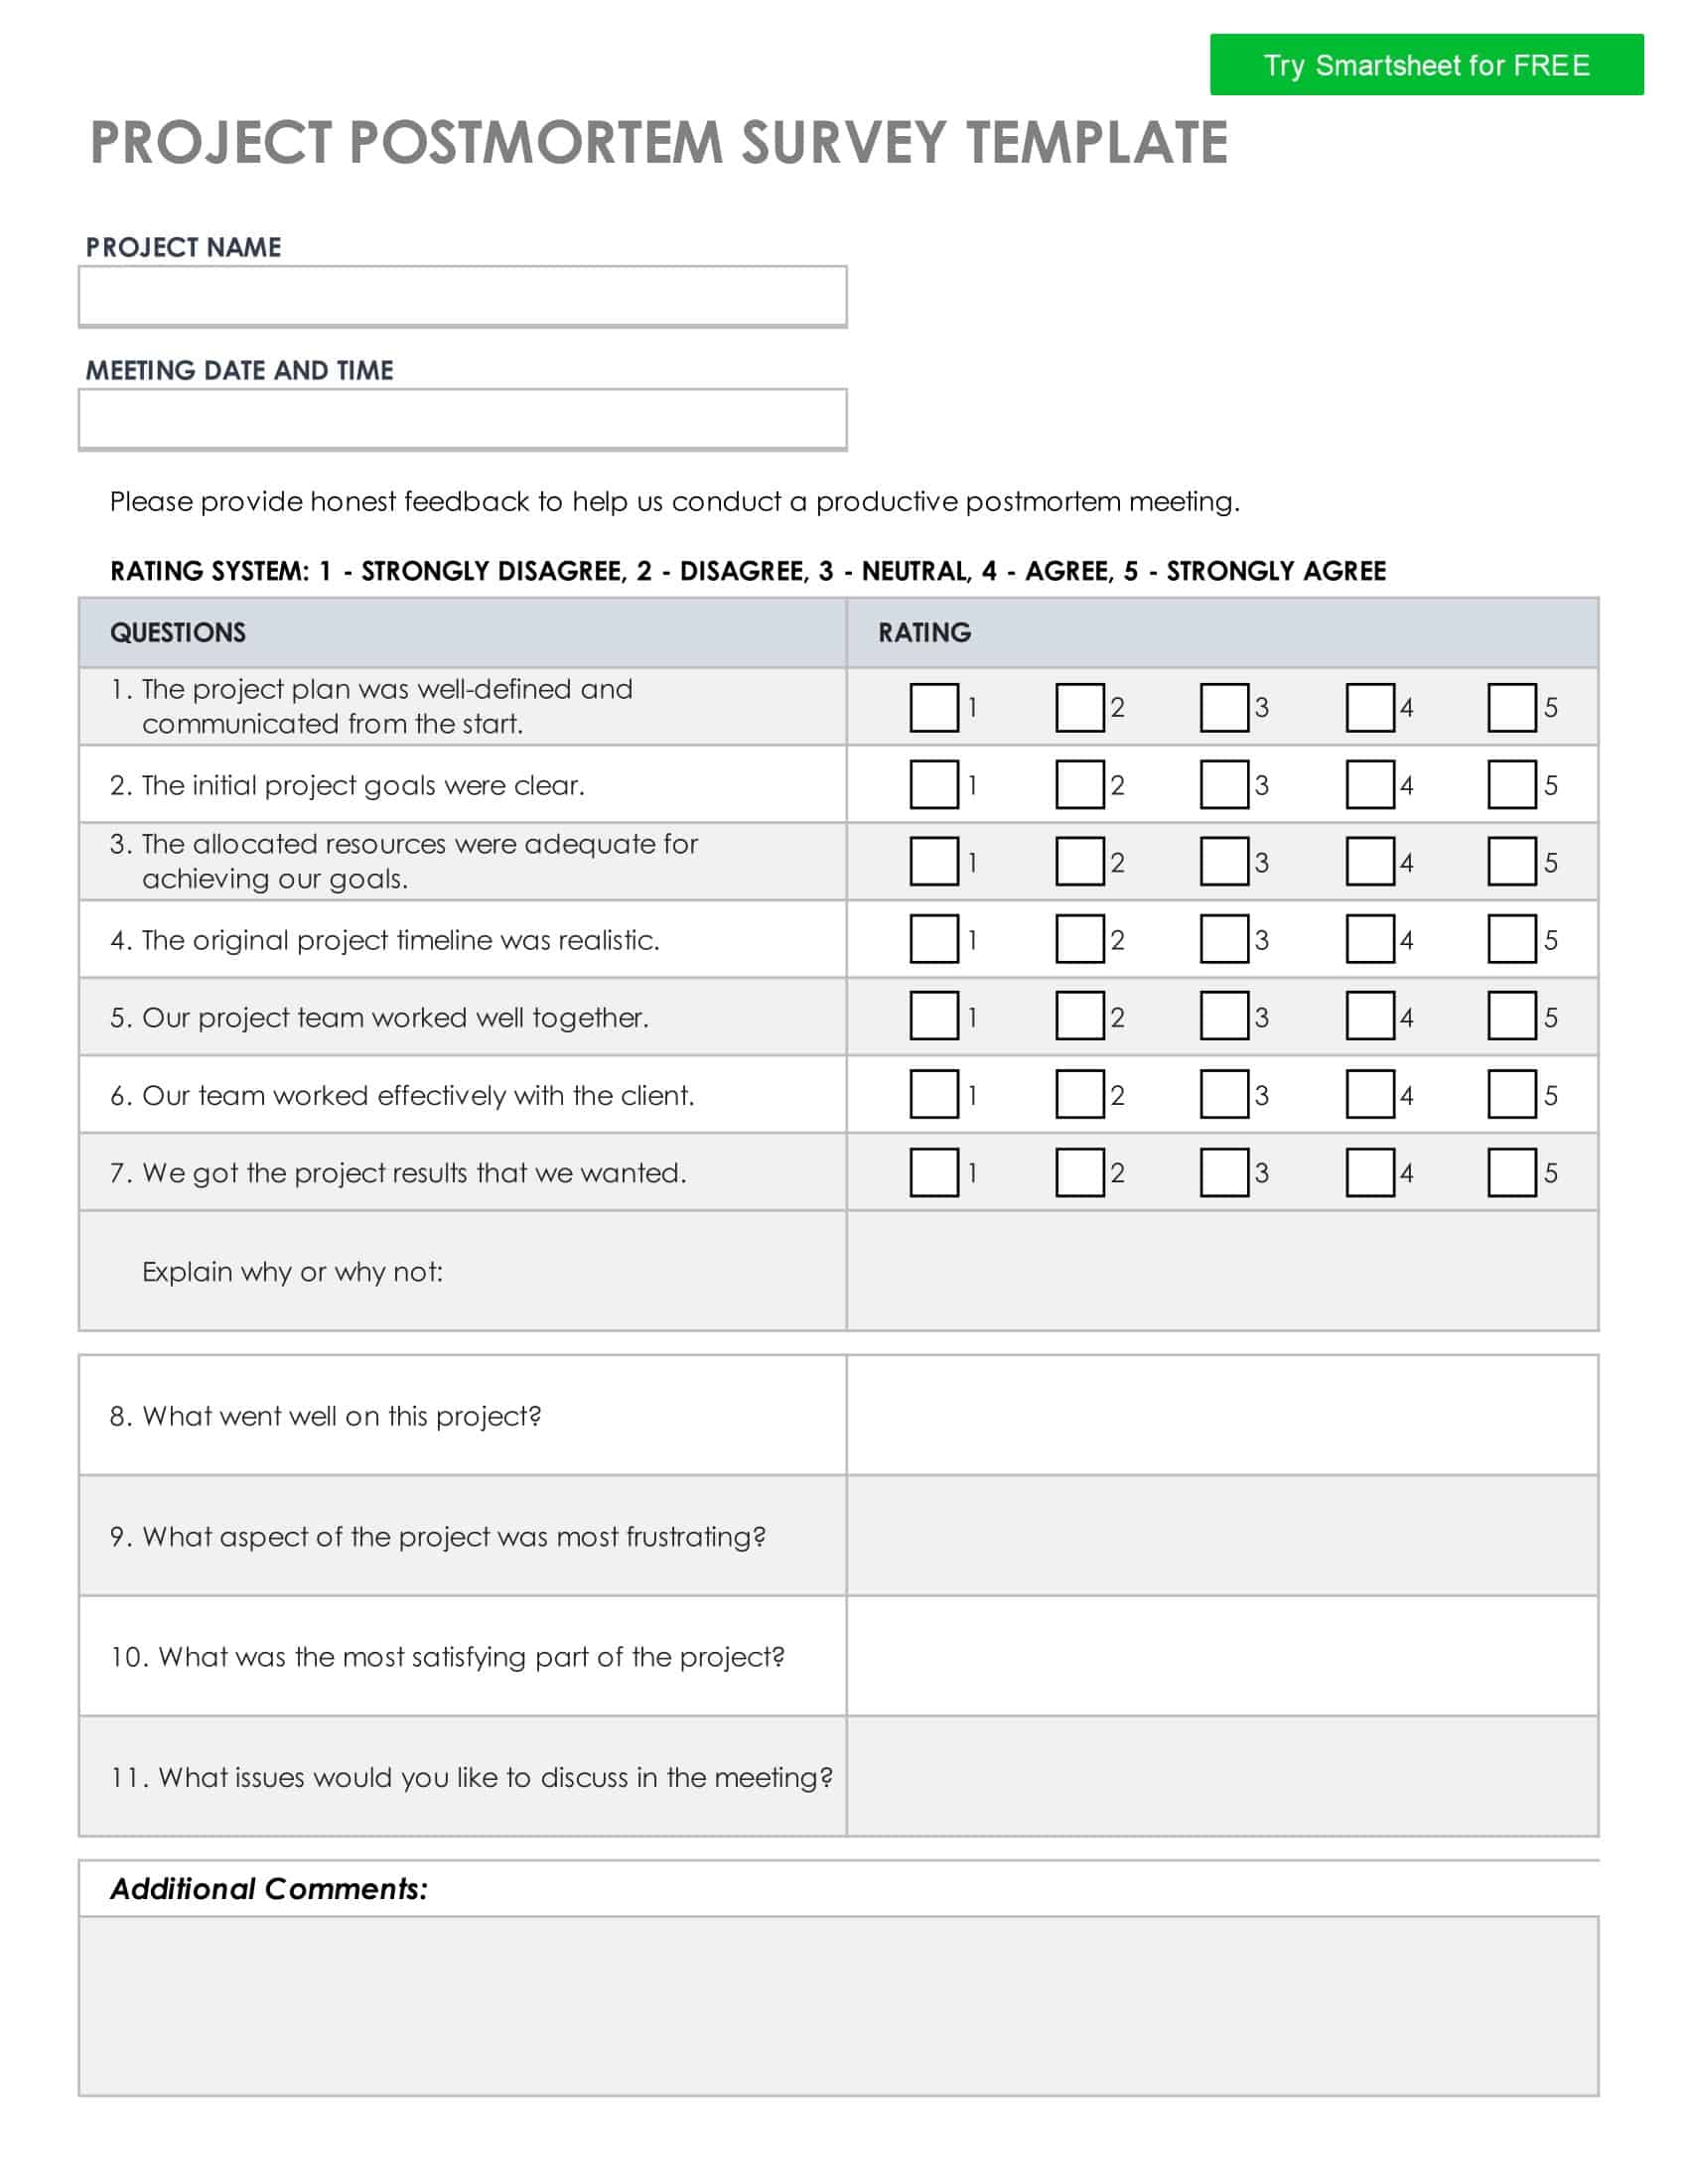
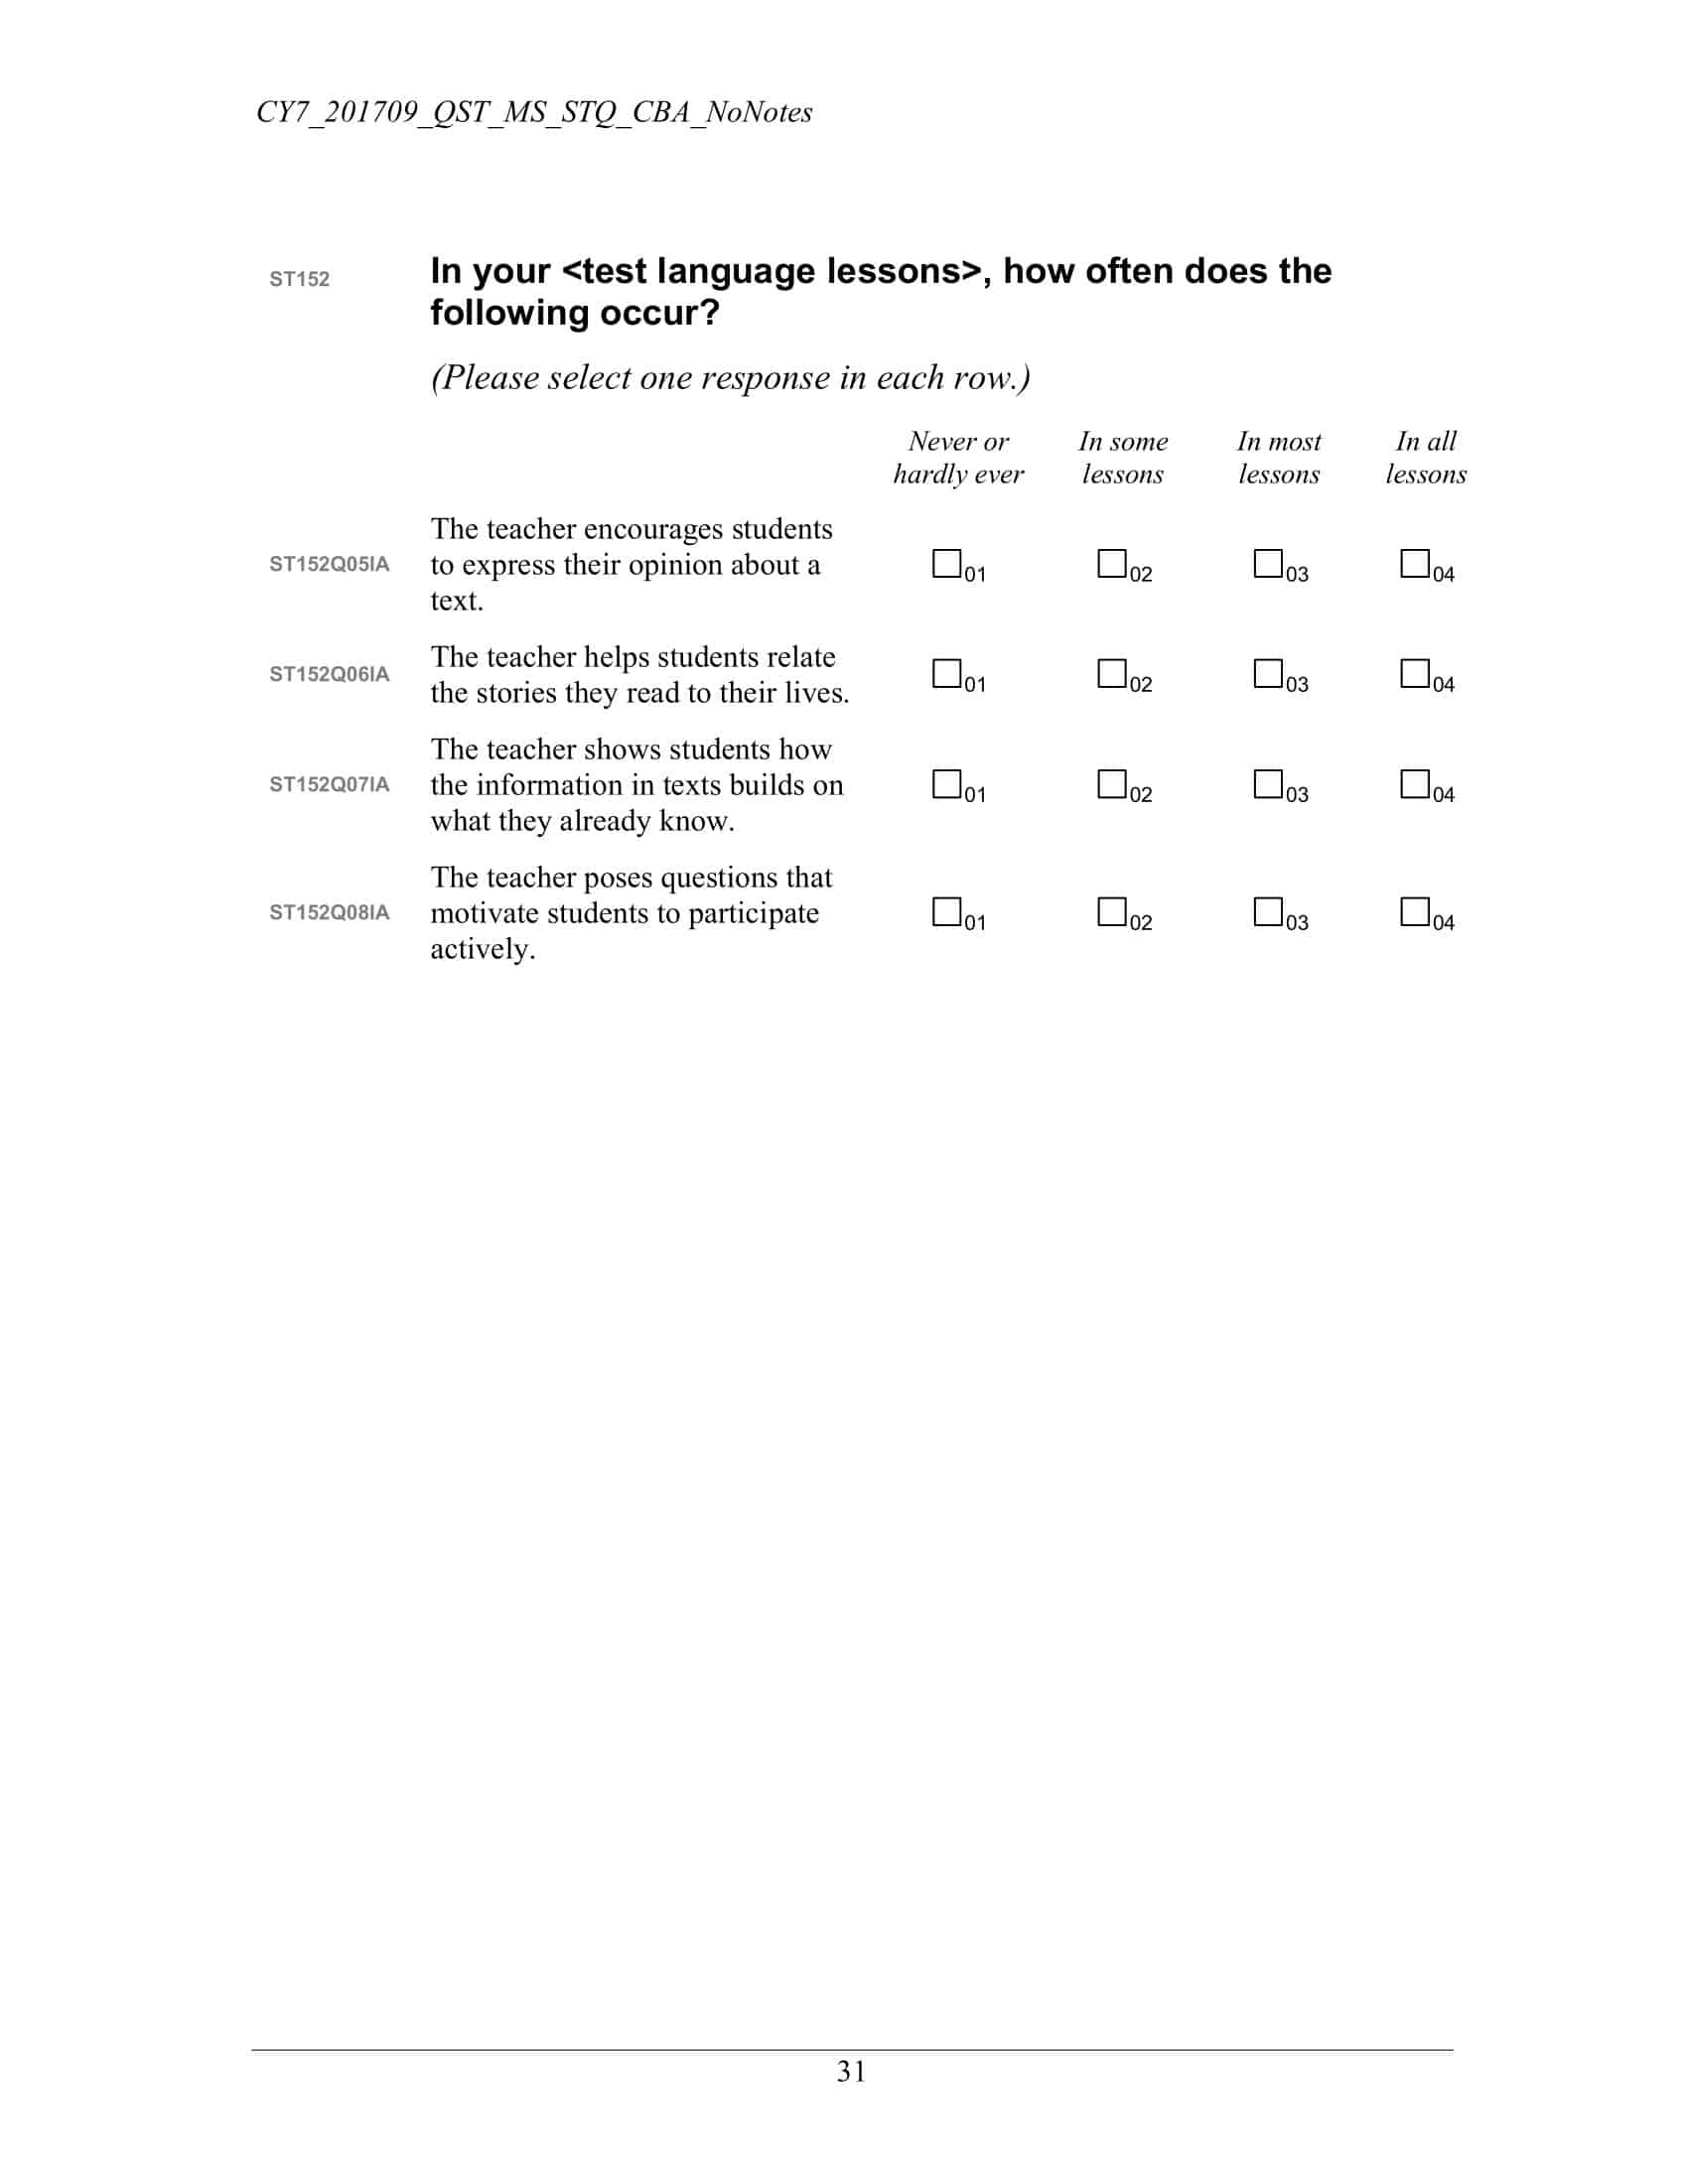
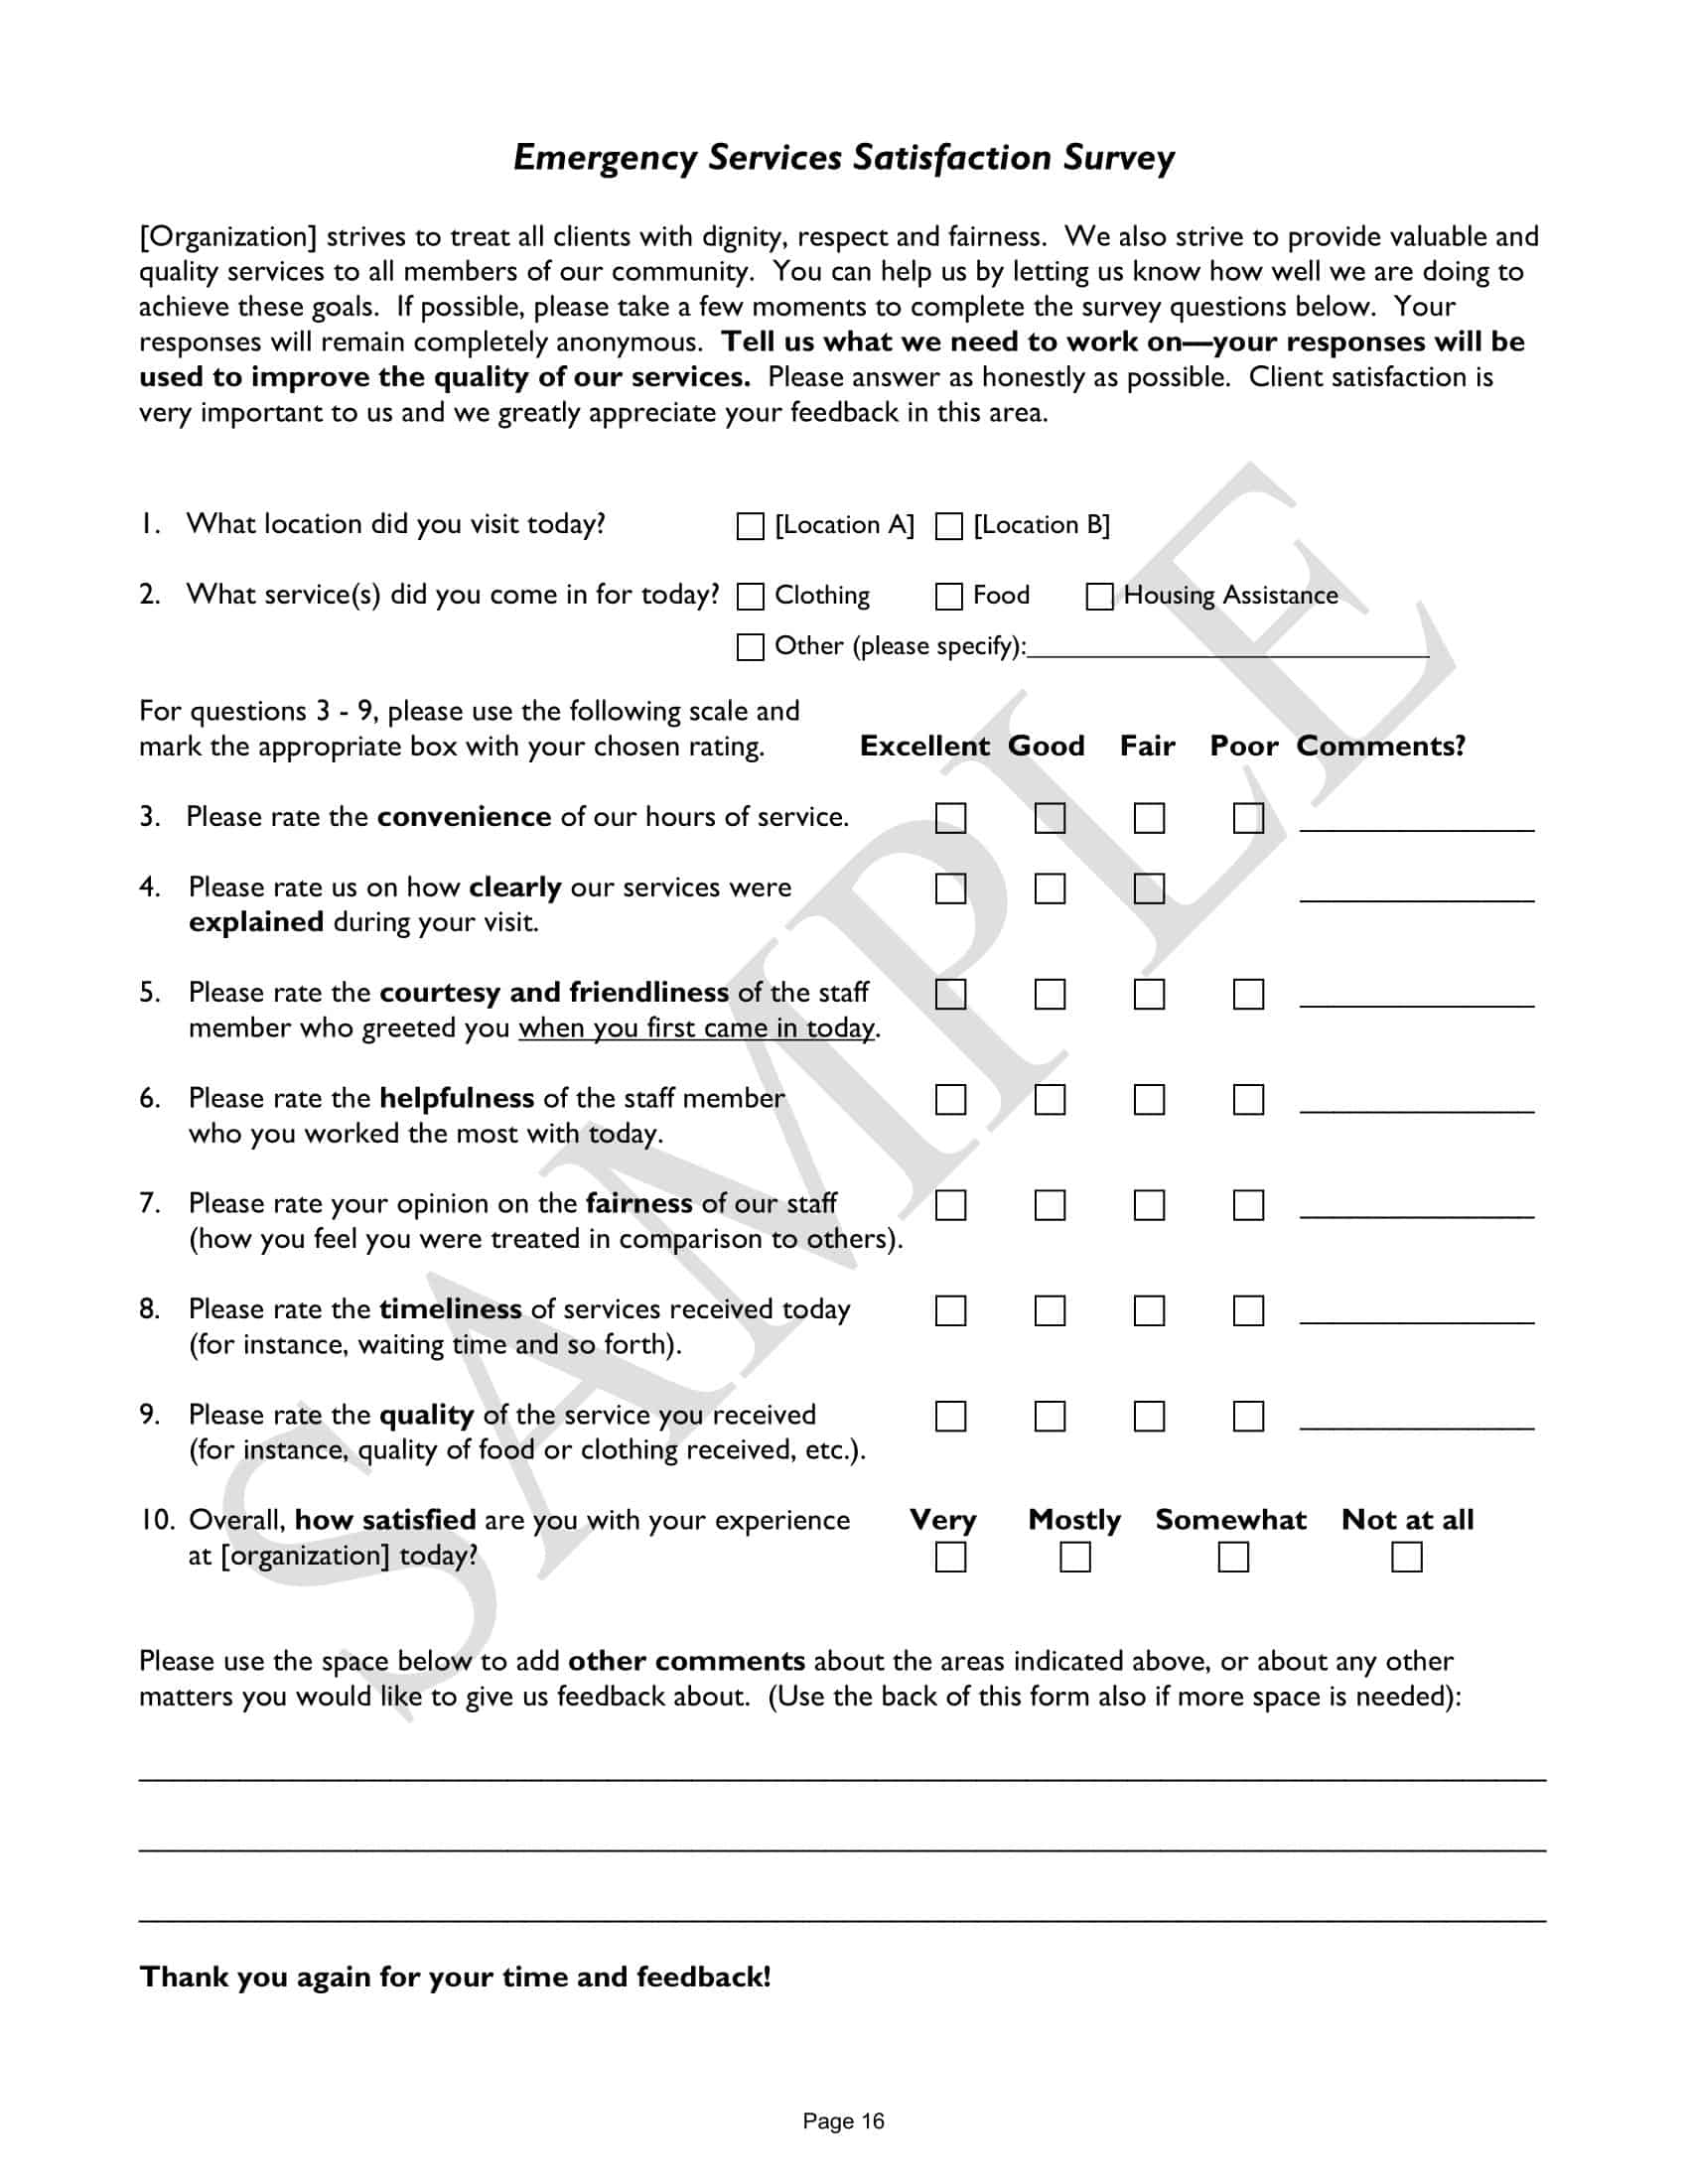
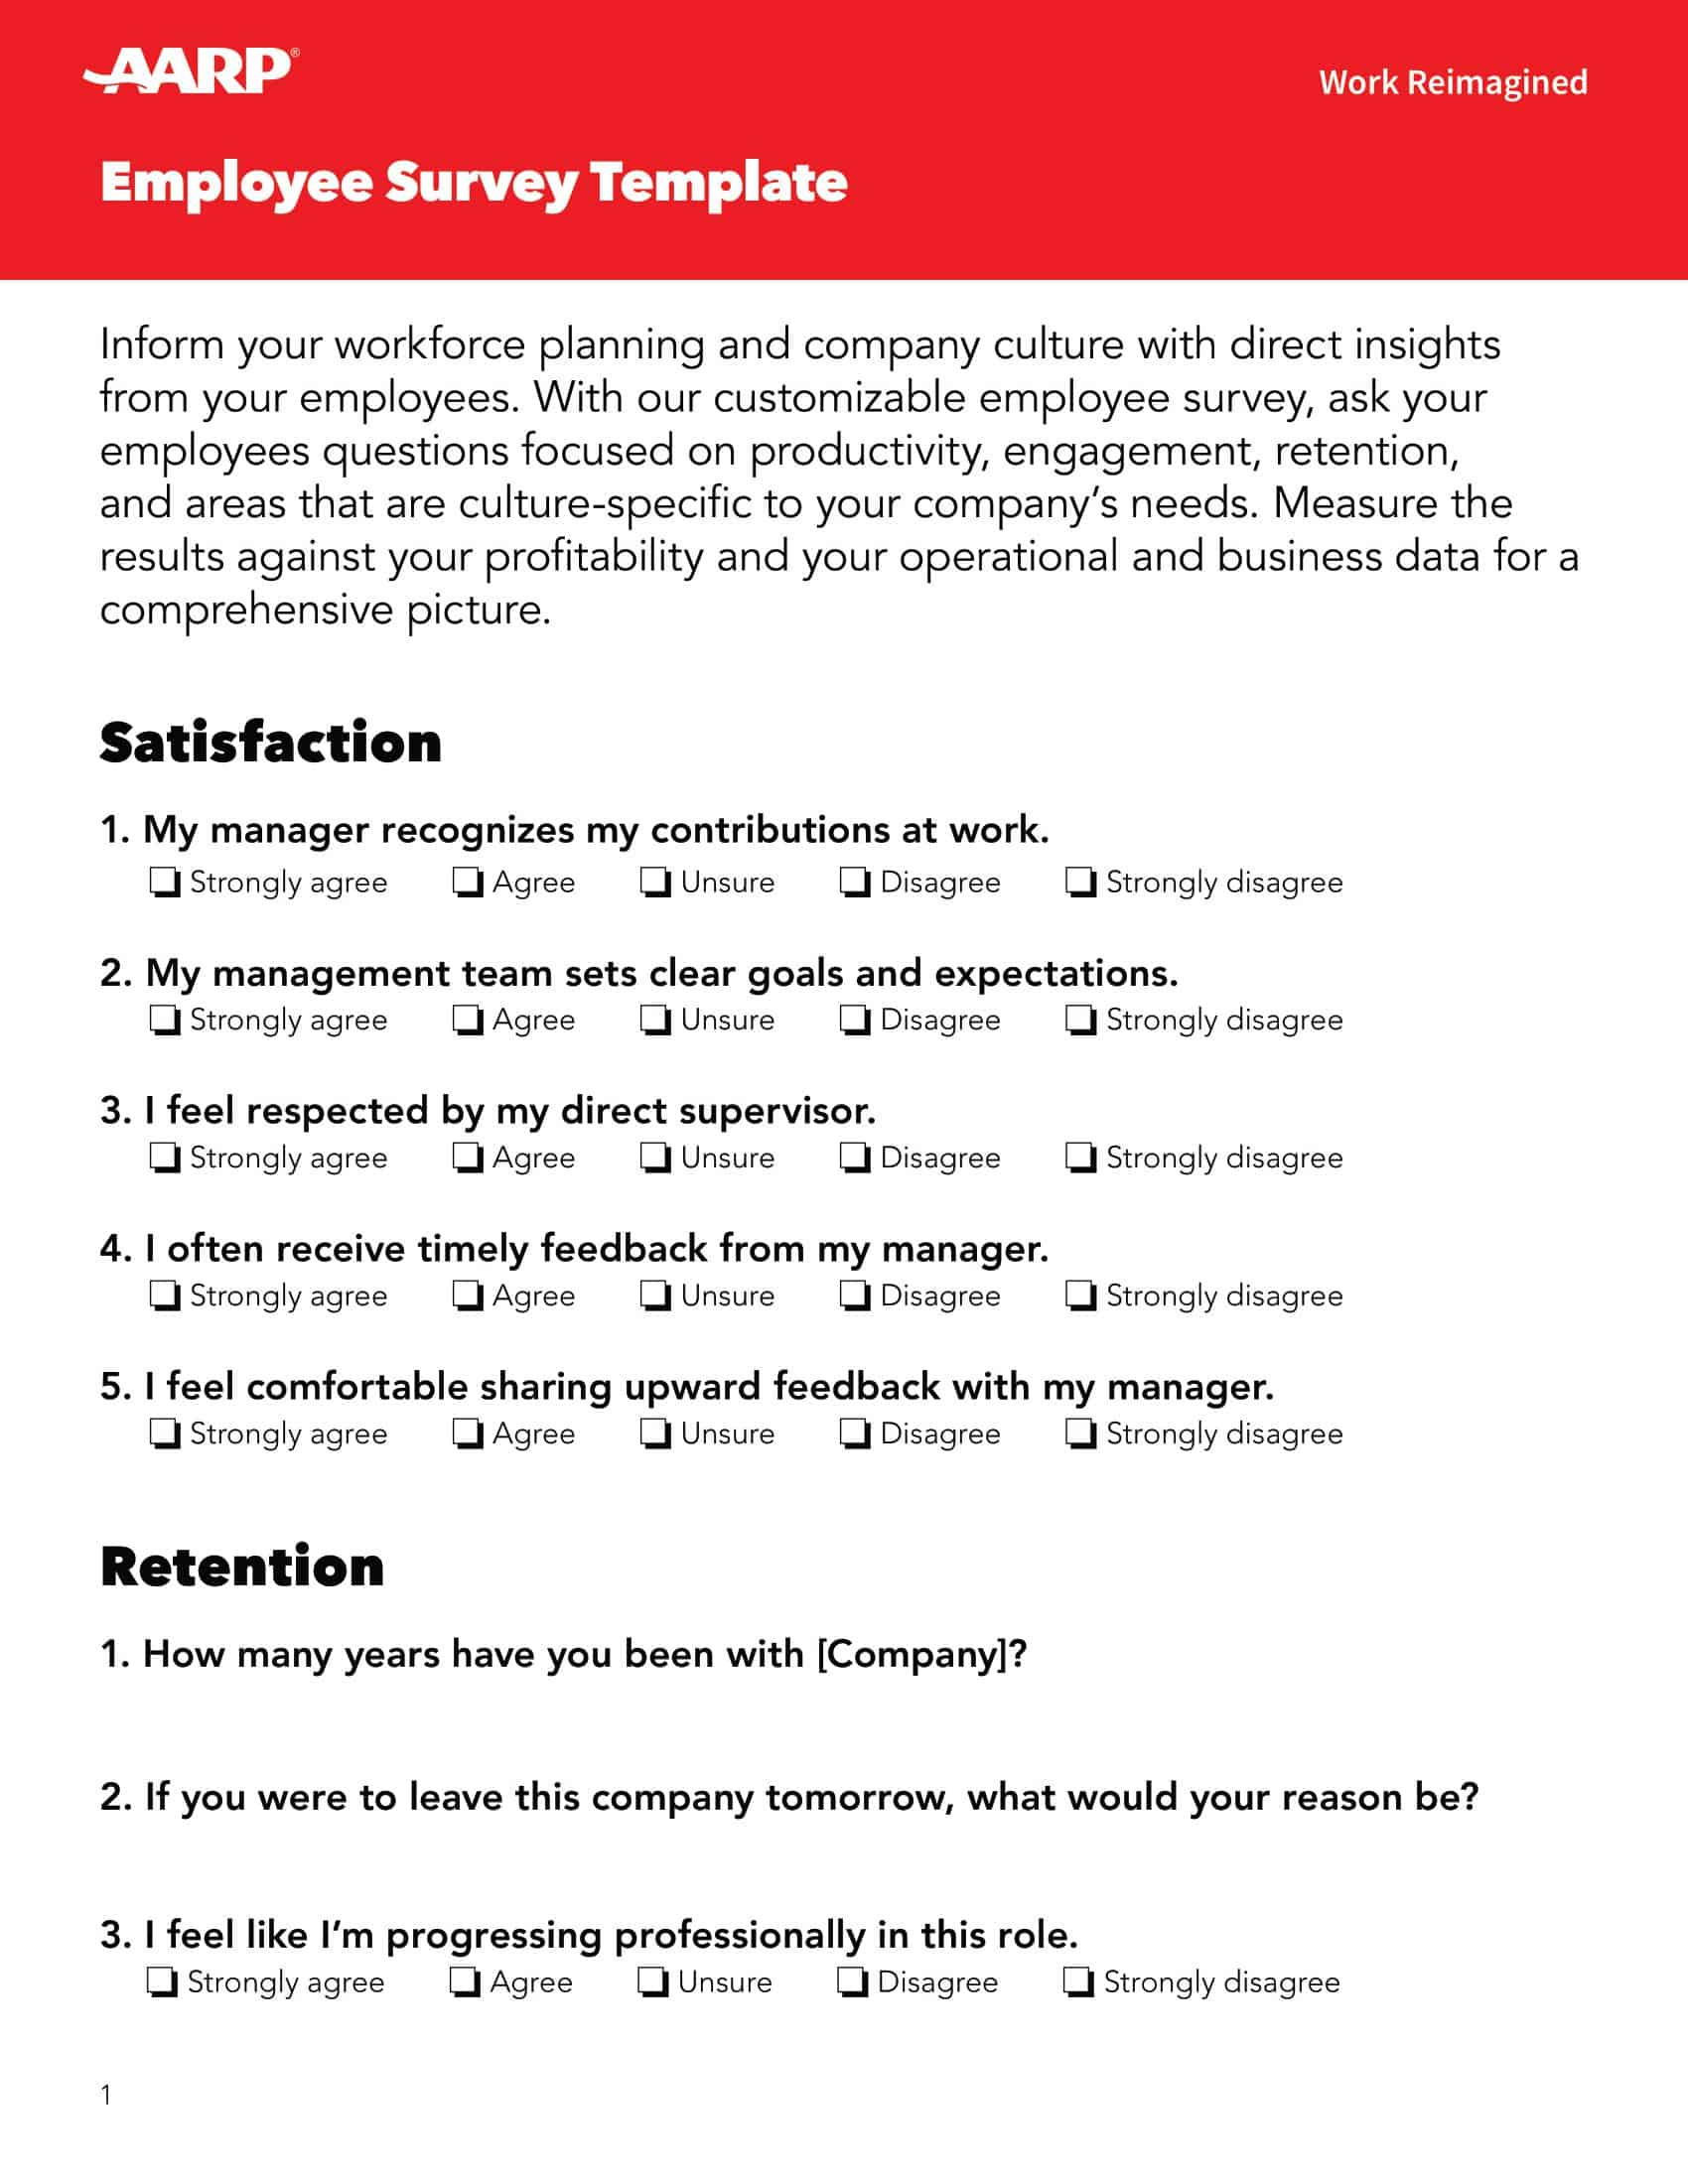
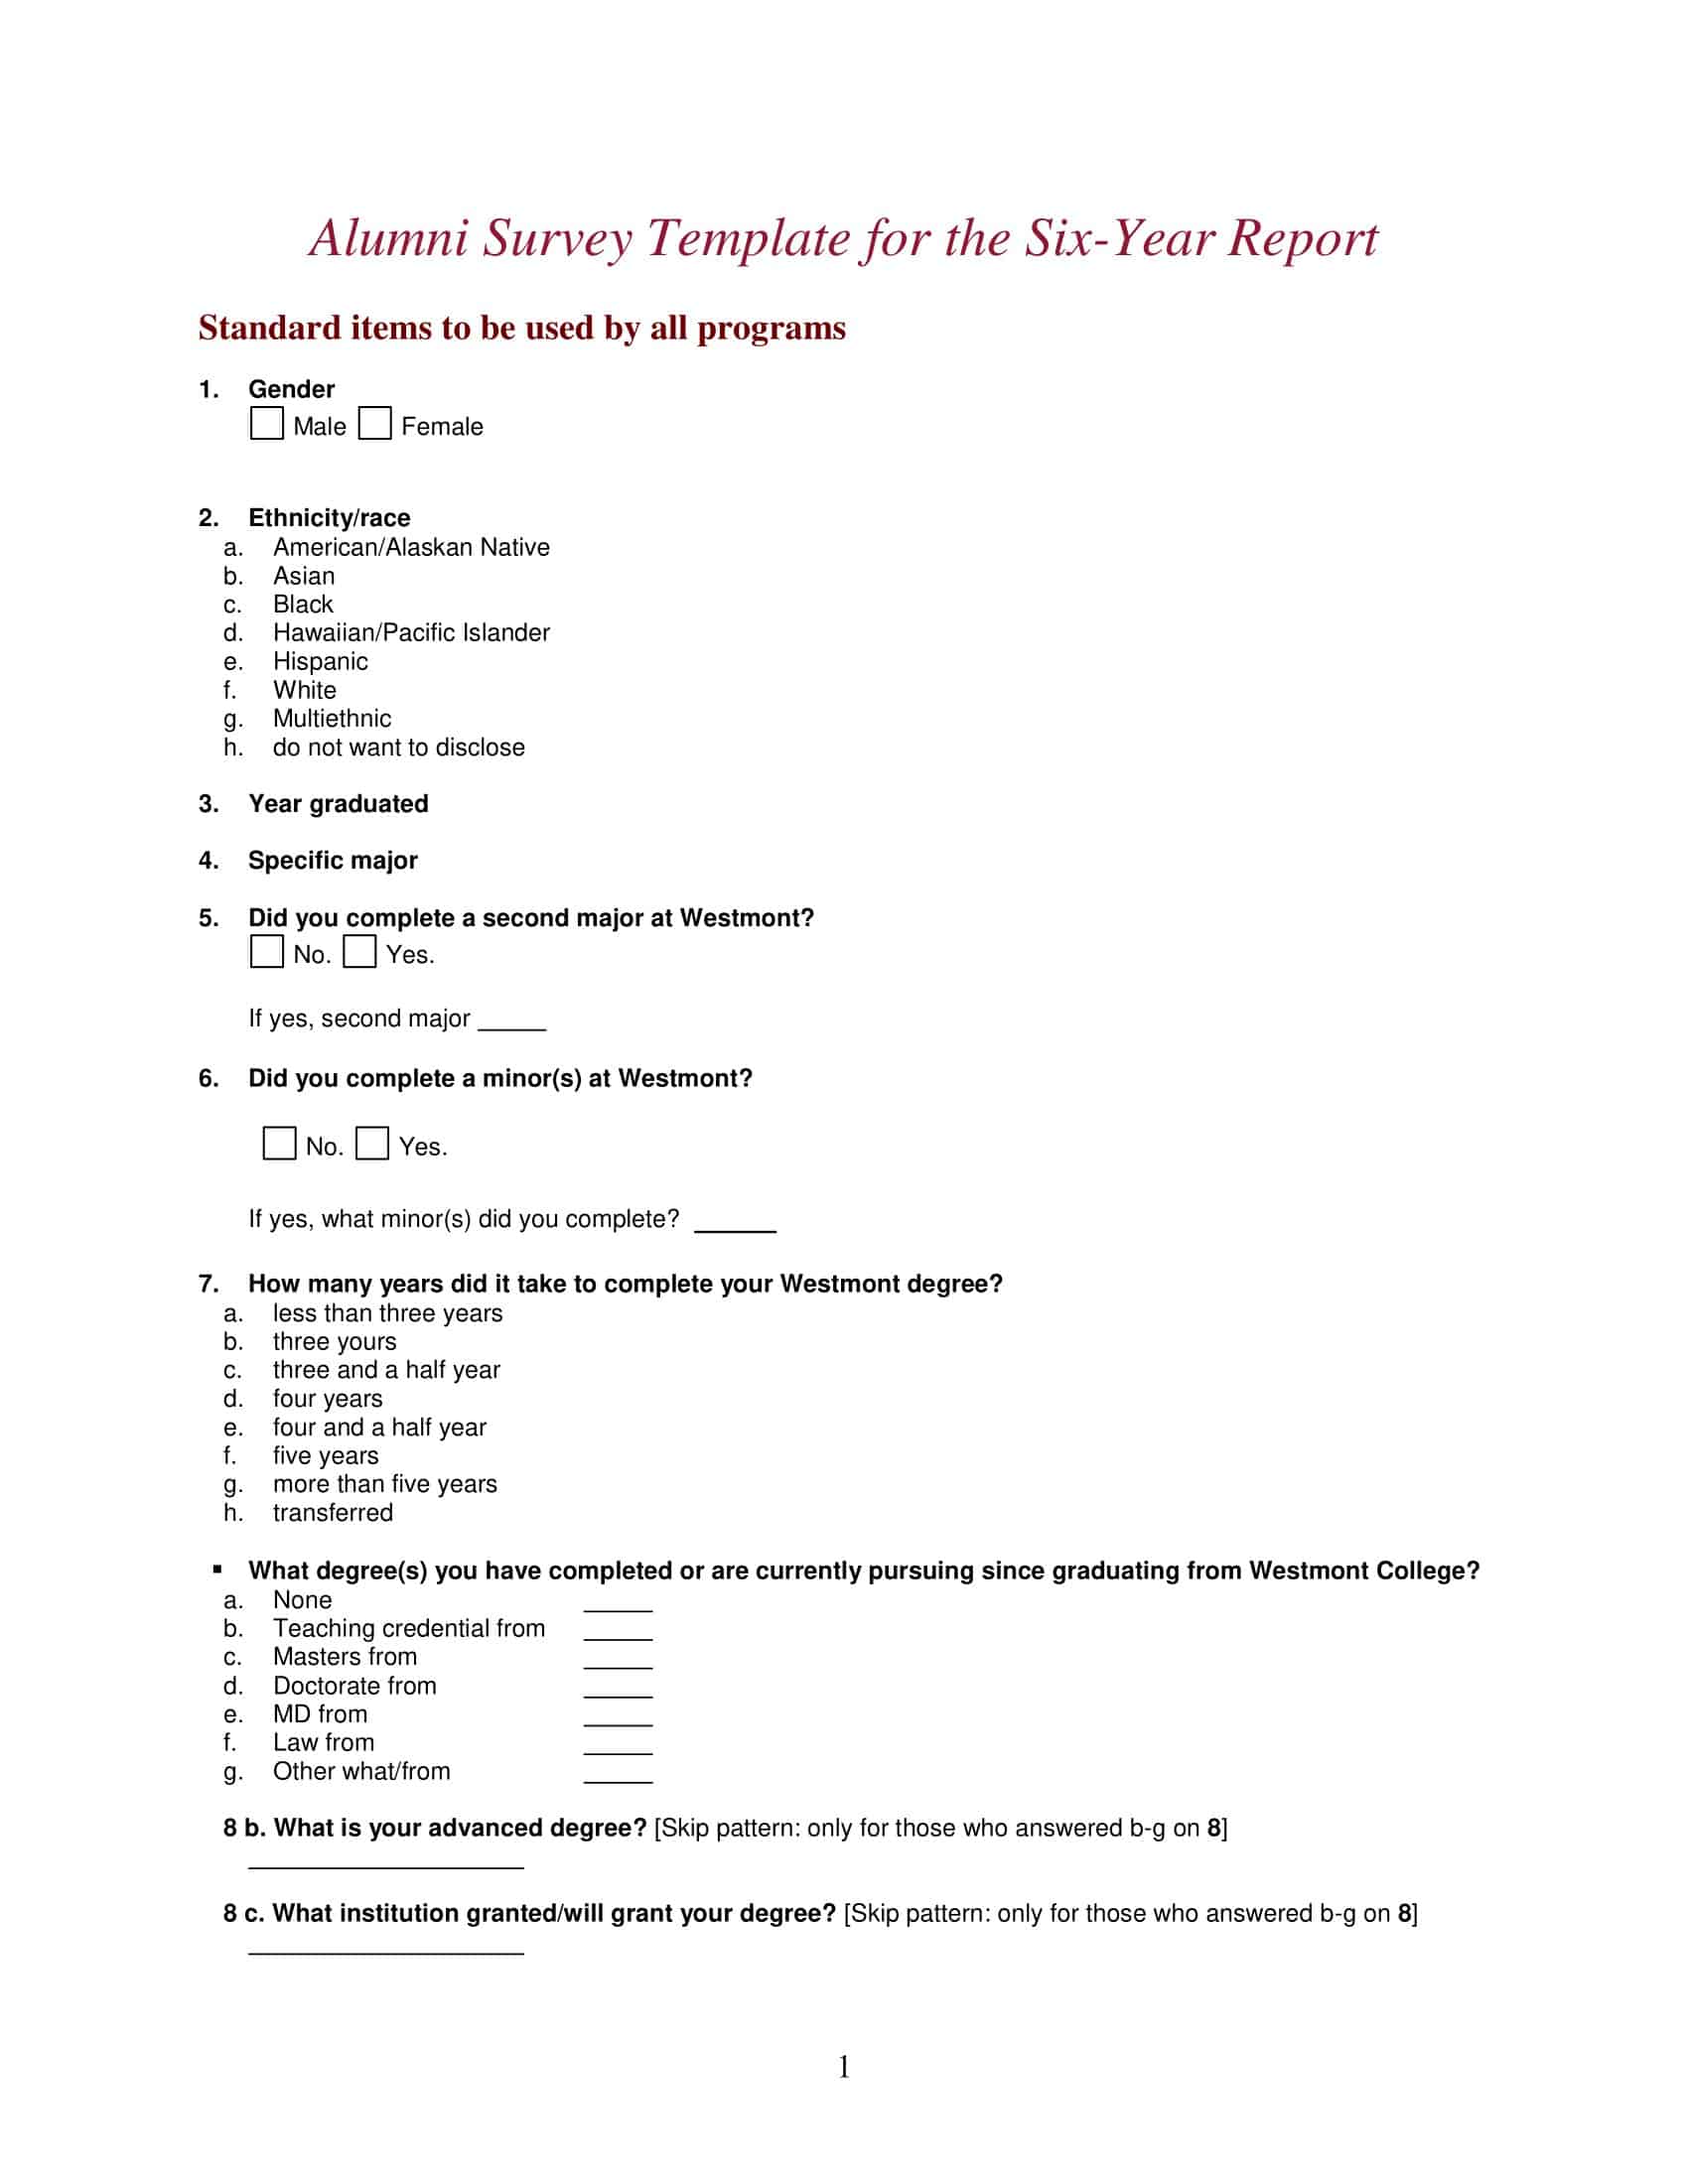
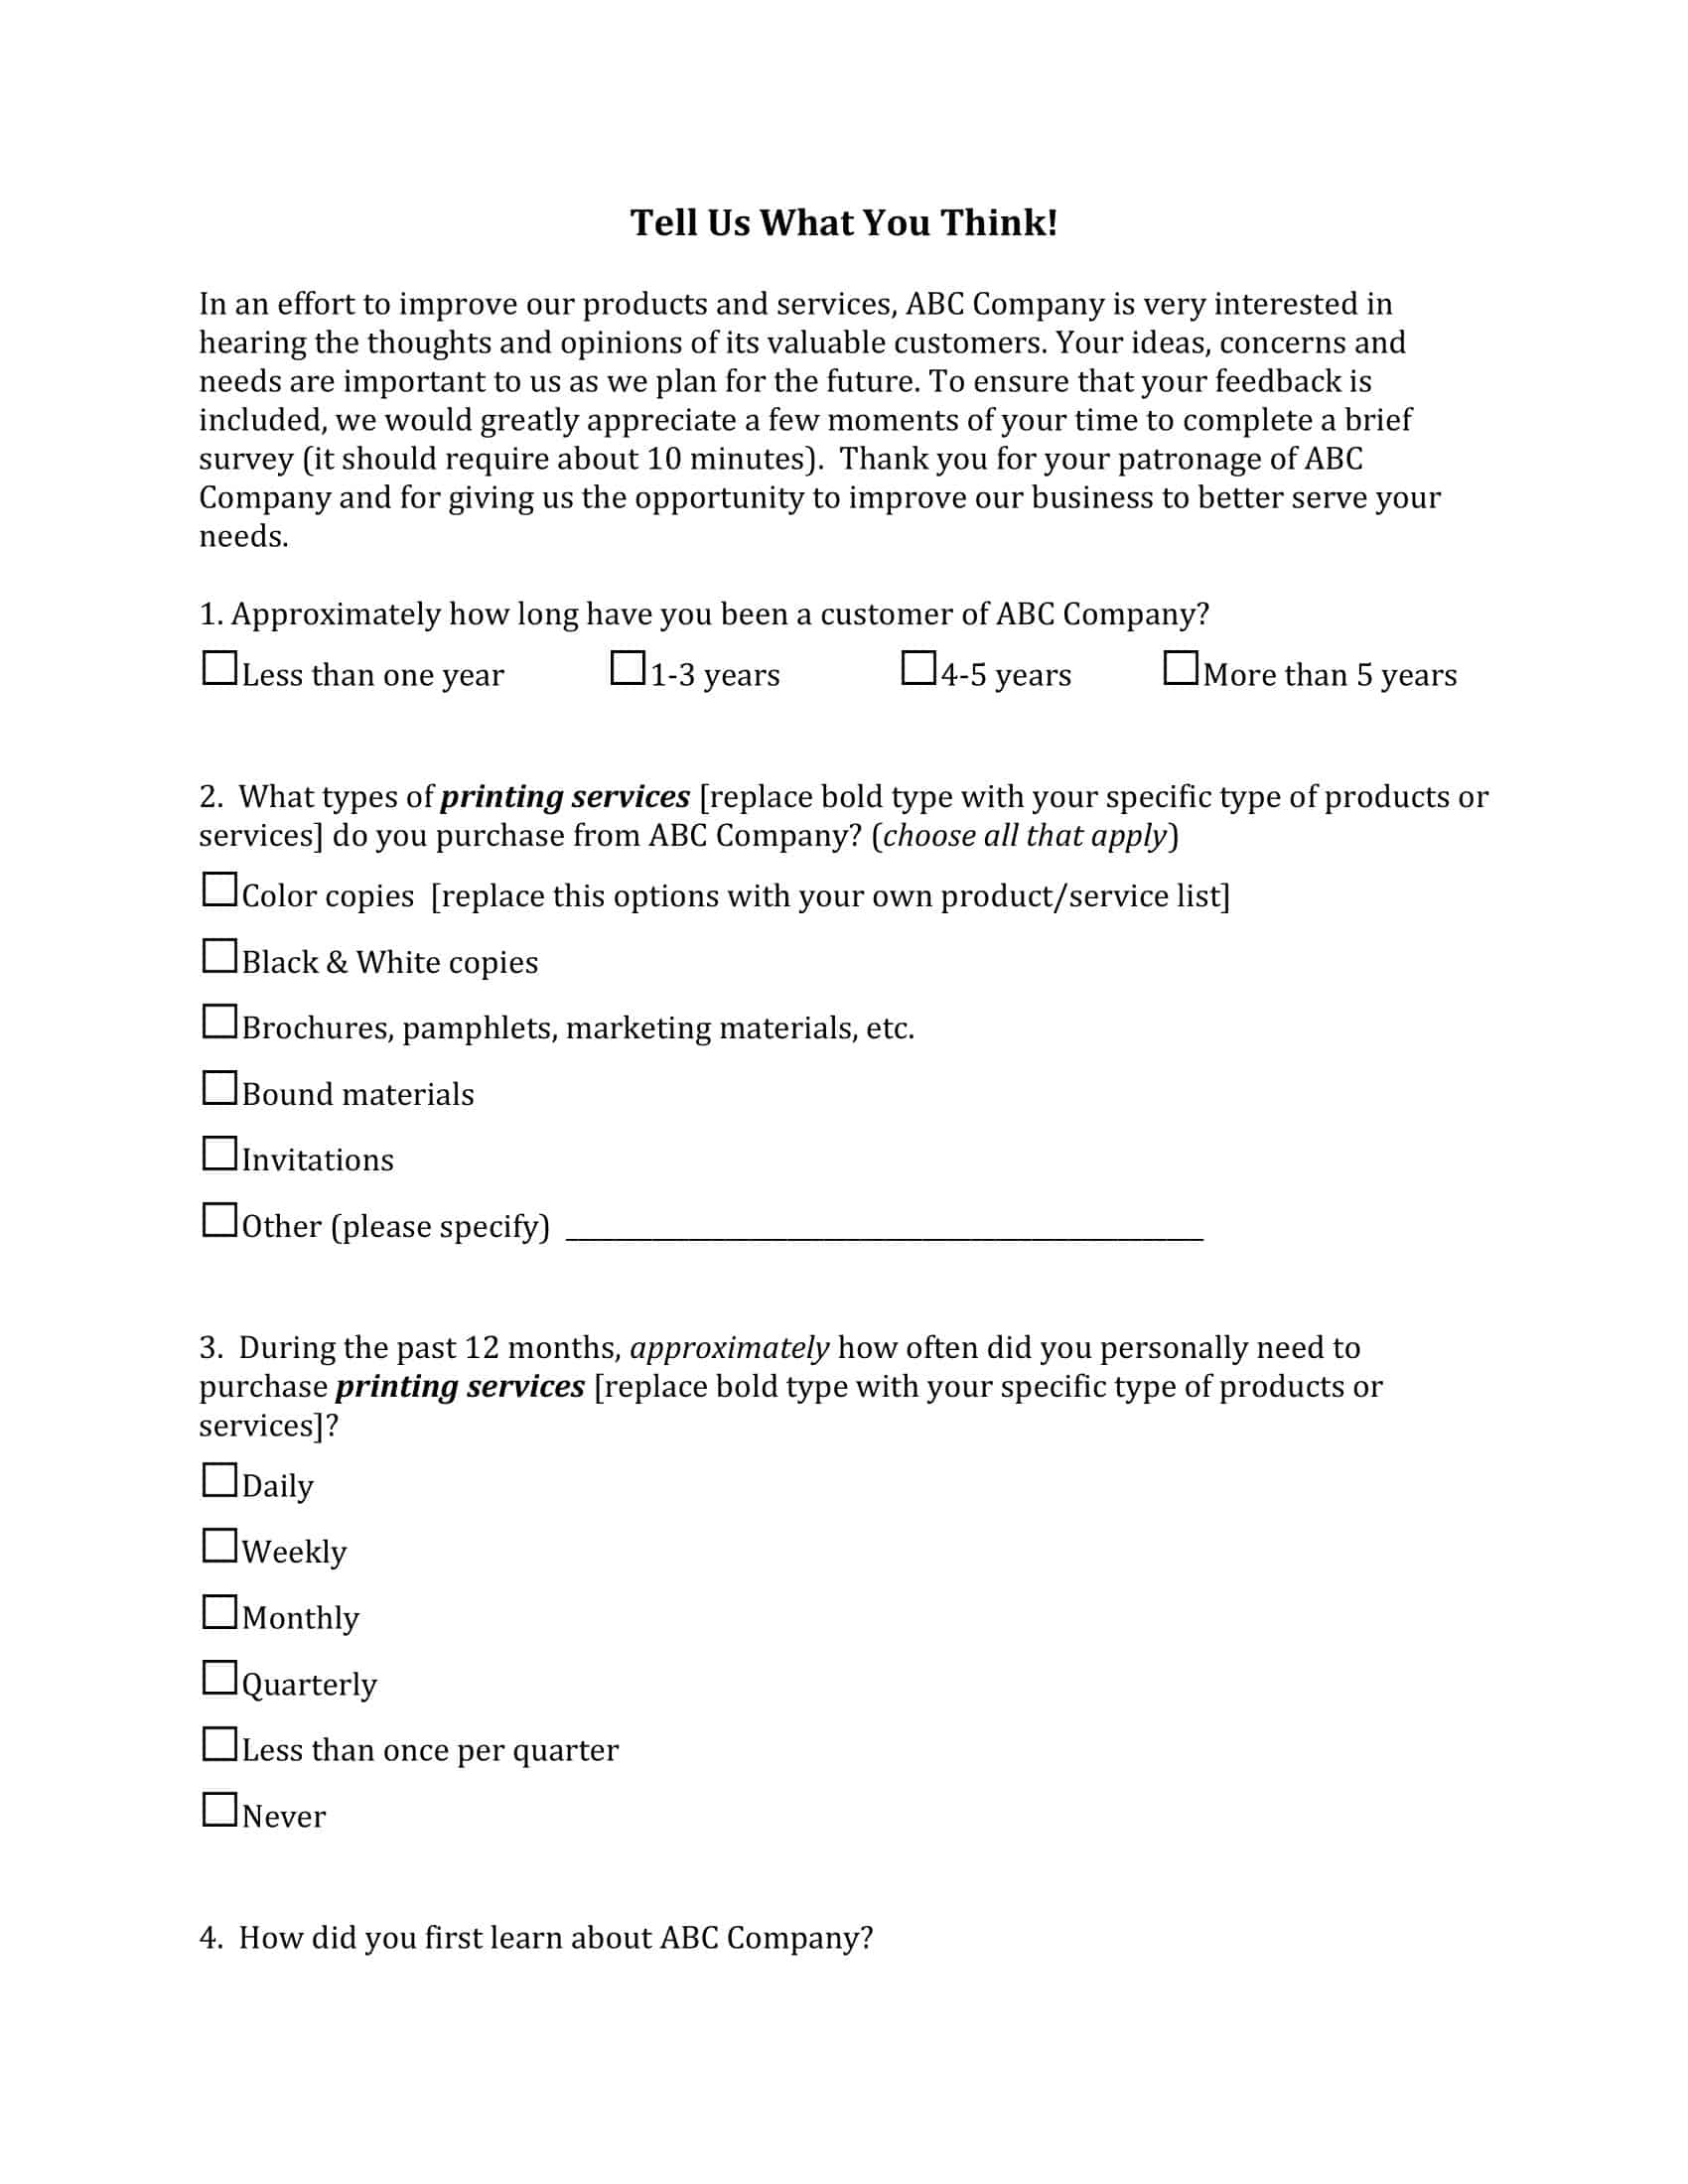
Surveys gather important feedback from people through questionnaires. Well-designed surveys lead to quality insights. Survey templates provide effective formats for creating surveys.
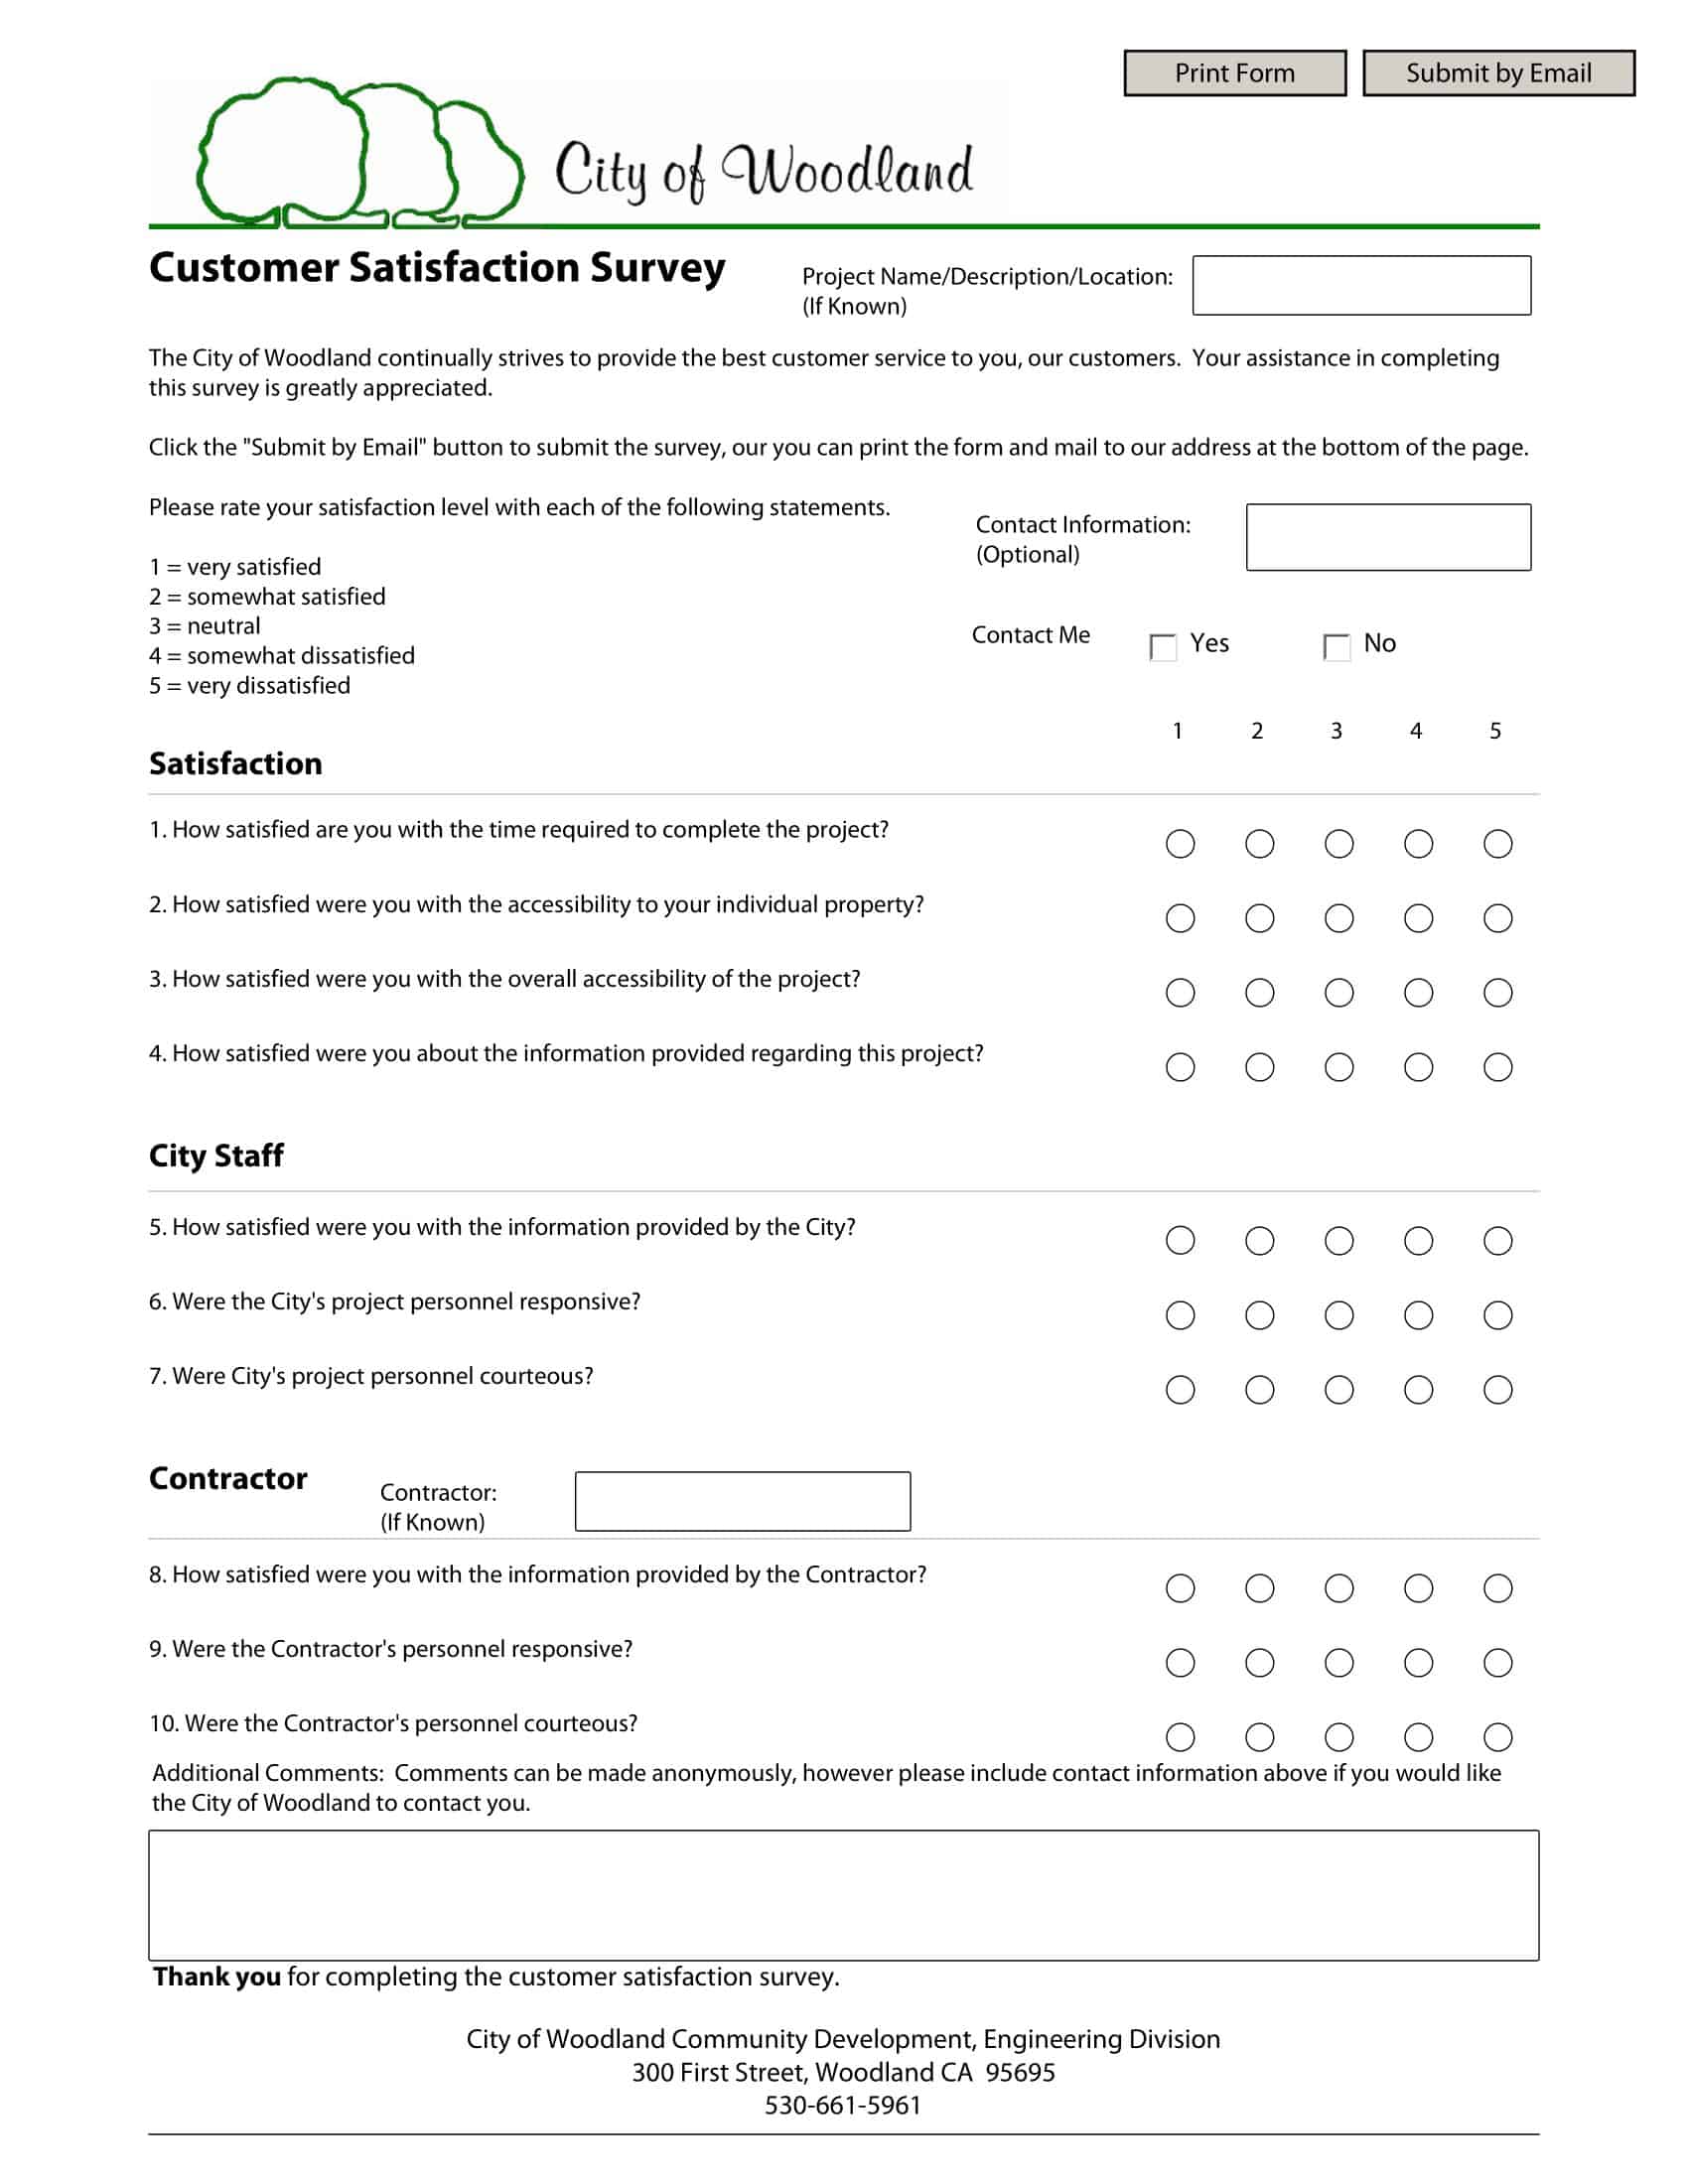
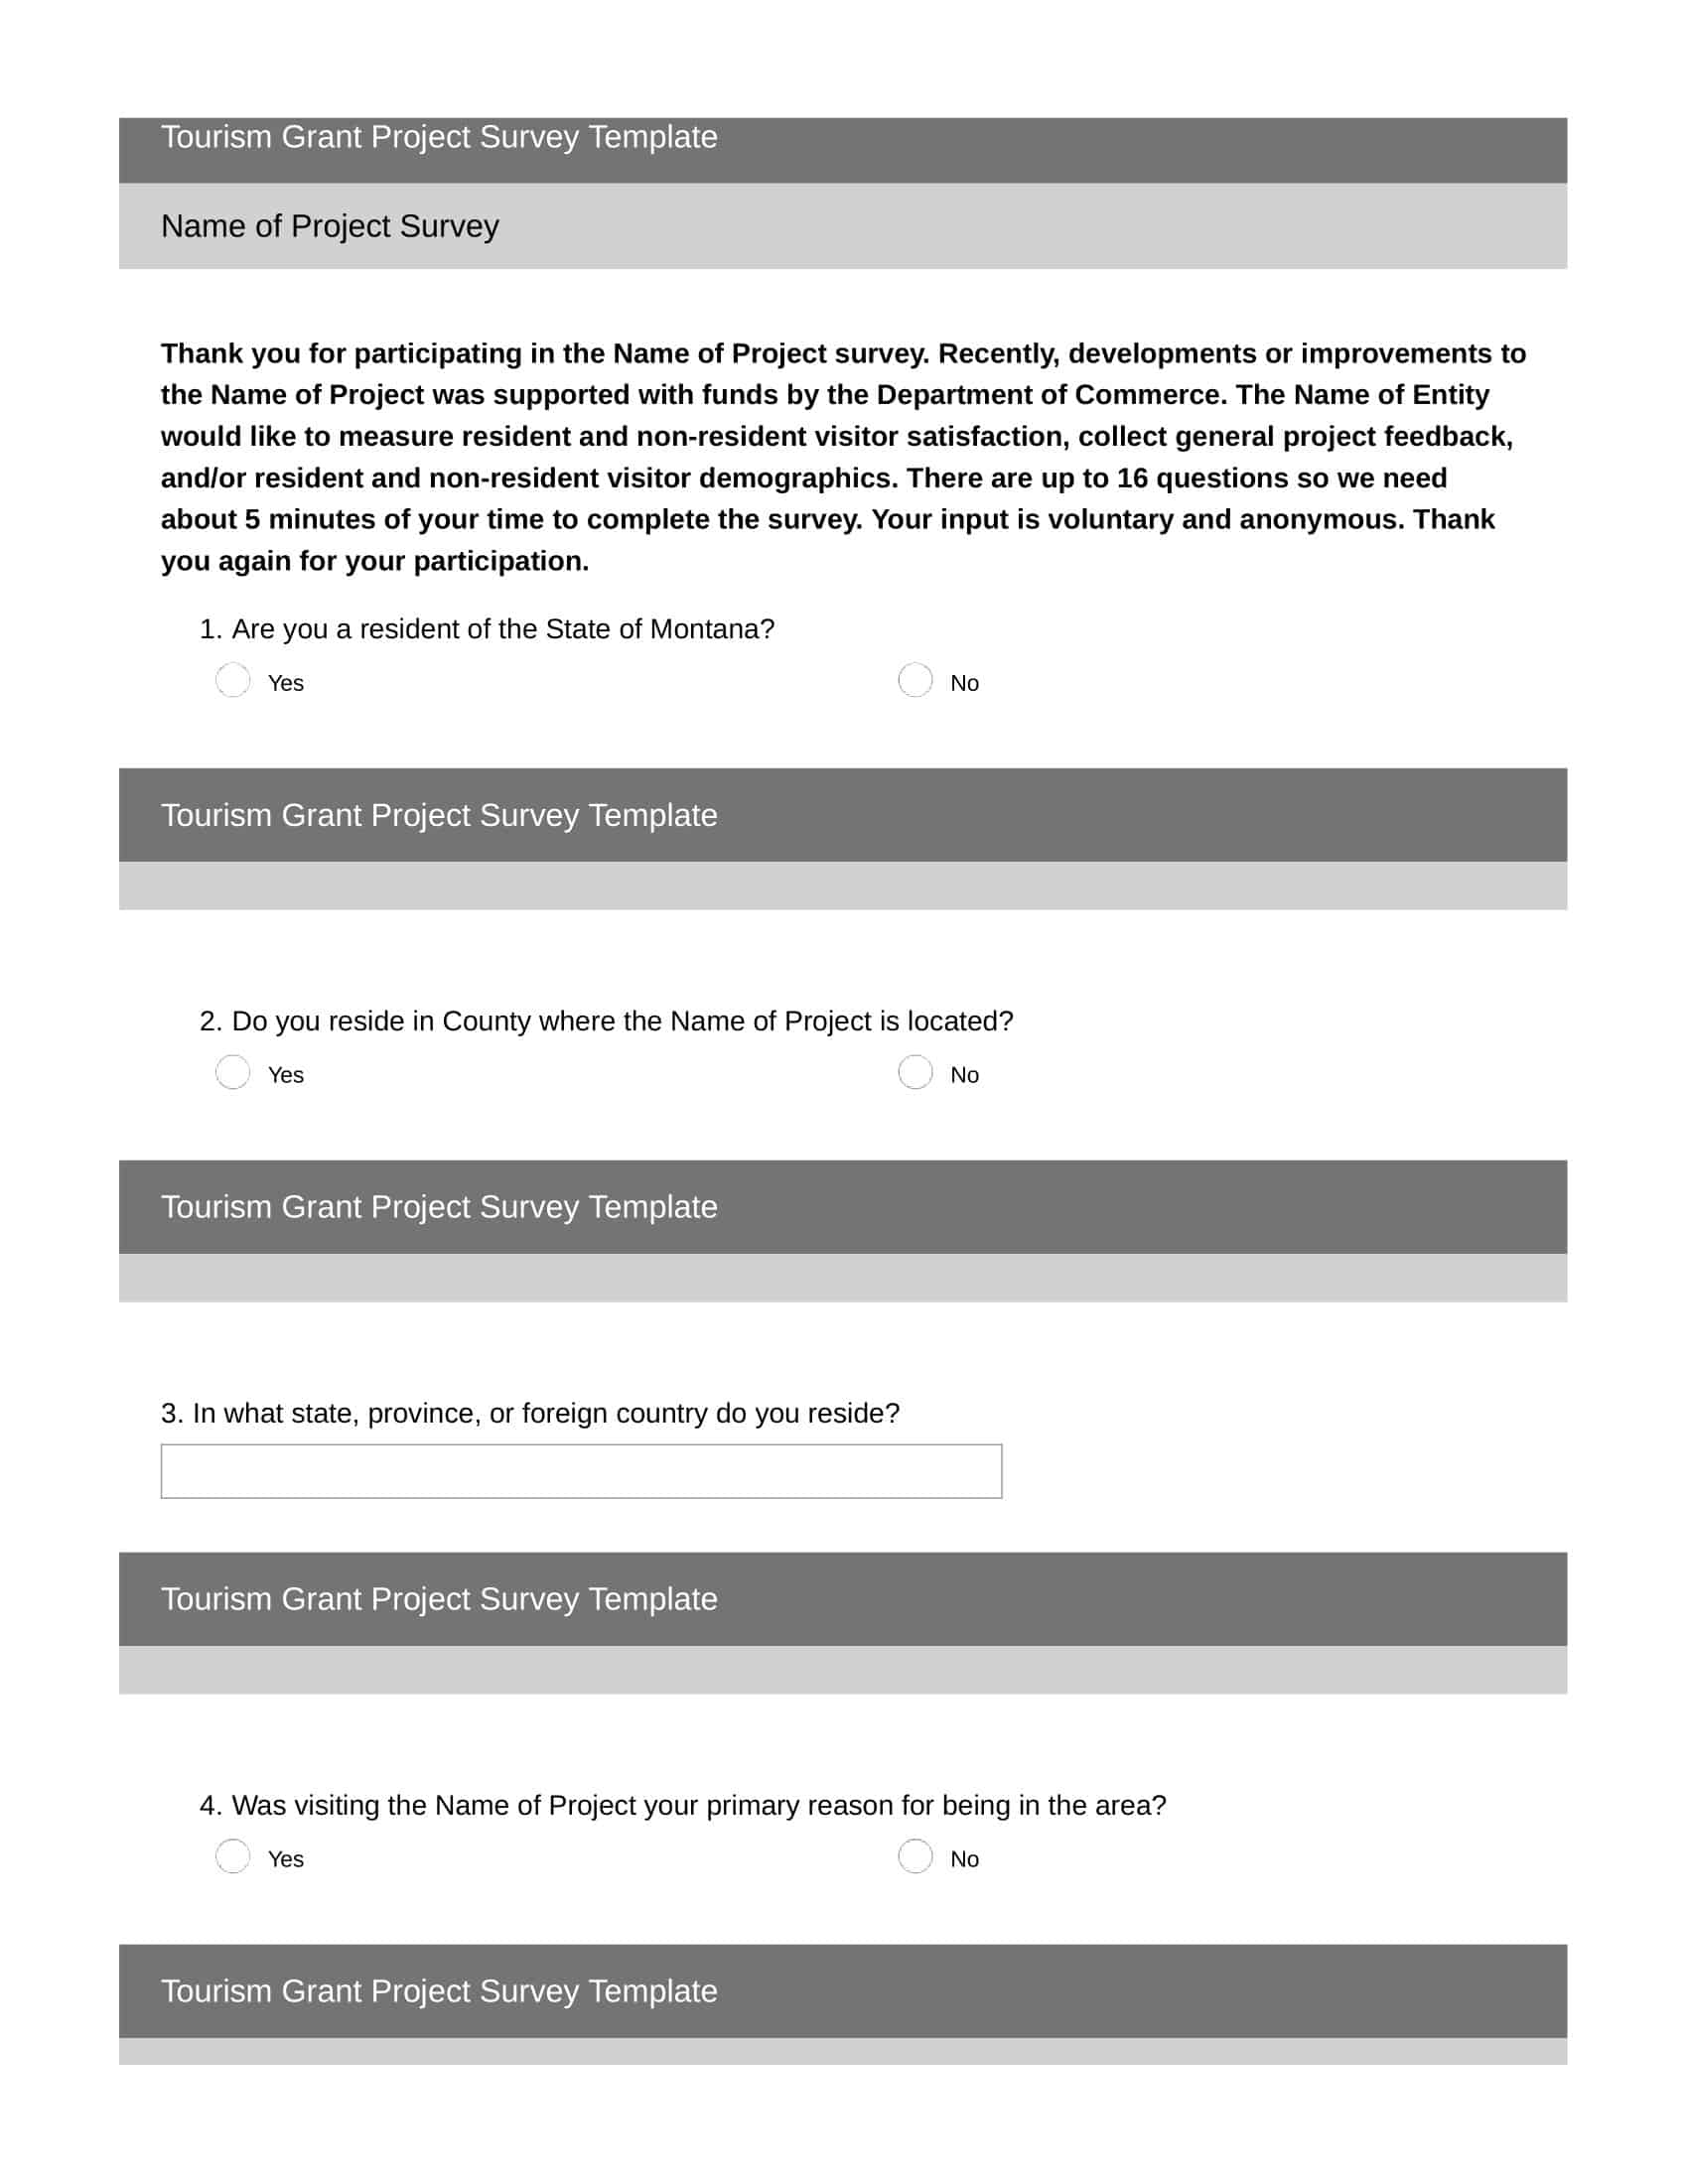
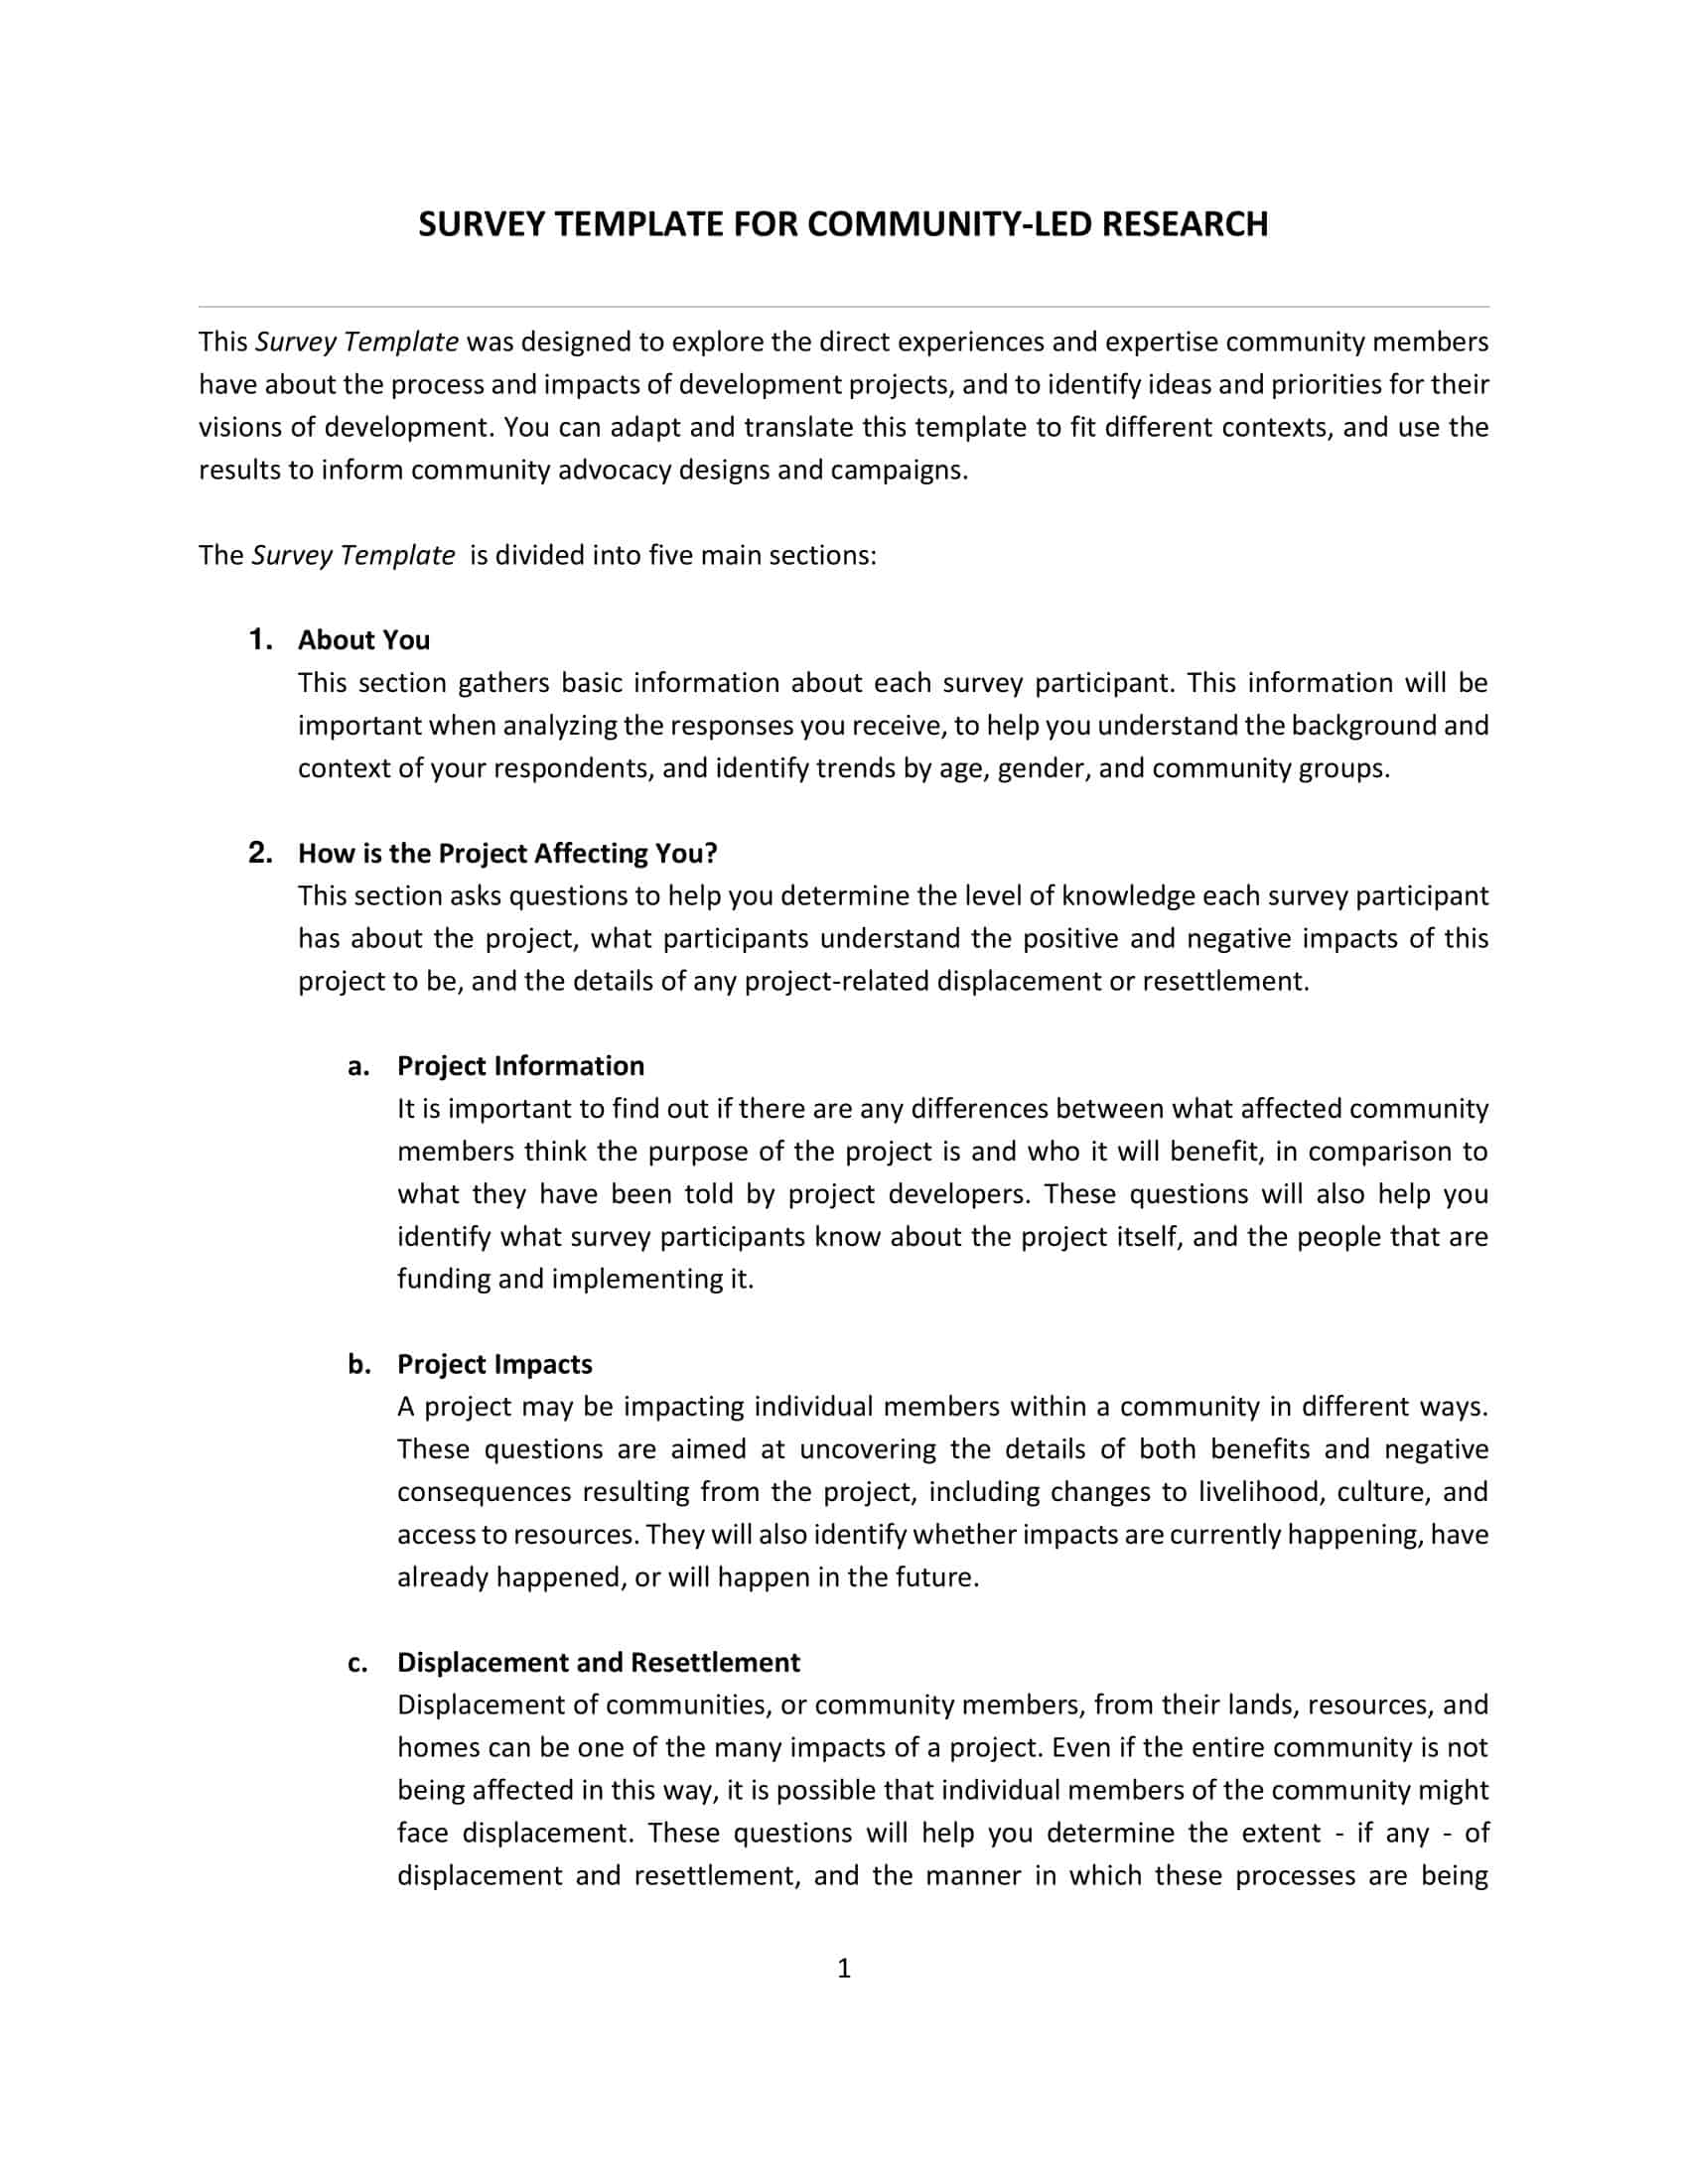
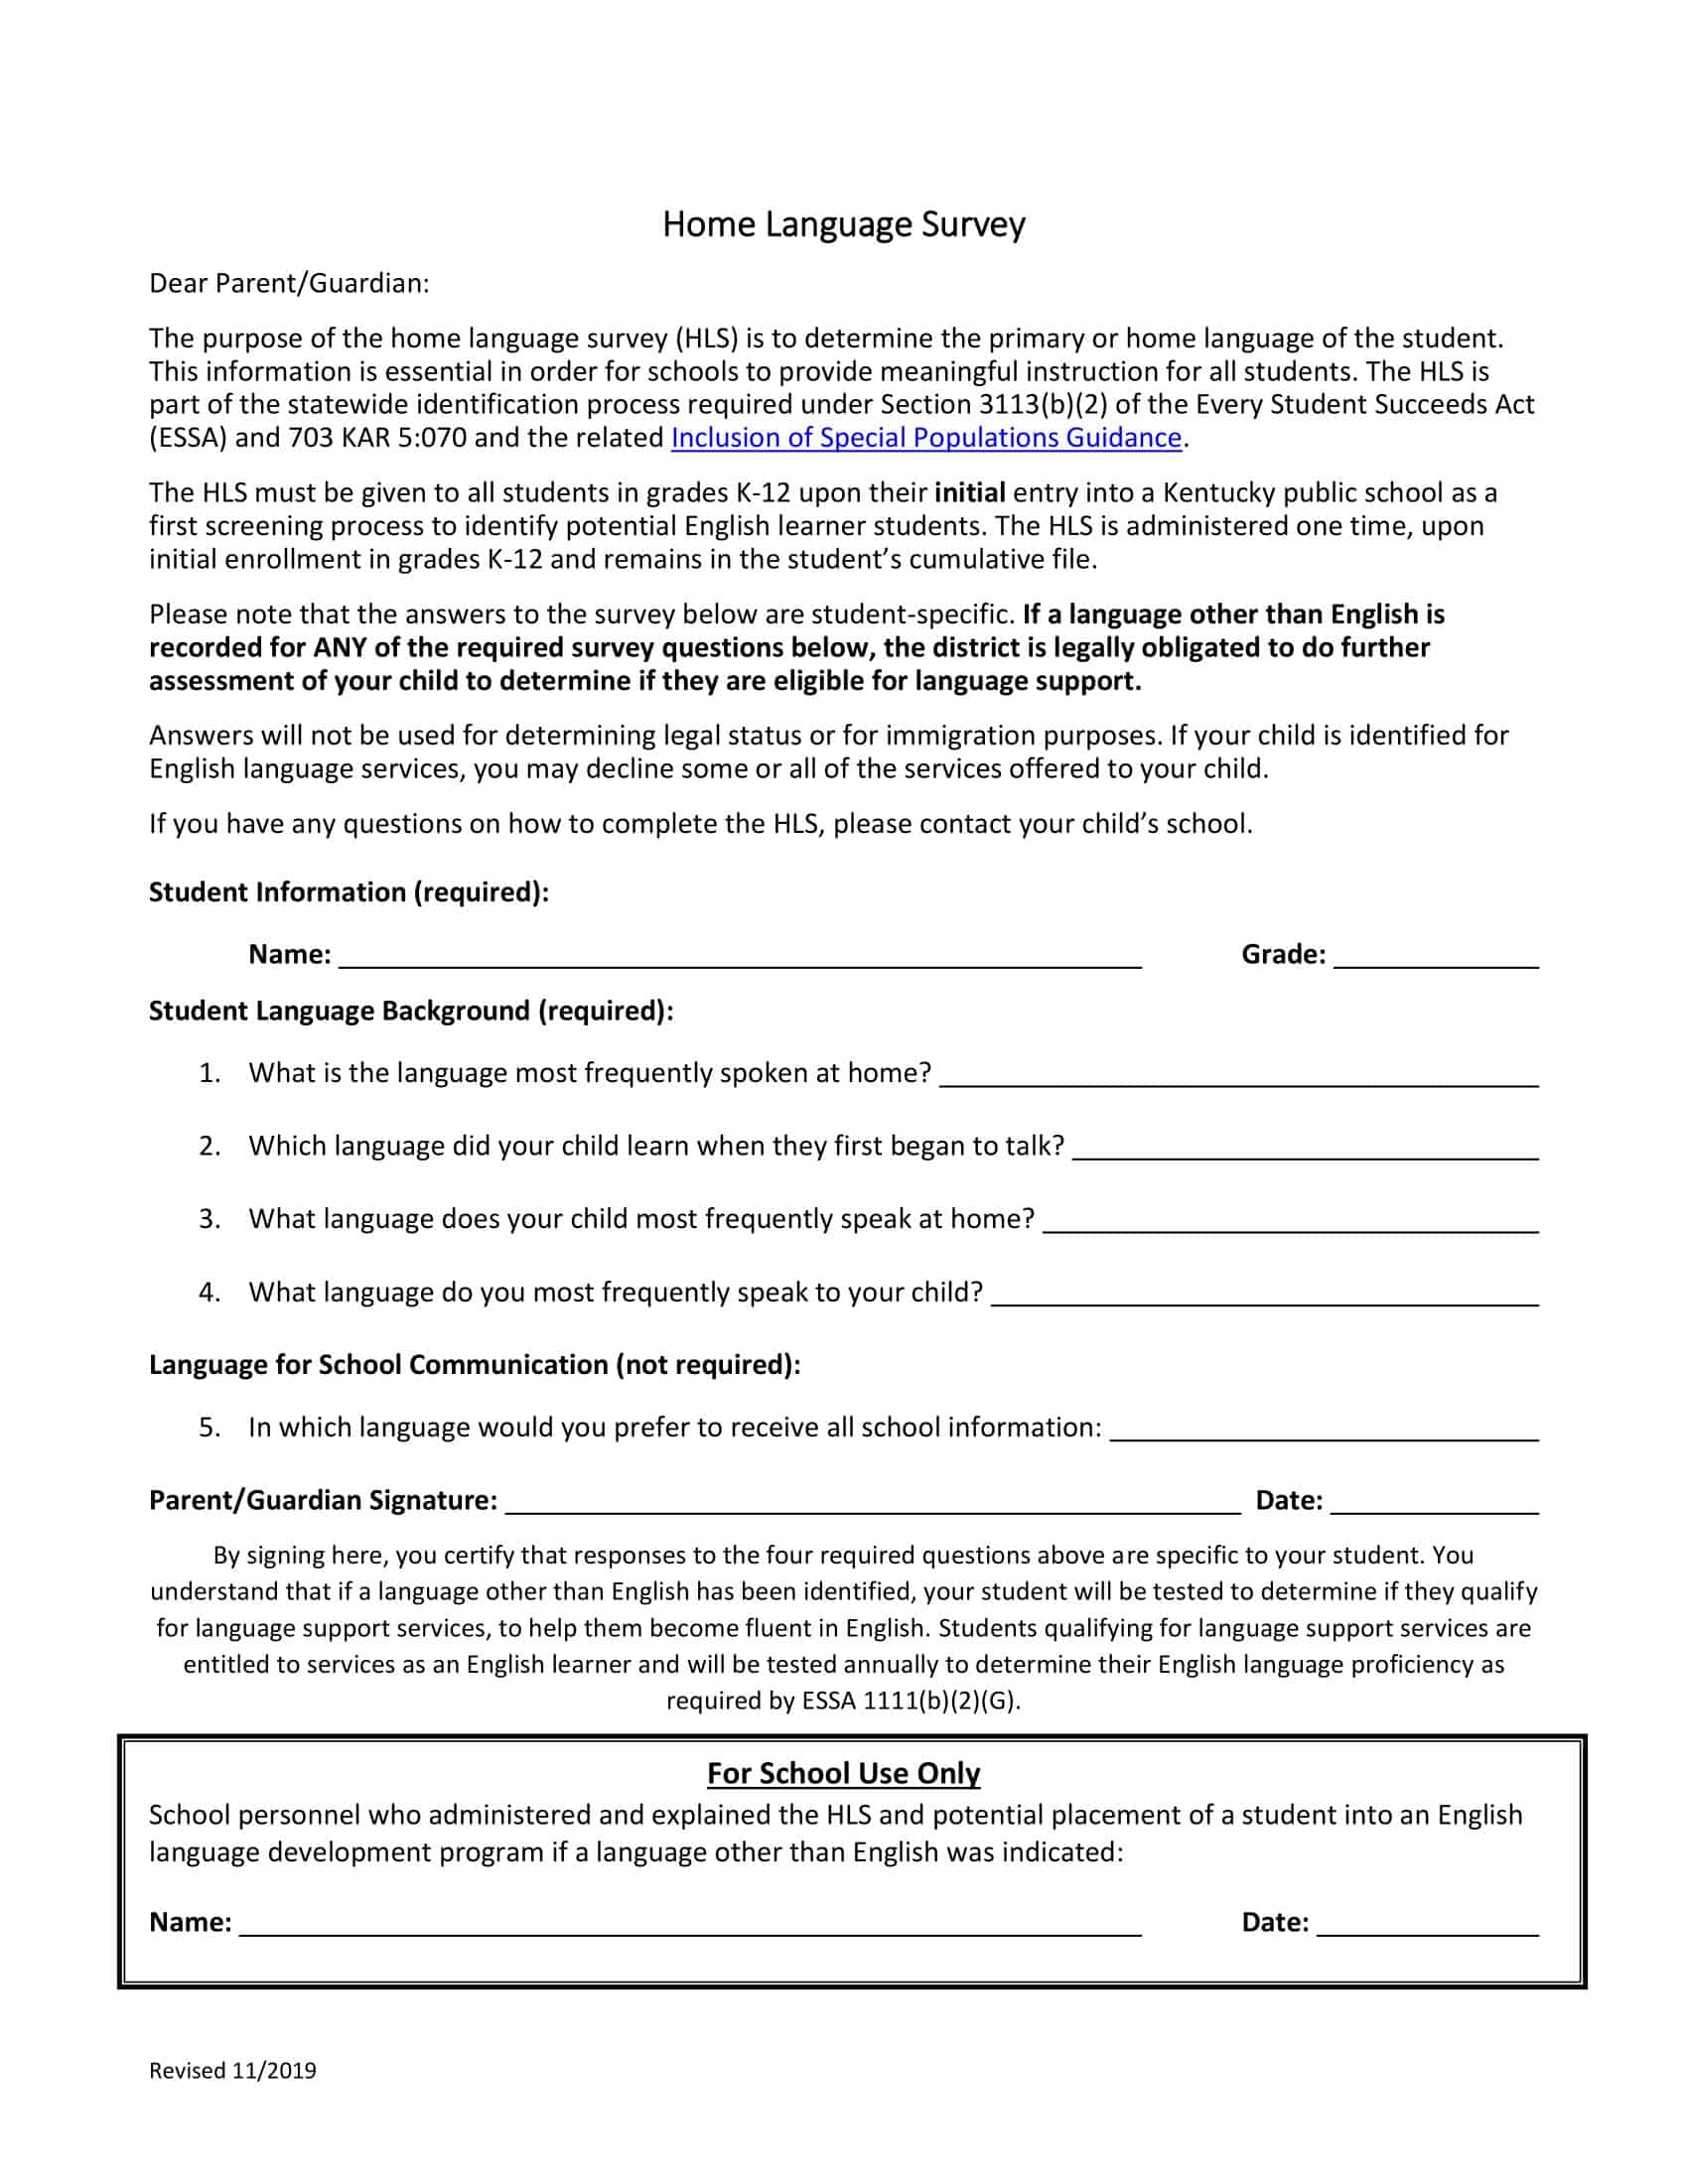
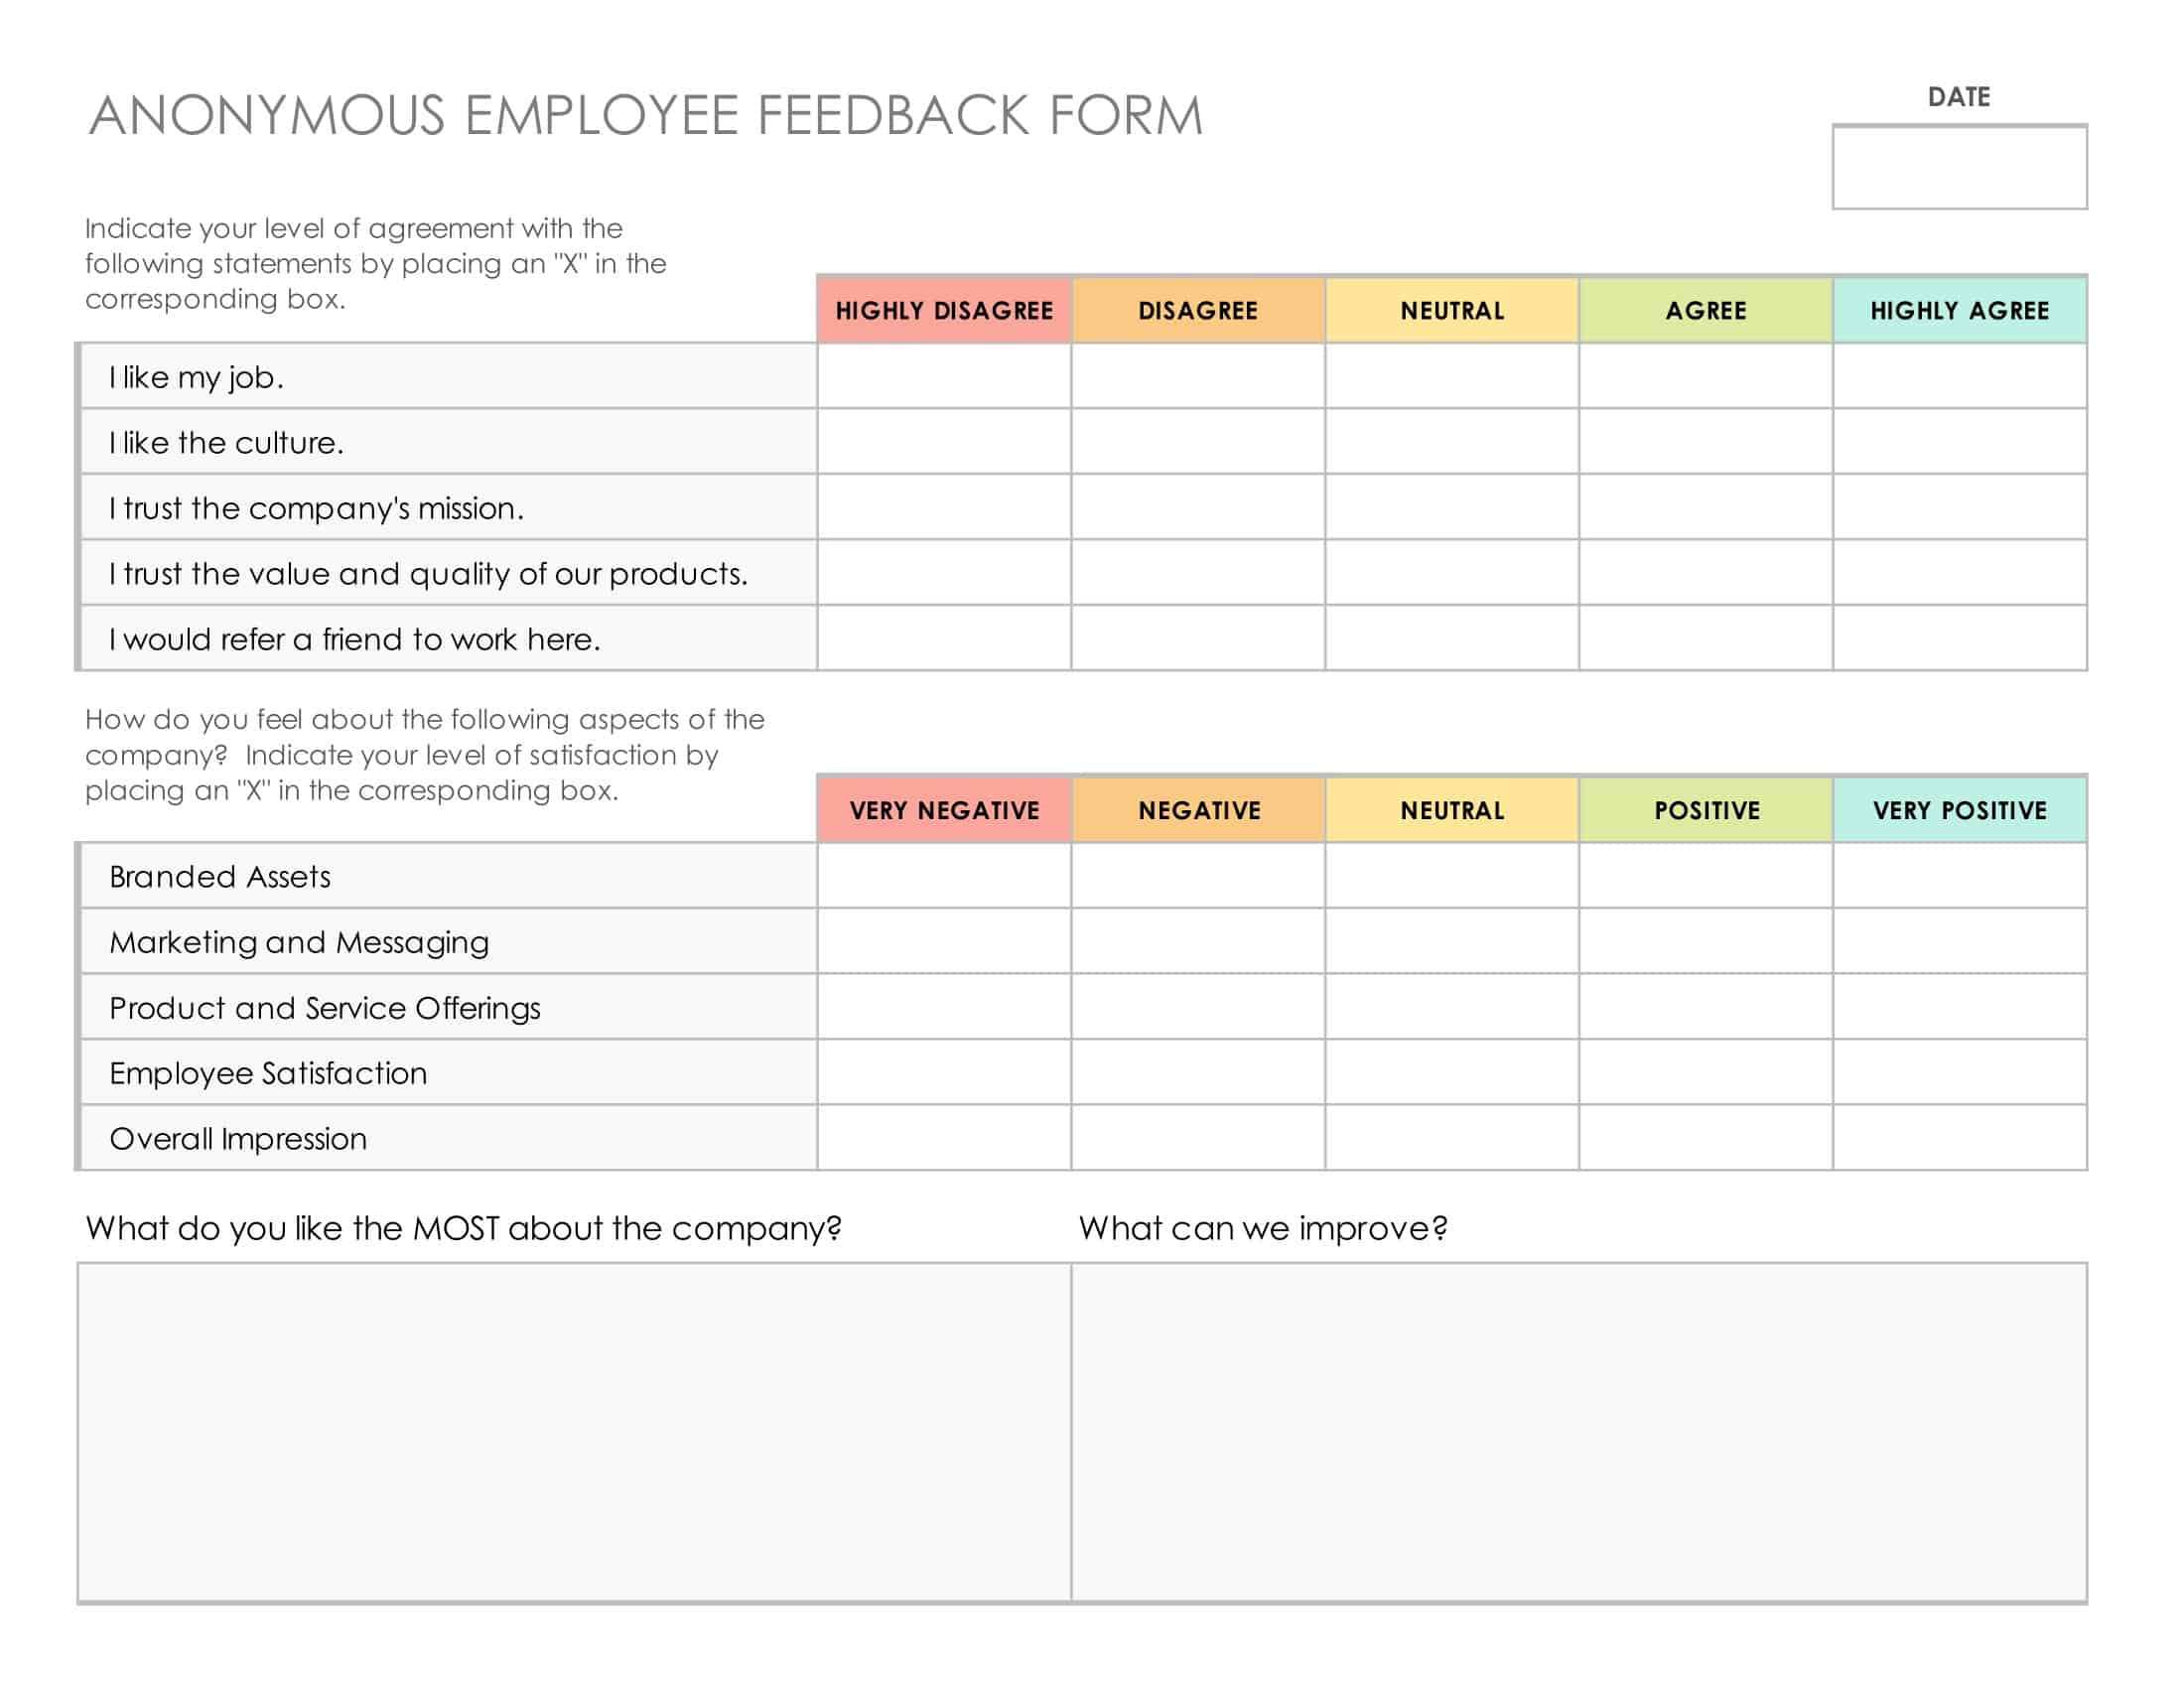
The templates contain layouts and example questions for multiple survey types. There are templates for customer satisfaction, employee engagement, product feedback, event evaluation, and more. Templates facilitate question types like multiple choice, scales, open-ended, and demographic. They also incorporate data analysis components like charts.
With survey templates, creators skip manually formatting surveys from scratch. The templates guide through crafting targeted, logical question flows. Survey distribution and data collection are simplified using integrated templates. Templates can be customized to focus surveys for specific needs. Whether surveying internal teams or external audiences, survey templates enable easy creation of polished, professional surveys that yield actionable insights.
Types of survey templates
Surveys come in a variety of types, each offering unique methods to gather data and feedback. The nature of the survey often depends on the kind of information needed, the context, and the demographic targeted. Here are the major types:
- Descriptive Surveys: Descriptive surveys are used to gather information that shows what something “is”. They are typically used to collect quantifiable information about a population’s characteristics, attitudes, or behaviors. For instance, a market researcher might conduct a descriptive survey to understand the shopping habits of a particular demographic.
- Analytical Surveys: Analytical surveys are used to establish a relationship between variables. They go beyond mere data collection to delve into why certain trends exist and how variables interact with each other. This could involve looking into correlations or causation. For instance, an educational researcher might use an analytical survey to determine the impact of teaching methods on student performance.
- Longitudinal Surveys: Longitudinal surveys involve repeatedly sampling the same respondents over time to track changes or trends. They can be further classified into panel surveys, where the same individuals are surveyed, or cohort studies, where a group sharing a common characteristic is surveyed. For instance, a health researcher might use a longitudinal survey to study the long-term effects of diet on health.
- Cross-sectional Surveys: Cross-sectional surveys are performed at a single point in time with different groups. They provide a snapshot of a population at a specific moment, making them ideal for understanding current attitudes or behaviors. For instance, a political poll during an election season would likely be a cross-sectional survey.
- Mail Surveys: These are cost-effective and can reach a large geographic area but suffer from low response rates. They are ideal when your target demographic is widely dispersed.
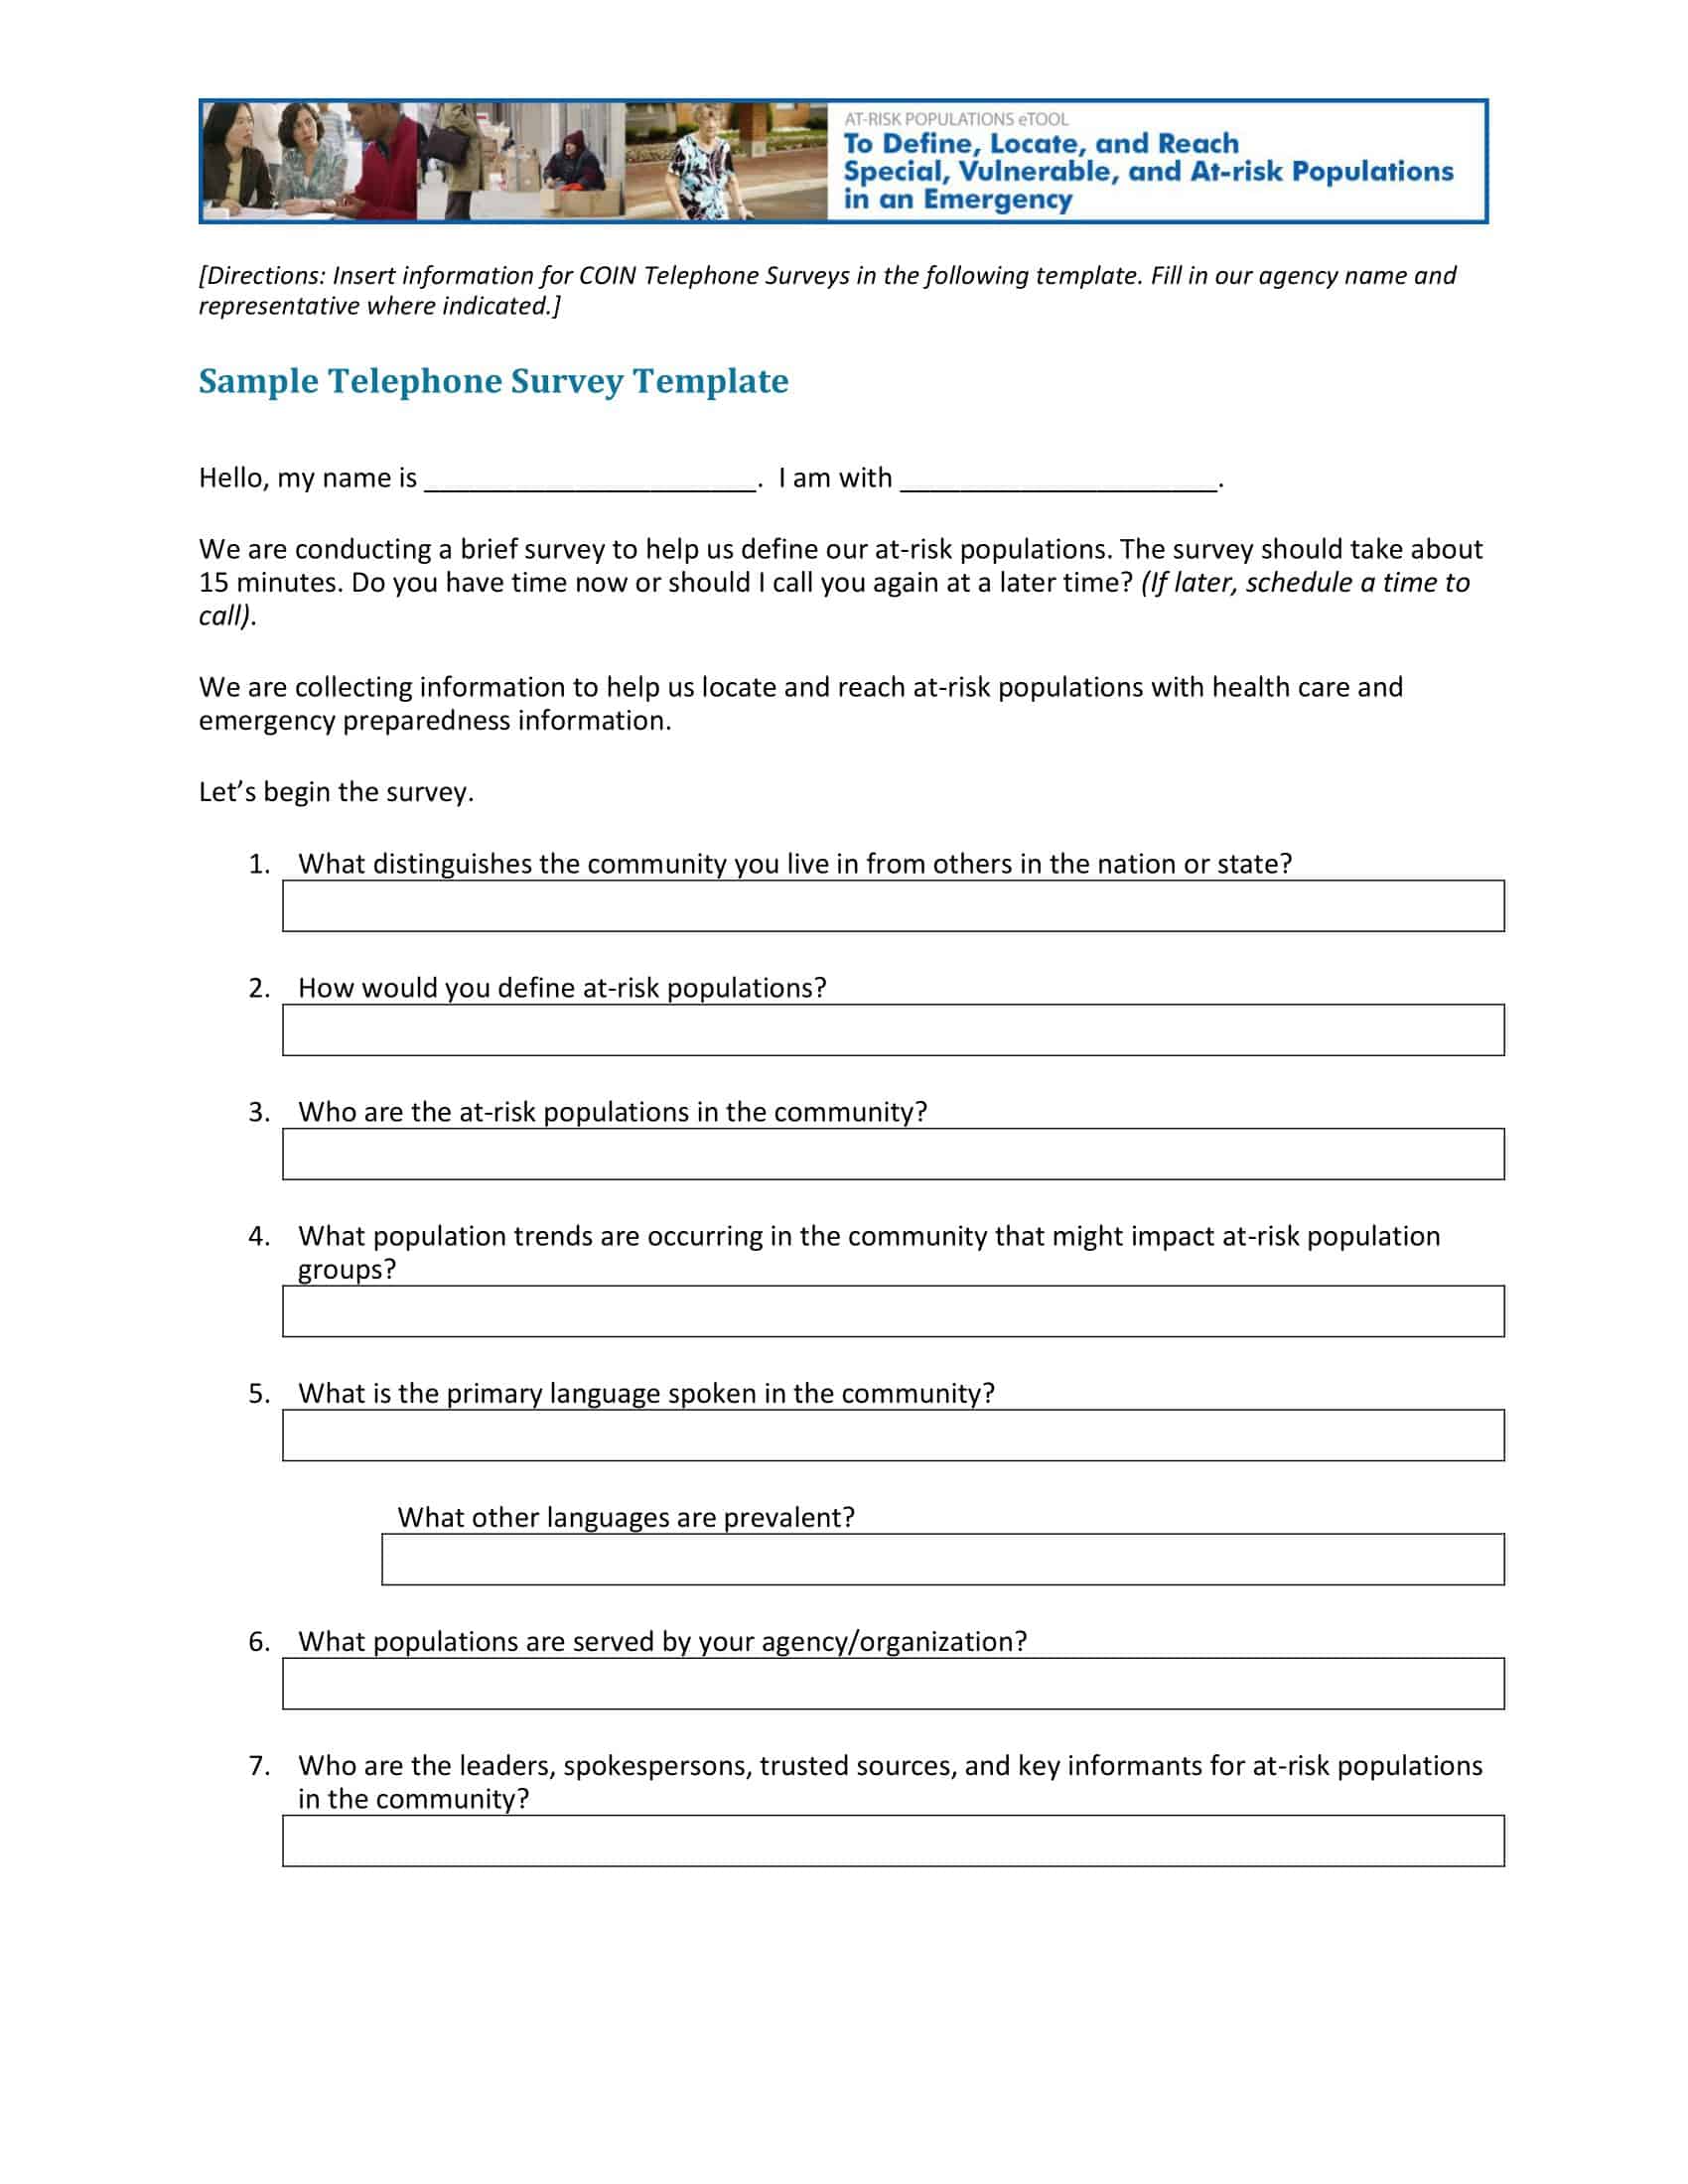
- Telephone Surveys: These surveys are cost-effective and have better response rates than mail surveys, but they can be time-consuming and limit the depth of responses.
- Online Surveys: Online surveys have become increasingly popular due to their convenience and the ability to collect and analyze data quickly. They are ideal for getting quick feedback and allow for complex question types.
- Face-to-face Surveys: These surveys often have the highest response rates and allow for complex questioning, but they are the most time-consuming and expensive.
- Kiosk Surveys: These are conducted on tablets or kiosks in public places. They are great for point-of-experience feedback, like at a store or event.
- Mobile Surveys: These are ideal for reaching people who are constantly on the go. They can be completed anytime, anywhere, making them particularly useful for capturing in-the-moment insights.
The benefits of surveys
Surveys bring several key benefits to the table in terms of data collection and research. Here are a few significant advantages:
- Broad Reach: Surveys can be administered to large populations, even those spread across wide geographic areas, especially in the case of online and mail surveys. This means that they can collect data from a sample size that is representative of the population under study.
- Cost-Effective: Surveys, particularly those conducted online, can be relatively inexpensive to conduct, especially when compared to methods like in-person interviews or focus groups.
- Versatility: Surveys can be designed to gather many types of data, from demographic information to personal opinions, behaviors, and future intentions. The nature of the questions can be open-ended, closed-ended, or a mix of both.
- Quantifiable Results: Survey responses can be easily analyzed in a systematic way, providing quantitative data that can be used to draw statistical conclusions about the population.
- Anonymity: In many cases, surveys can be conducted anonymously, which can encourage respondents to provide honest and accurate answers without fear of repercussions. This can be particularly important when dealing with sensitive topics.
- Standardization: Every participant answers the same series of questions, which ensures that data can be compared and contrasted easily. This uniformity helps to minimize bias and provides a level playing field.
- Speed: With the rise of online and mobile surveys, data can be collected quickly, often in real time. This allows for swift action to be taken based on the survey results.
- Longitudinal Analysis: With surveys, it’s possible to conduct studies over extended periods to observe changes or trends in the respondent group. This can be valuable in tracking shifts in customer sentiment, measuring the impact of policy changes, or tracking the progression of a phenomenon over time.
How to create a survey
Creating a survey requires careful planning to ensure that it effectively captures the data needed to answer your research question. Here’s a detailed guide:
Step 1: Define Your Objectives:
Before you begin, clarify why you’re conducting the survey. What are your key research questions? What data do you need to answer these questions? Clear objectives will guide the design of your survey.
Step 2: Identify Your Target Audience:
Determine who you need to survey to meet your objectives. This might be a specific demographic group, customers of a particular product, employees in a company, or a broader population.
Step 3: Choose the Right Type of Survey:
The type of survey you choose should align with your objectives and target audience. Options include online surveys, telephone surveys, mail surveys, face-to-face surveys, and more. Each has its pros and cons.
Step 4: Draft Your Questions:
The questions should be clear, concise, and directly related to your objectives. Avoid leading questions that might bias responses. Consider a mix of open-ended and closed-ended questions.
Step 5: Structure Your Survey:
Start with simple, non-sensitive questions to engage the respondent. Group related questions together. If your survey is long, consider using section headers to make it easier to navigate.
Step 6: Pre-Test the Survey:
Before sending out the survey, test it on a small sample of your target audience. This can help you identify confusing questions, technical issues, or other potential problems.
Step 7: Distribute the Survey:
Send out your survey to your target audience using the chosen method. Be mindful of the timing – you’re more likely to get a response if you catch people at a convenient time.
Step 8: Collect and Analyze Dat
As responses come in, start compiling the data. Depending on the complexity of your survey, this might involve simple tallies, statistical analysis, or qualitative analysis for open-ended questions.
Step 9: Report Findings:
Present your findings in a clear, understandable format. Highlight the key insights and how they relate to your research objectives. Remember, the goal is not just to present data, but to provide insights that can inform decision-making.
Step 10: Take Action:
Use the insights gained from the survey to make informed decisions. This might involve developing new products, improving services, changing policies, or conducting further research.
How to use your survey results
Once your survey results are in and the data has been analyzed, the next crucial step is utilizing these findings effectively. How you use your survey results largely depends on your initial objectives and the context of the research. However, there are some common ways to use survey data.
Inform Decision Making:
One of the primary uses of survey results is to inform decision-making. With solid data on what your customers, employees, or target audience think and feel, you can make decisions that are grounded in their actual needs and preferences. For example, if you’ve conducted a customer satisfaction survey and found that customers are unhappy with your product’s user interface, you might decide to redesign the interface.
Identify Trends and Patterns:
Surveys can help you spot trends or patterns over time, especially if they’re repeated at regular intervals. For instance, an annual employee engagement survey might reveal that engagement has been steadily declining. This could indicate underlying issues that need to be addressed.
Understand Strengths and Weaknesses:
Survey results can highlight areas where you’re doing well and areas that need improvement. For example, a restaurant might conduct a survey to understand how customers perceive their menu, service, ambiance, and pricing. If the results show high ratings for food but low ratings for service, it’s clear where improvements are needed.
Test Hypotheses:
If you’ve made assumptions or have hypotheses about your audience, a survey can help test them. For instance, you might assume that younger customers prefer digital receipts, while older customers prefer paper ones. A survey can test this hypothesis, giving you data to support or contradict your assumption.
Enhance Communication:
Sharing survey results can also enhance communication within your organization. It shows transparency and a willingness to listen and respond to feedback. However, be mindful of how you communicate the results, particularly if they highlight areas of concern. It’s essential to accompany the findings with an action plan.
Formulate Strategy:
Survey results can help shape your overall strategy. For instance, a business might conduct a market survey to understand customer needs and preferences before launching a new product. The insights gained can guide the product development process and the marketing strategy.
How to Choose the Right Survey Template
Selecting the right survey template can streamline the process of conducting surveys for various purposes, such as market research, customer feedback, and employee engagement. But with countless templates available, choosing the right one may be daunting. This guide offers a detailed step-by-step process to help you select the most effective survey template for your needs.
1. Define Your Objective
Before you even start looking for a survey template, be clear on what you’re hoping to achieve with your survey. Do you want to measure customer satisfaction, collect product feedback, or maybe gather employee feedback? The purpose of your survey will heavily influence the choice of your template.
2. Understand Your Audience
Understanding your audience is crucial. The target demographic, their knowledge level, and their experience with surveys should be considered when choosing a template. For example, simple, direct surveys may be more appropriate for audiences with less experience with surveys, while more in-depth, specialized templates may suit professional or industry-specific audiences better.
3. Browse Survey Template Libraries
Once you have a clear idea of your survey’s purpose and audience, start exploring various online platforms that offer survey templates. Examples include Google Forms, SurveyMonkey, Typeform, and many others. These platforms typically provide a range of pre-designed survey templates for different uses and audiences.
4. Consider the Type of Questions
Look at the type of questions included in the template. There are multiple question types that you can use in a survey, including multiple-choice, open-ended, Likert scale, etc. The type of questions you choose should align with your survey’s objective.
- Multiple-choice questions are good for surveys where you want to offer respondents a fixed range of options.
- Open-ended questions are useful when you want to give respondents the freedom to express their thoughts in detail.
- Likert scale questions are effective for measuring attitudes or opinions on a scale, such as satisfaction or agreement.
5. Check for Bias
Ensure the survey template you choose is free from bias. Bias can influence the results of a survey by pushing respondents towards a particular answer. Check for leading questions, overly complex questions, and unnecessary jargon which may affect the responses you receive.
6. Review the Flow and Structure
A well-structured survey has an introduction, body, and conclusion.
- The introduction should explain the purpose of the survey, how the data will be used, and reassure the respondents about their data privacy.
- The body should start with easy-to-answer questions that help the respondent gain momentum, followed by more complex or sensitive questions, and finally winding down again with simpler questions.
- The conclusion could include a thank you note and information about what happens next (such as when the results will be shared).
7. Assess Customizability
Check if the template allows you to customize it according to your needs. A good survey template should be flexible and adaptable. You should be able to add, remove, or rearrange questions as needed.
8. Evaluate the Aesthetics
While content is crucial, don’t overlook the design aspect of the template. An aesthetically pleasing design can improve response rates and keep your respondents engaged. Ensure the template looks professional, has a logical layout, and aligns with your brand image if necessary.
9. Try it Out
Before finalizing a template, send it to a few test respondents. This can help identify any potential issues in terms of flow, question ambiguity, or time taken to complete the survey.
10. Review Analytics and Reporting Features
Finally, check if the survey platform provides analytical tools to easily interpret the survey results. Good templates should come with comprehensive reporting features that help you analyze and understand the data collected efficiently.
Choosing the right survey template is a thoughtful process that requires understanding your objectives, your audience, and your analytical capabilities. By following these steps, you can ensure you select a template that best fits your needs and delivers useful, actionable data.
Best Online Survey Tools & Apps
There are many platforms available offering survey templates for a variety of purposes, whether it be market research, customer feedback, employee satisfaction, or more. Here are some top providers :
1. SurveyMonkey
One of the most popular online survey tools, SurveyMonkey offers a comprehensive suite of survey templates catering to numerous fields such as customer feedback, market research, events, education, and healthcare.
2. Google Forms
A free tool from Google, Google Forms allows you to create custom surveys. While it may not offer as many pre-made templates as some other platforms, its ease of use and integration with other Google products make it a popular choice.
3. Typeform
Typeform stands out for its unique, interactive, and user-friendly design. It offers a range of templates and allows you to create engaging and interactive surveys with a variety of question types.
4. Qualtrics
Qualtrics is a more advanced tool used widely in academic, market research, and customer experience fields. It offers a large library of templates, with powerful analysis and reporting features.
5. Zoho Survey
Zoho Survey is part of the larger Zoho Suite of business tools. It offers a solid selection of templates, along with options for customization. It also provides reporting tools to analyze your data.
6. SoGoSurvey
SoGoSurvey is another platform offering a variety of templates. It provides advanced features like branching and skip logic, and it’s highly appreciated for its data analysis and reporting capabilities.
7. SurveyGizmo (now Alchemer)
SurveyGizmo, rebranded as Alchemer, offers a wide variety of survey templates, including customer satisfaction, employee feedback, and market research surveys. It provides a good balance between ease-of-use and advanced features.
8. Microsoft Forms
Similar to Google Forms, Microsoft Forms is a part of the Office 365 suite and provides an easy-to-use platform for creating surveys. It doesn’t offer as many pre-made templates but can be a good fit if you are already using Office 365 tools.
9. JotForm
JotForm offers a variety of pre-made survey templates. It stands out for its ability to create visually pleasing and highly interactive forms, with an easy-to-use interface.
10. SurveySparrow
SurveySparrow offers an engaging, chat-like survey experience. It offers various templates for different purposes and provides detailed analytics for your survey responses.
- Before choosing a provider, consider your needs in terms of the complexity of the survey, your budget, the need for advanced analysis tools, and the preferred user experience. Each of these providers has strengths in different areas and understanding these will help you choose the right tool for your requirements.
FAQs
How can I increase survey response rates?
To increase survey response rates, consider keeping the survey short and focused, offering incentives, ensuring the questions are clear and easy to understand, using personalized invitations, and following up with reminders.
How many survey questions should I include?
The ideal number of survey questions depends on the complexity of the topic and the attention span of your respondents. As a general guideline, try to keep the survey concise and limit the number of questions to avoid respondent fatigue.
How should I analyze survey data?
Survey data can be analyzed using various techniques, such as descriptive statistics, cross-tabulations, regression analysis, and qualitative coding. The analysis method depends on the research objectives and the type of data collected.
How can I determine the sample size for my survey?
The sample size depends on various factors, such as the population size, desired level of confidence, margin of error, and anticipated response rate. You can use online sample size calculators or consult with a statistician to determine an appropriate sample size for your survey.
Should I use an online survey tool or conduct surveys in person?
The choice between online surveys and in-person surveys depends on your specific needs and target audience. Online surveys are often more convenient and cost-effective, while in-person surveys may be more suitable for certain populations or when complex data collection is required.
How do I ensure my survey questions are unbiased?
To ensure unbiased survey questions, avoid leading or loaded questions that may influence respondents’ answers. Use neutral language and avoid assumptions or stereotypes. Pre-test your survey with a small group to identify and address any potential biases.
How can I improve the quality of responses in open-ended questions?
To improve the quality of responses in open-ended questions, provide clear instructions and examples. Use prompts or probing questions to encourage respondents to provide detailed answers. Consider using a word limit to ensure concise responses.
Is it necessary to incentivize survey participation?
Incentives can help increase survey response rates, but they are not always necessary. It depends on factors such as the length and complexity of the survey, the target audience, and the importance of the data. Incentives can be in the form of discounts, gift cards, or entries into a prize draw.
How should I analyze qualitative survey data?
Qualitative survey data, such as open-ended responses, can be analyzed through thematic analysis, content analysis, or coding techniques. Identify common themes, patterns, or keywords in the responses and categorize them accordingly. Software tools like NVivo or manual coding can be used for analysis.
Can I use survey data for academic or commercial research?
Yes, survey data can be used for academic or commercial research purposes, provided ethical considerations are followed. Ensure that respondents’ privacy and anonymity are protected, and obtain necessary permissions or informed consent if required.
How should I report the results of my survey?
When reporting survey results, start with an executive summary highlighting the key findings. Present the data using charts, graphs, and tables for better visualization. Provide detailed analysis and interpretations of the results, and consider the target audience when formatting and presenting the report.











![Free Printable Roommate Agreement Templates [Word, PDF] 1 Roommate Agreement](https://www.typecalendar.com/wp-content/uploads/2023/06/Roommate-Agreement-150x150.jpg)
![Free Printable Credit Card Authorization Form Templates [PDF, Word, Excel] 2 Credit Card Authorization Form](https://www.typecalendar.com/wp-content/uploads/2023/06/Credit-Card-Authorization-Form-150x150.jpg)
![Free Printable Stock Ledger Templates [Excel,PDF, Word] 3 Stock Ledger](https://www.typecalendar.com/wp-content/uploads/2023/08/Stock-Ledger-150x150.jpg)
