Bubbles maps are for you if you’re into brainstorming and organizing ideas. It’s a great way to organize multiple ideas and categories in one place. You can use these templates when you need to categorize information into different groups and subgroups. This can also help with sketching out charts and other visual pieces of content.
Table of Contents
What are the types of thinking maps?

Thinking maps are one of the best activities to help you organize your thoughts and represent information. This includes methods developed to help you visualize your thinking or represent your abstract thoughts using concrete visuals.
Here is an overview of the main types of thinking maps:
- Circle Map – used for defining in context, describing attributes and qualities
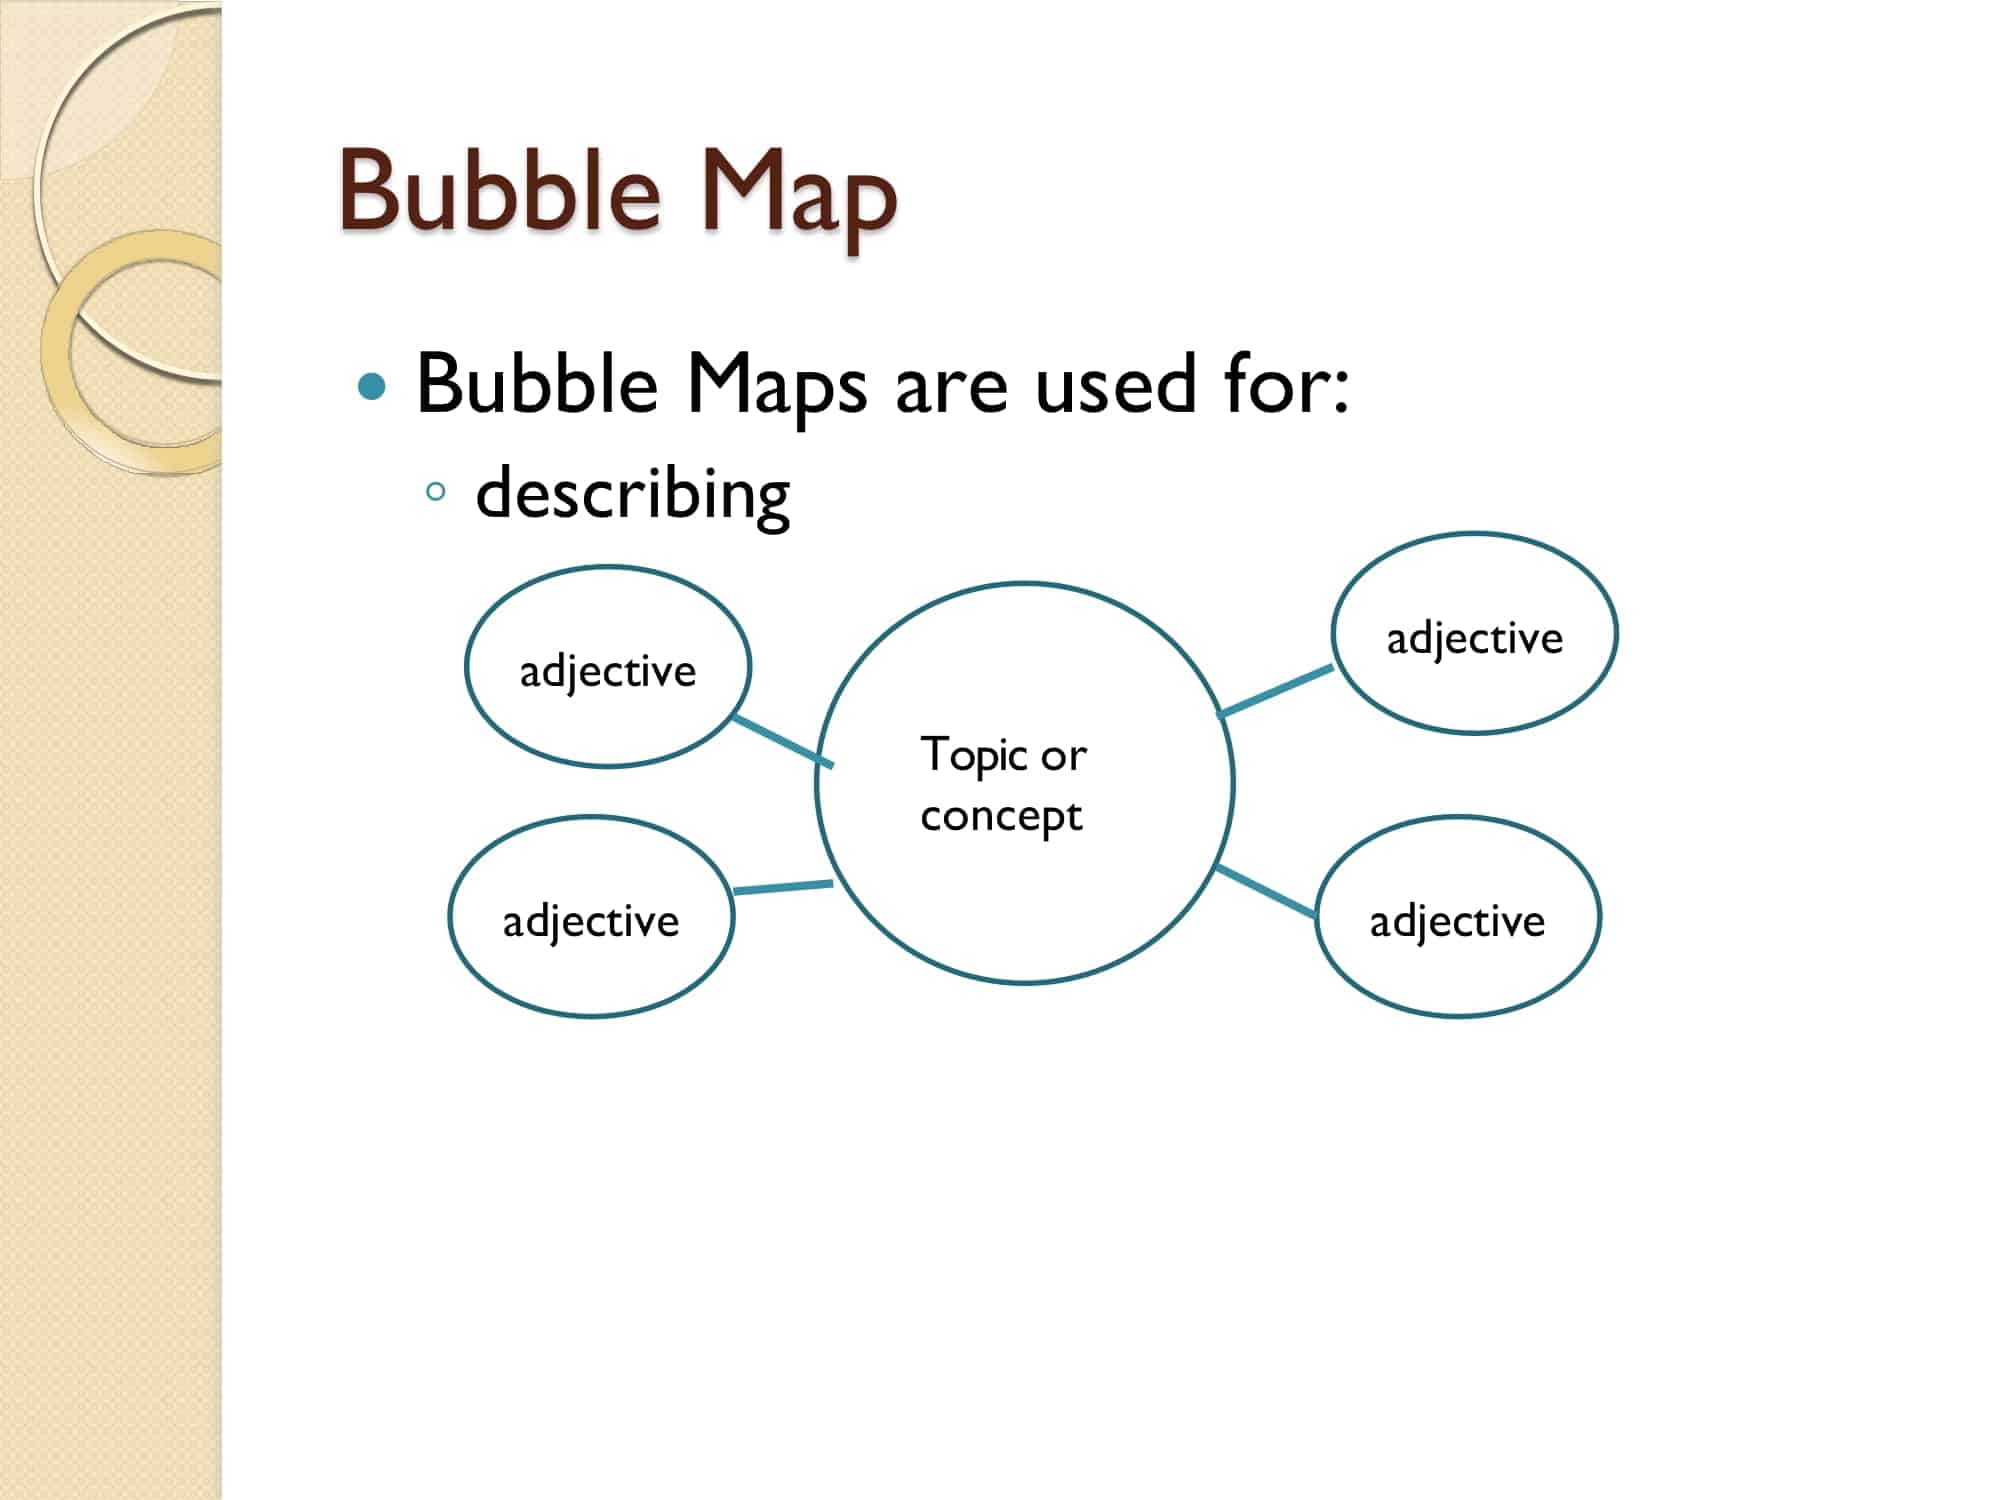
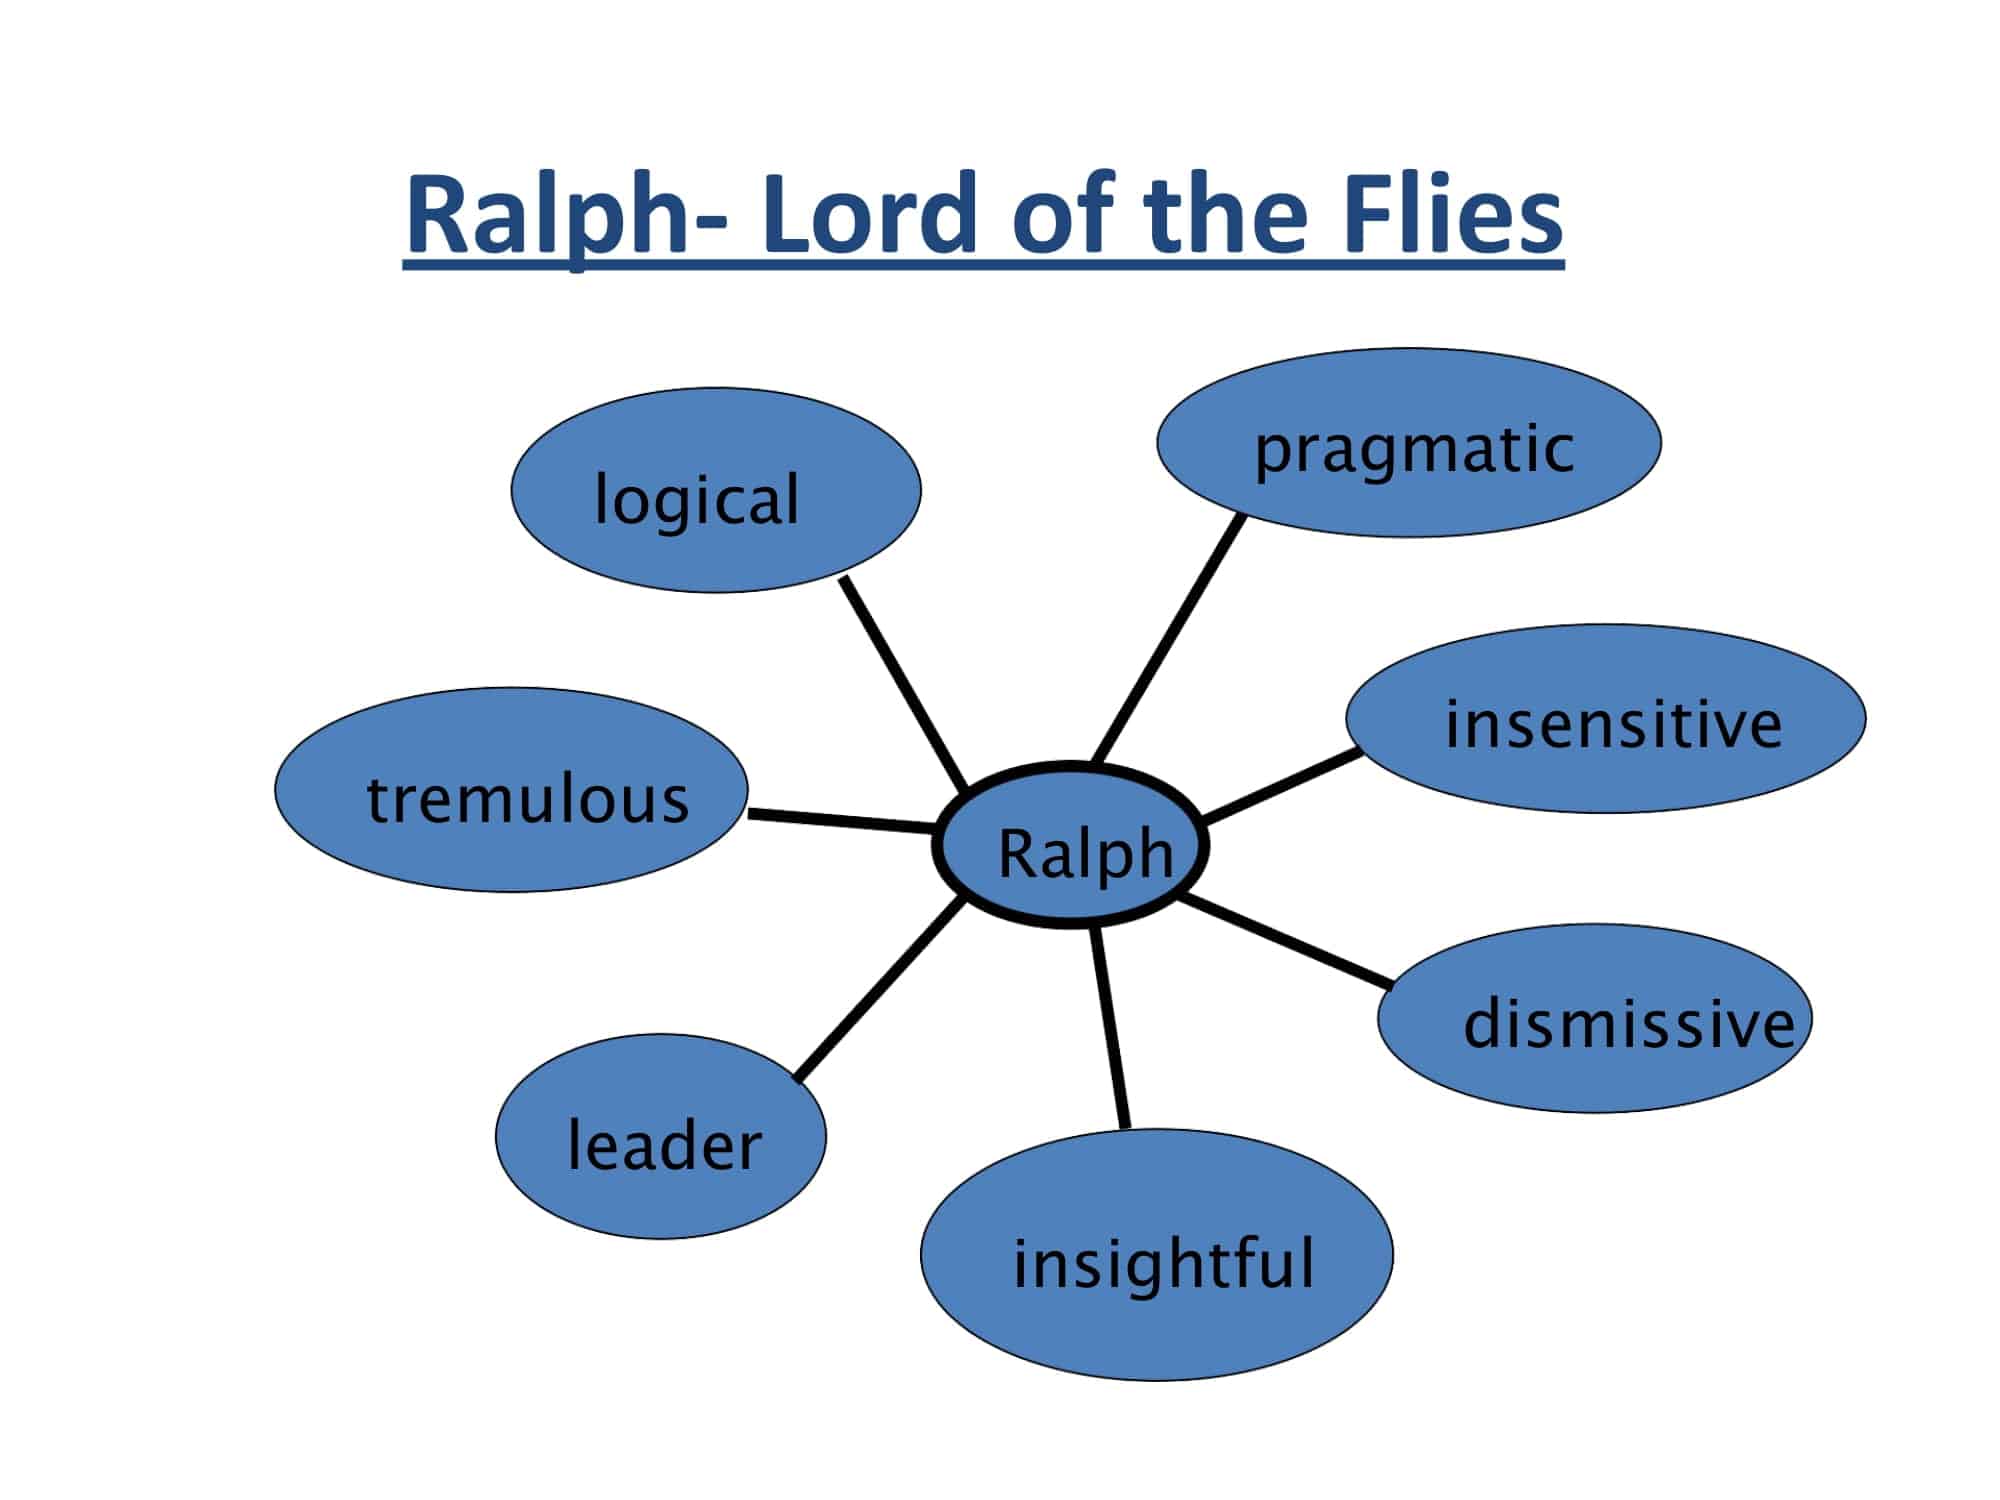
- Bubble Map – used for describing with adjectives, thoughts, and feelings
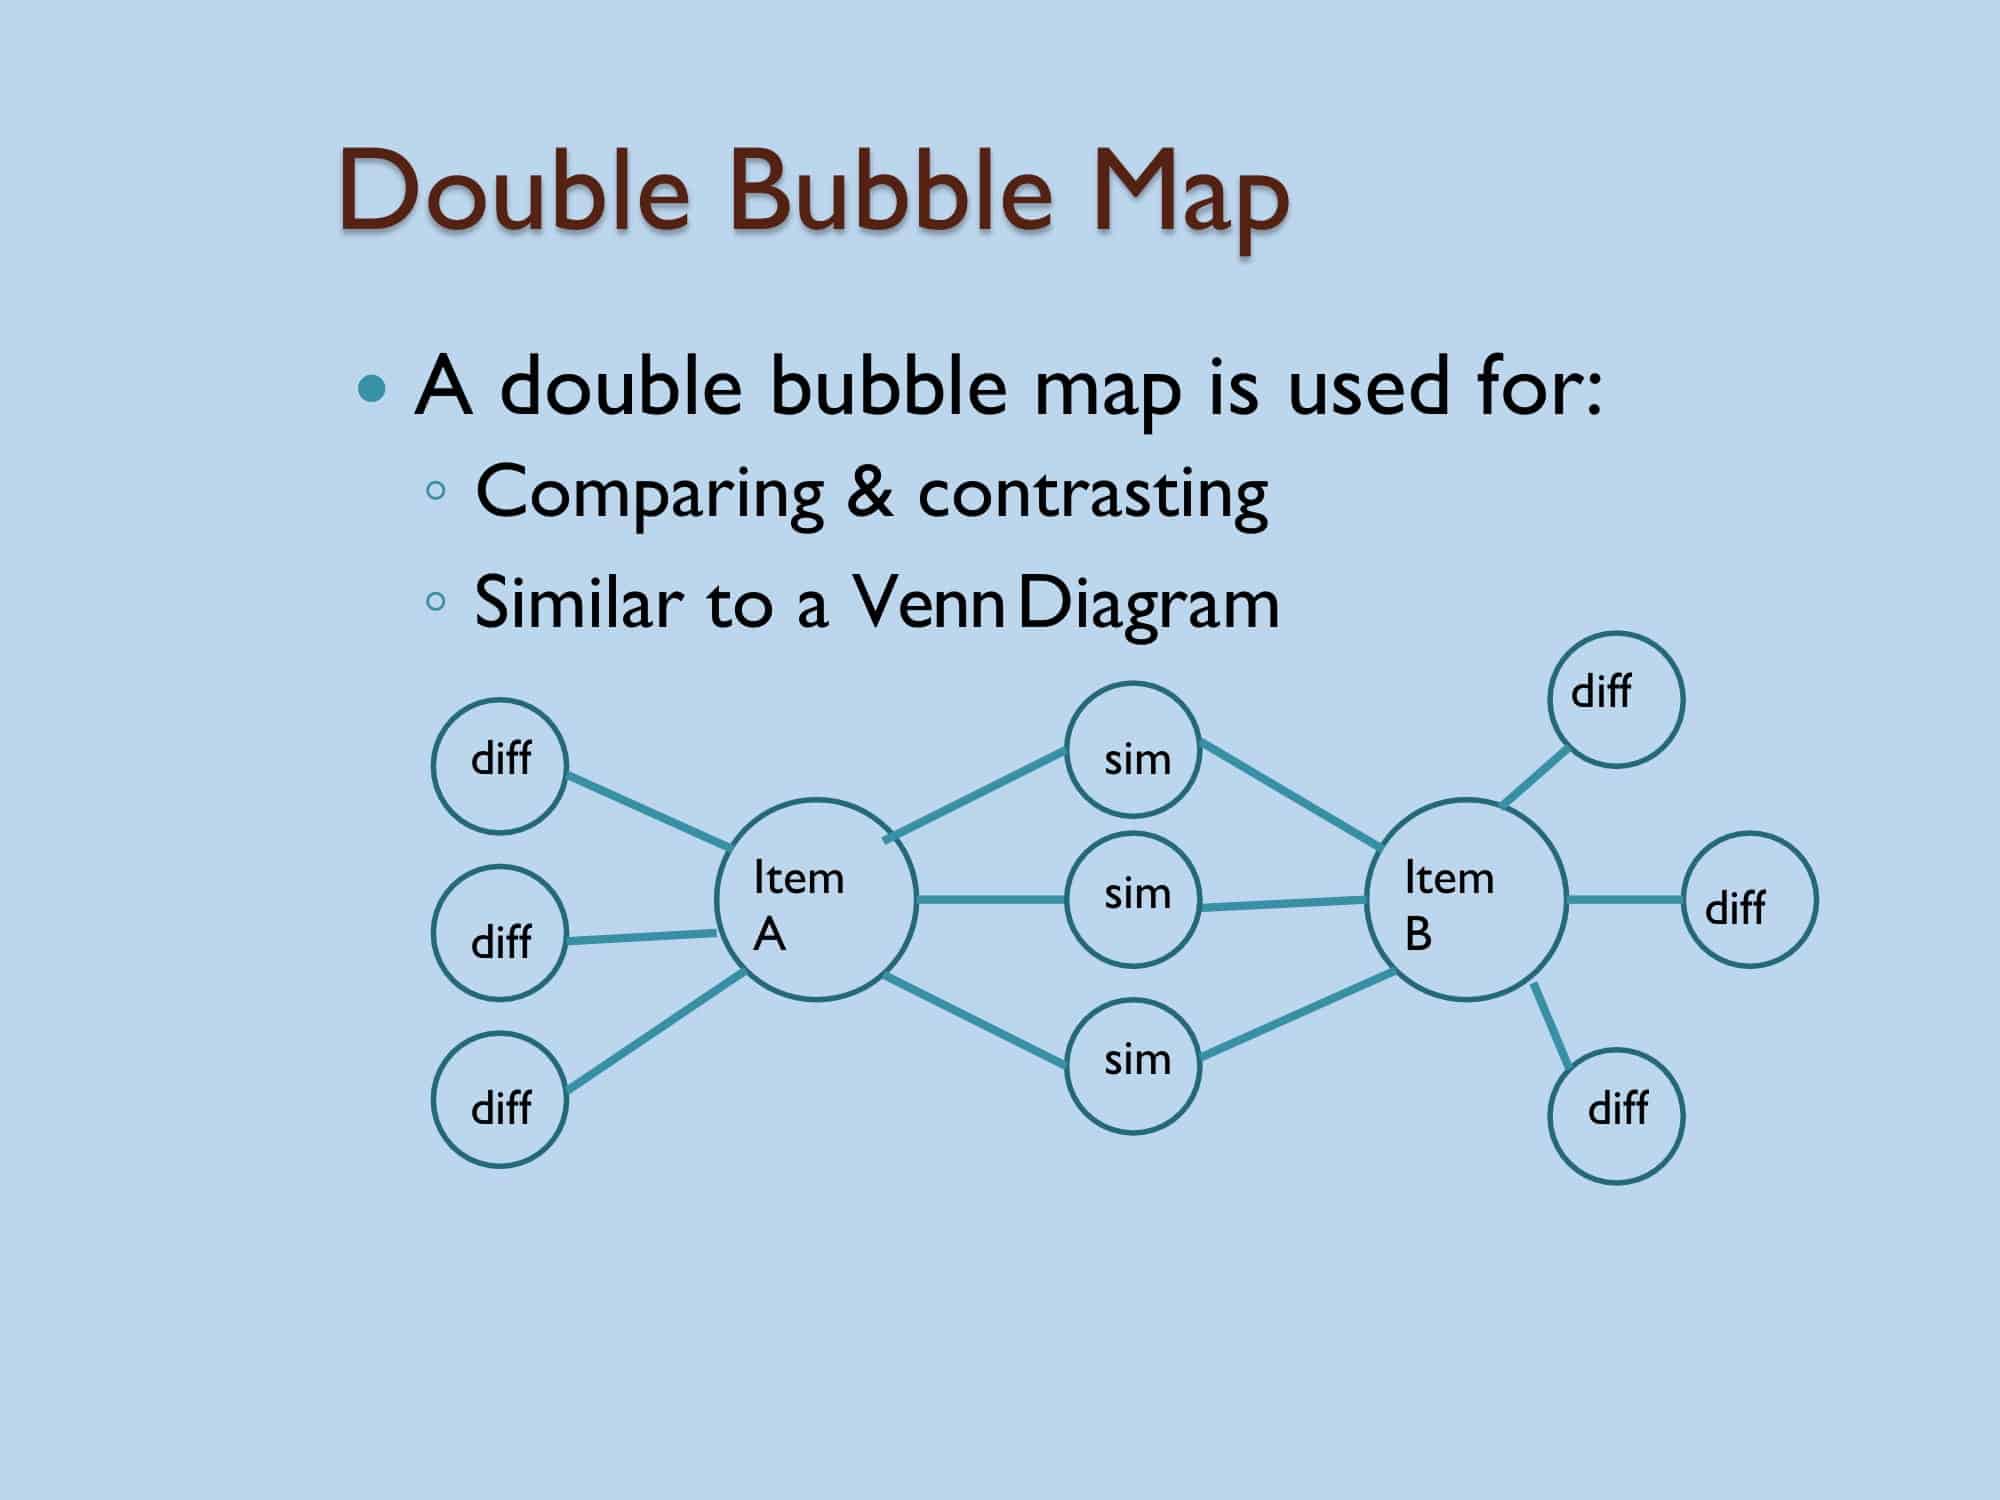
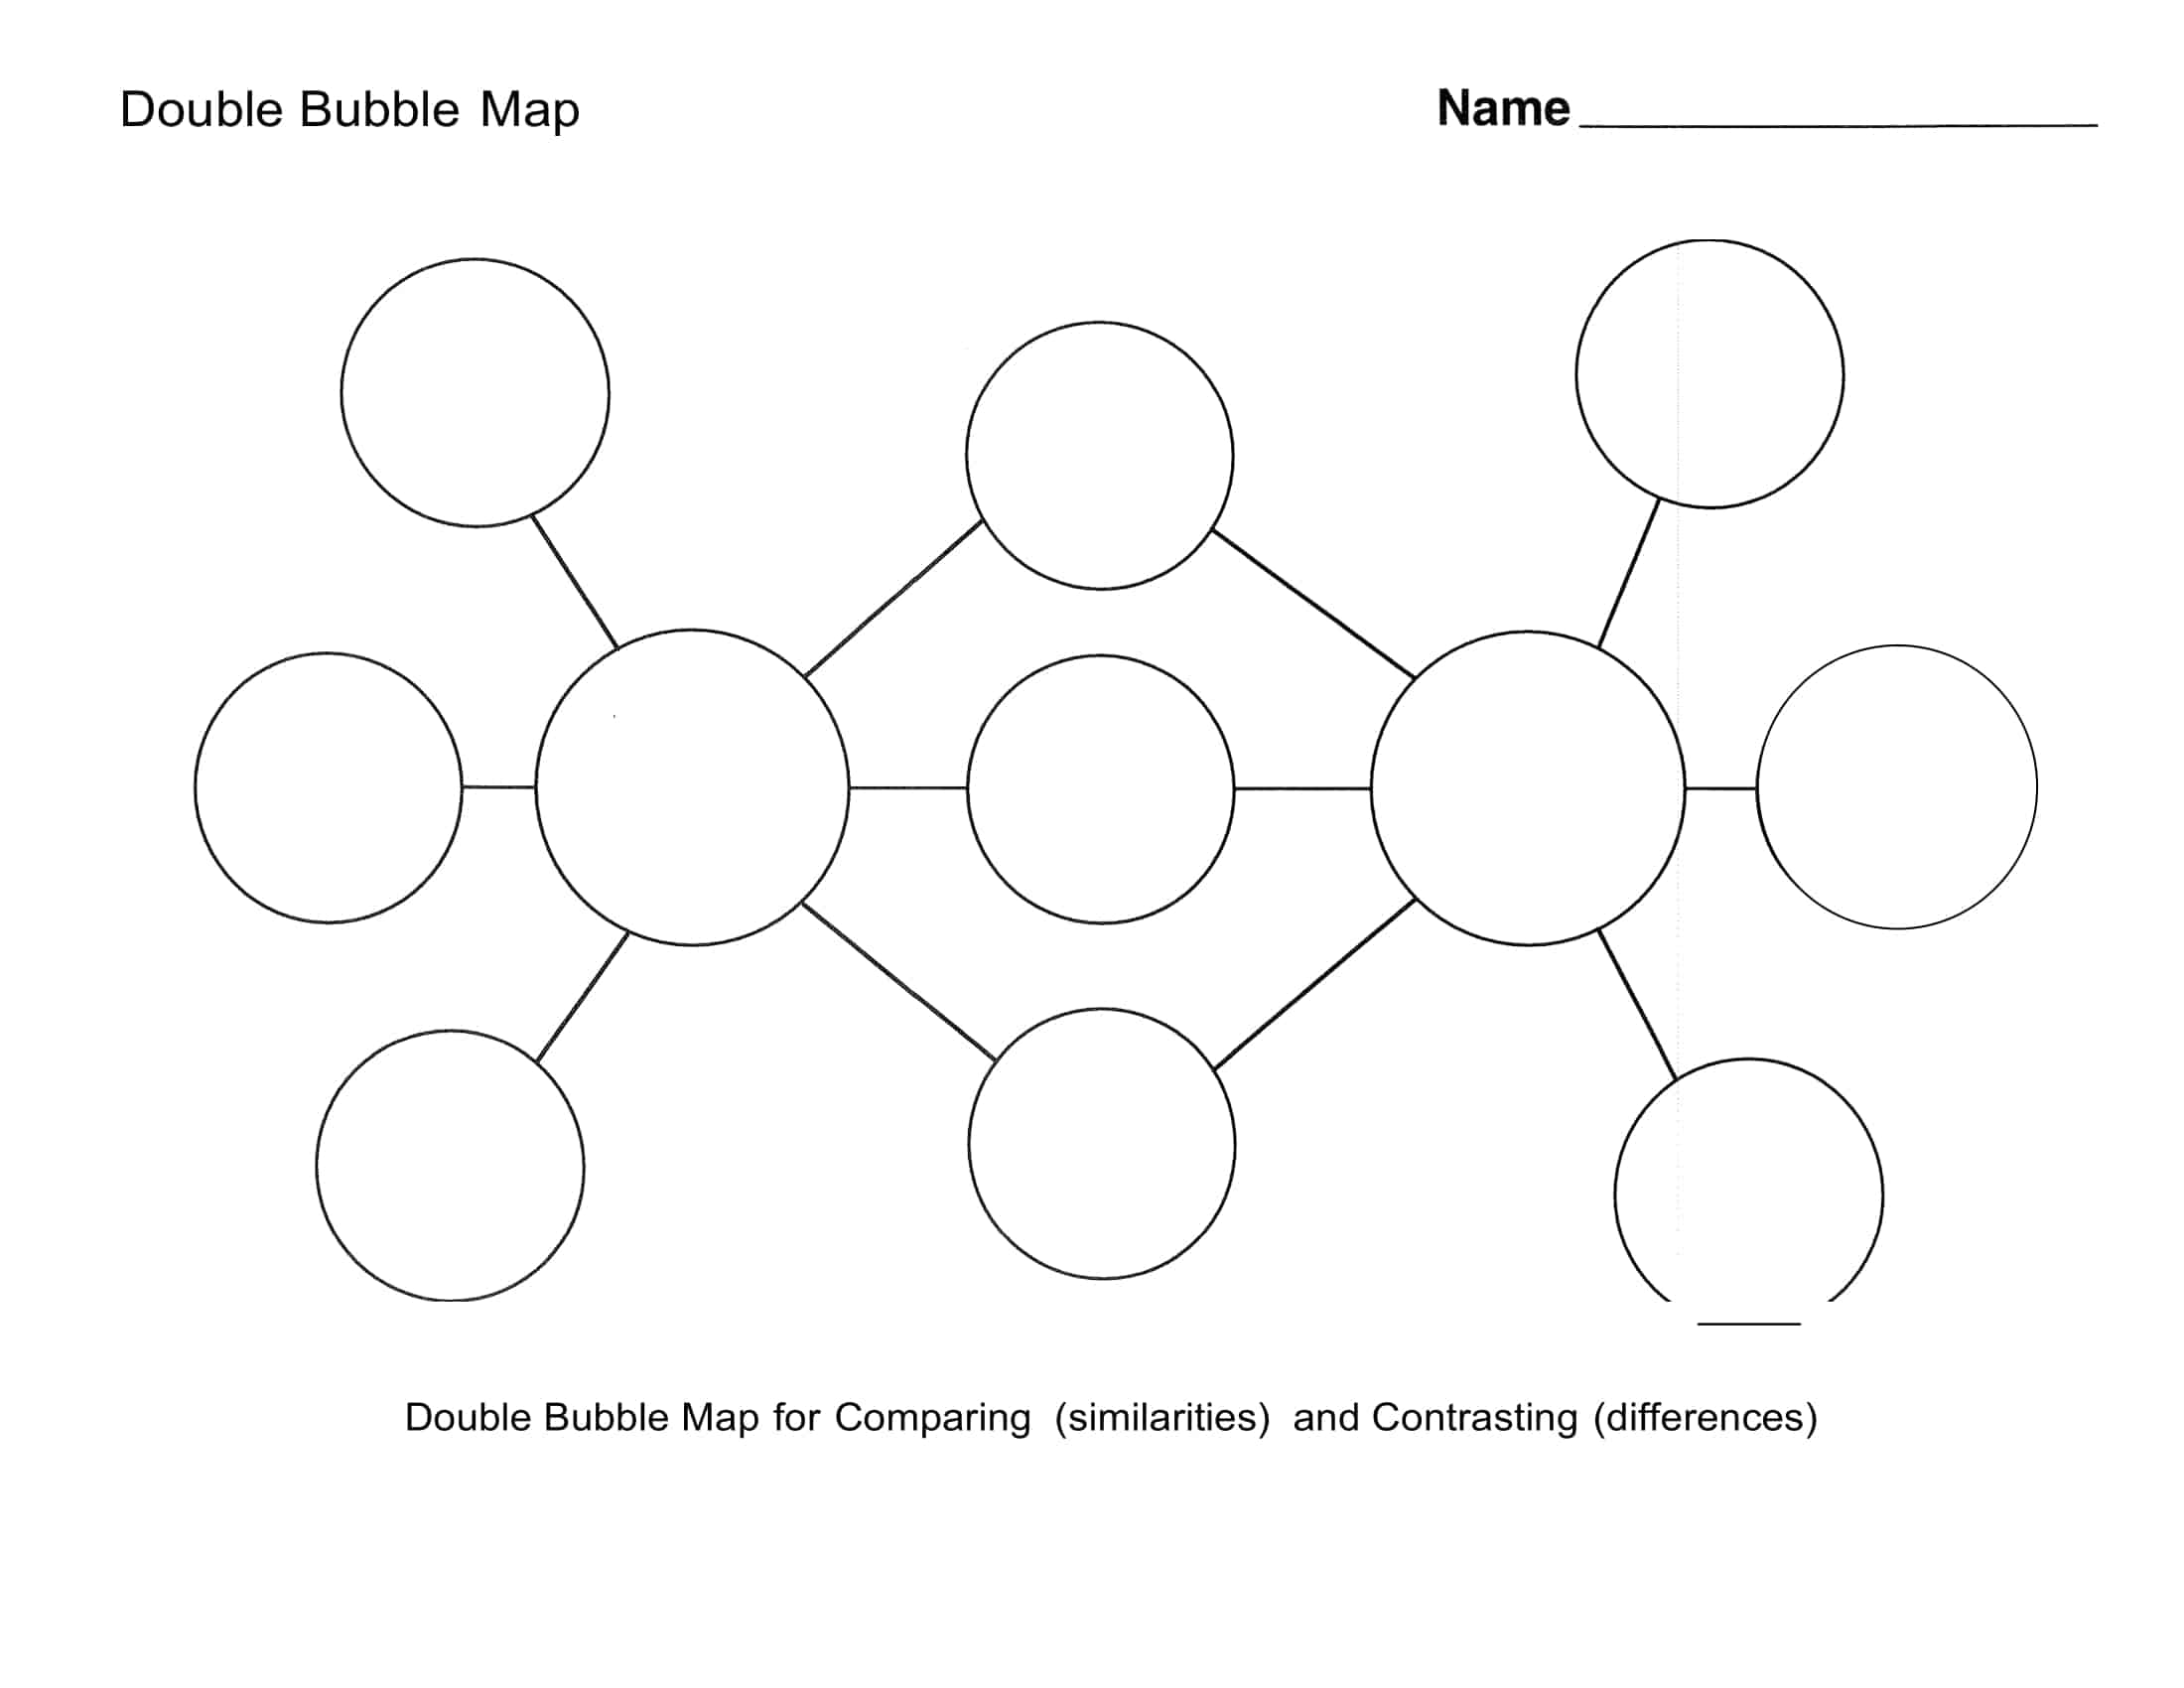
- Double Bubble Map – used for comparing and contrasting two things
- Tree Map – used for classifying and categorizing things into groups
- Brace Map – used for identifying physical parts of an object and their functions
- Flow Map – used for sequencing events in chronological order
- Multi-Flow Map – used for showing causes and effects
- Bridge Map – used for making analogies to show relationships
- Multi-Flow Map – used for analyzing the perspectives of different stakeholders
Thinking maps provide visual frameworks to organize and structure thinking for various purposes. They utilize simple visual patterns like circles, bubbles, branched trees, flows, bridges, and more. Students use thinking maps to visually arrange ideas and information during the learning process. The consistent set of maps helps build and reinforce thinking skills across disciplines.
Bubble Map Templates
Bubble map templates are pre-designed visual tools that help organize and present information in a structured and engaging manner. These templates provide a framework for creating bubble maps, also known as brainstorming maps or concept maps, which visually depict relationships, ideas, or concepts in a hierarchical and interconnected way.
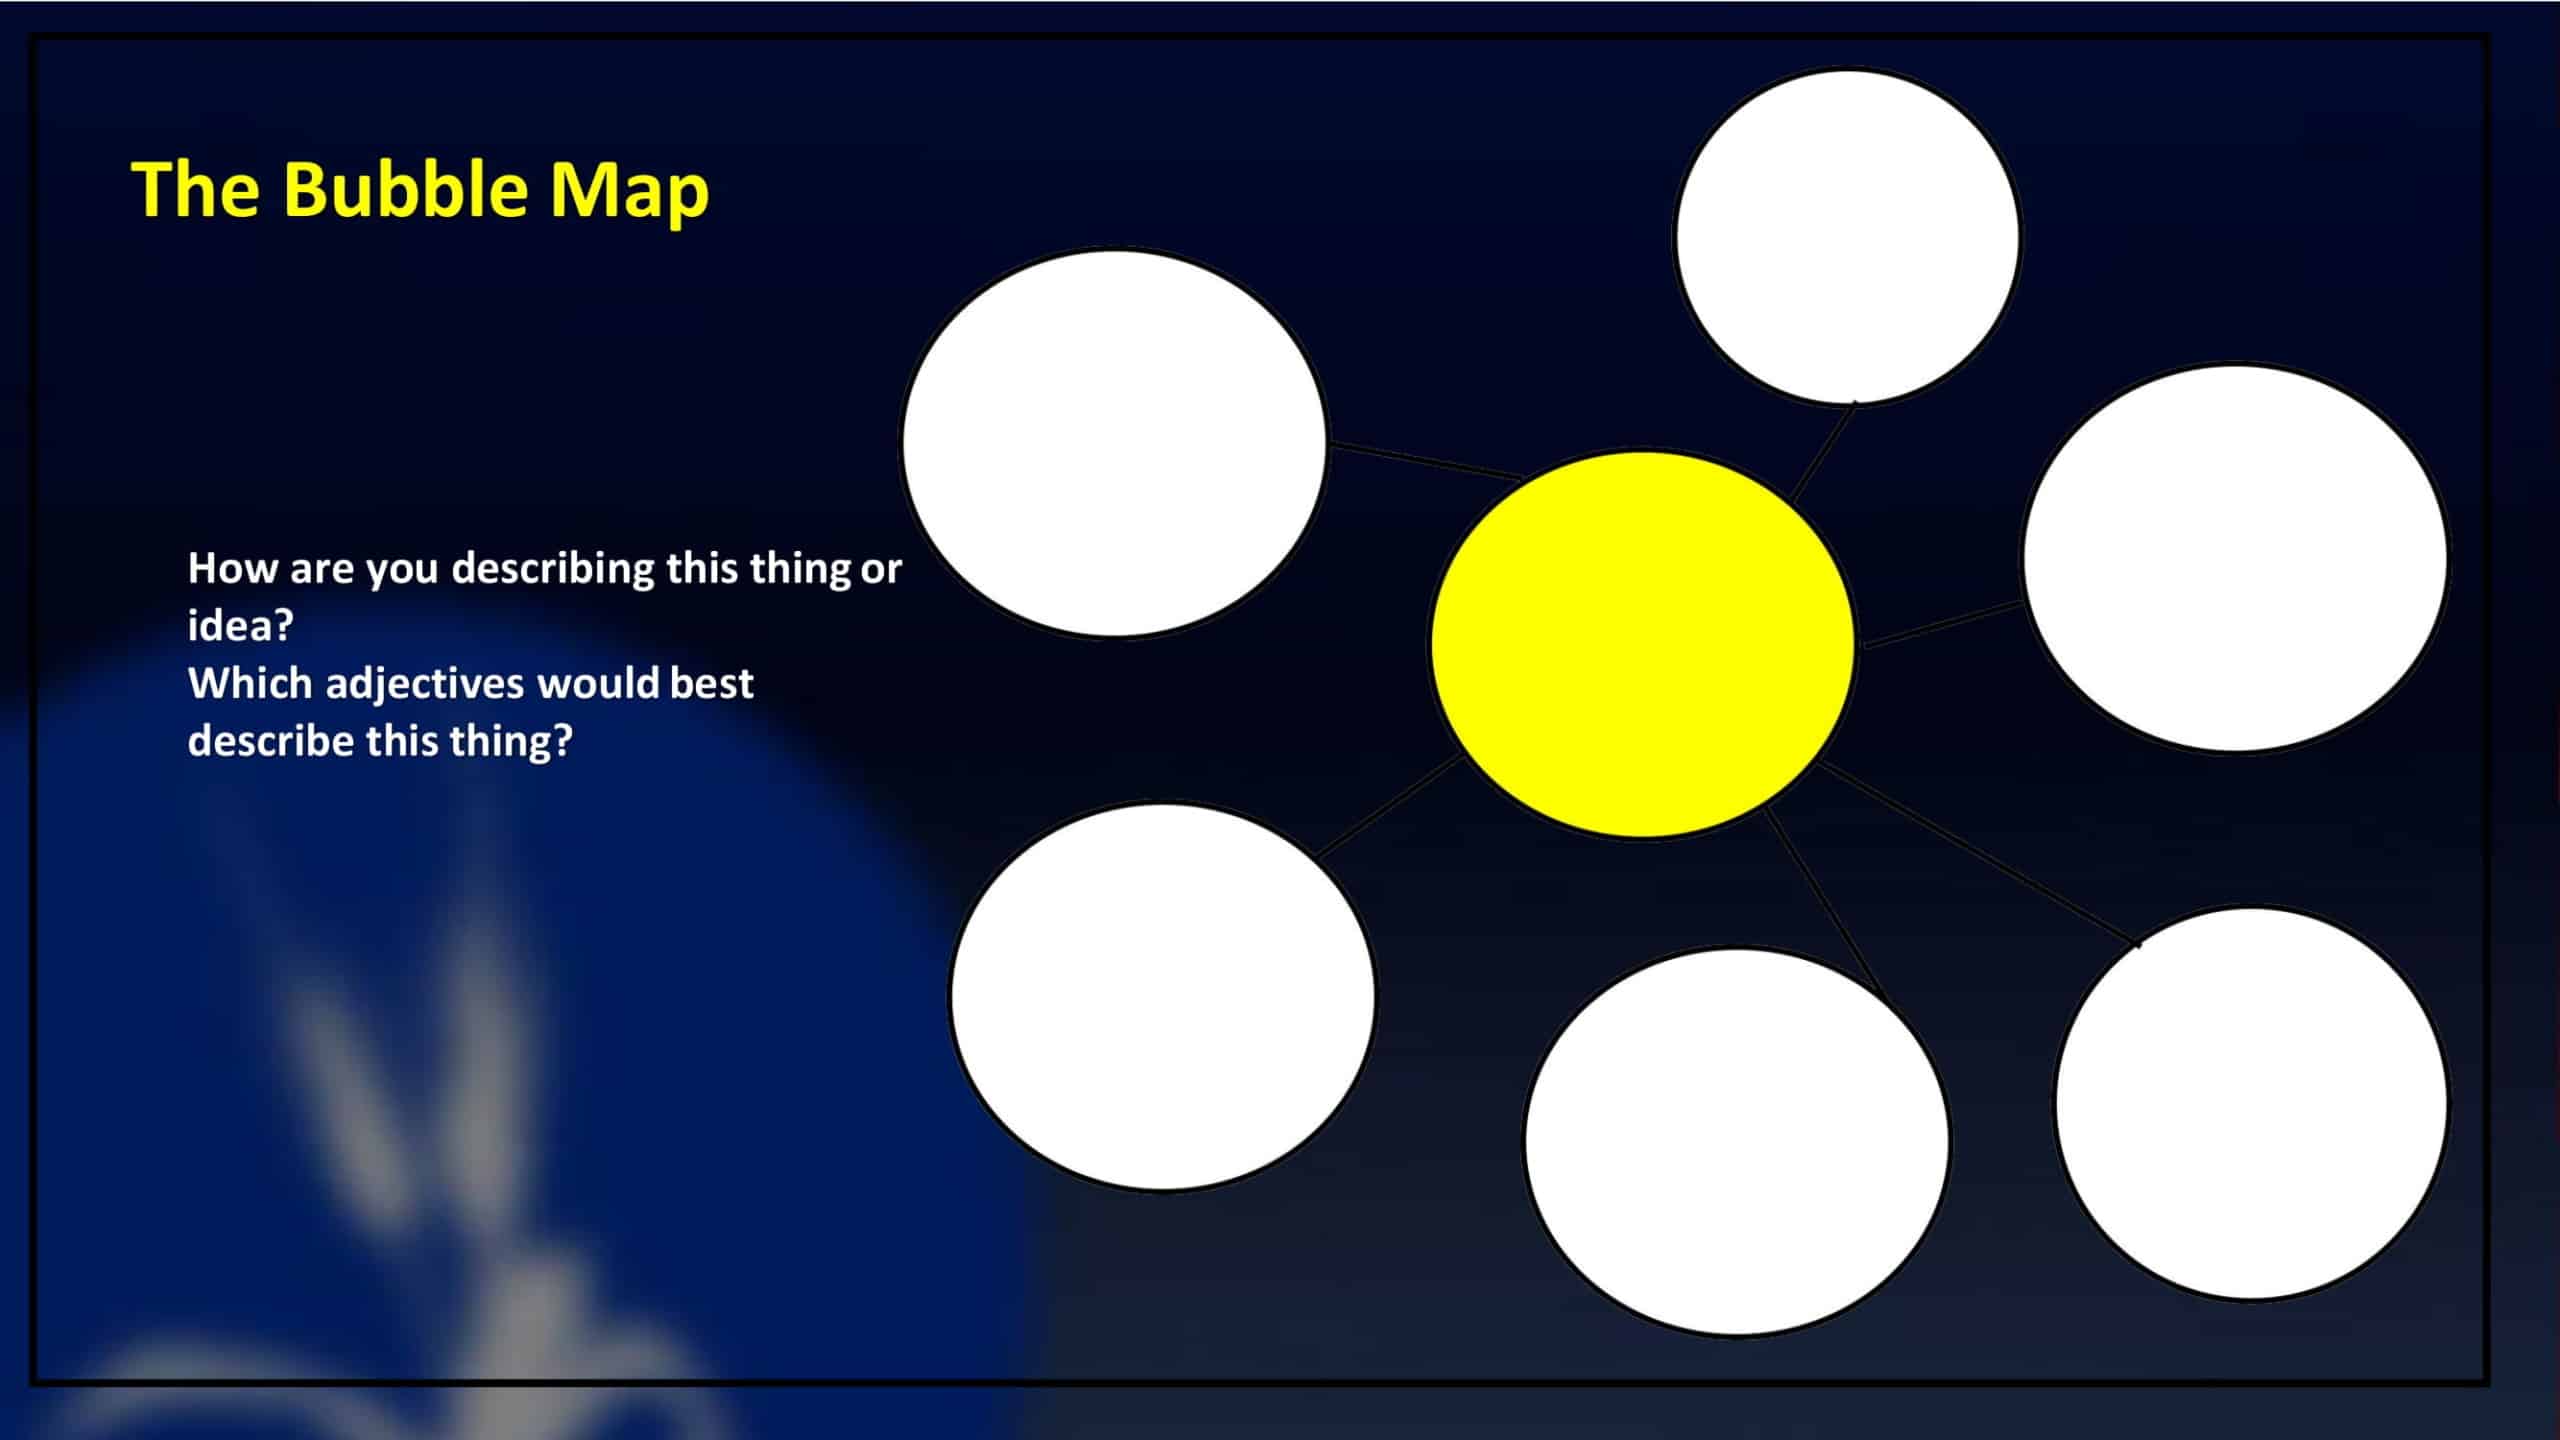
Bubble map templates typically consist of a central topic or idea represented by a large bubble or shape, surrounded by smaller bubbles or shapes that contain related subtopics or supporting details. The size and proximity of the bubbles indicate the level of importance or hierarchy of the information.
Using a bubble map template allows individuals or teams to brainstorm, organize, and visually represent complex ideas or concepts. It encourages creative thinking, critical analysis, and the exploration of connections and relationships between different elements.
Expand upon that simple bubble map by describing some of the other visual thinking maps you can use. Let’s take a look at another thinking map list:
Flow Map
Flow charts are a quick and efficient way to convey task sequences, processes, or decision-making logic. They show the direction and relationships of moving elements in an easy-to-understand format. A flow chart uses a series of boxes linked together using arrows. You can also use images to show the sequence.
Double Bubble Map
This tool is most commonly used to compare two videos, cultural preferences, and other visual mediums. Although the image may seem abstract and daunting at first, it’s actually quite simple. The larger the circle, the more traits it contains. This means that a large circle represents many similar qualities between two subjects. Smaller circles represent fewer traits between subjects — which could mean they are particularly different. The curved line shapes within each circle represent their traits as well. For example, one subject may contain two curved lines while the other includes three — meaning they share two traits but differ on one.
Tree Map
Tree Map is a free tool that allows you to create tree structures of your own to organize and categorize information. Tree maps are not just for use for subjects like mathematics but are also used by people working in areas like business, writing, and management.
Brace Map
Brace Map is an easy-to-use tool that you can use to illustrate the different parts of a concrete event or object. Logically, this only applies to a concrete concept as abstract ideas and concepts cannot be physically broken down.
Bridge Map
A bridge map is an ideal tool for constructing analogies. It is an effective method of prompting prior knowledge and gaining a deeper understanding of words or concepts whose meaning may be vague to students. These maps also help students associate words or concepts that may not be encountered together in everyday language but have a related meaning.
Multi-Flow Map
This tool can help you to identify possible causes of problems when the situation doesn’t follow a normal pattern. Let’s say you have an issue on your website with checkout forms, but you don’t know why. Visiting the Multi-Flow Map gives you a map of possible causes that could lead to your problem.
Circle Map
Circle maps are an excellent way of visualizing how a group of people or organization thinks about something. They can be super useful for brainstorming activities, especially if you want to see how everyone thinks about something.
Make Free Bubble Map
A bubble map template is a popular layout made up of circular bubbles connected to one another with thin lines. The middle circle contains the main subject, and others are linked to it with a thin line to describe it.
Bubble maps are very useful tools, similar to mindmaps and spider diagrams. They can help you brainstorm things visually and organize your thoughts. Now let’s examine how to make a bubble map;
- Once you have these, list out the adjectives that can be used to describe your nouns. These are the words you’ll use to describe the place where a noun is located.
- Create a list of adjectives that describes the noun. All list items should be unique and cannot be found in another item on the list.
- Give each adjective a bright, colored circle and place them around the noun to complete the picture.
- Finally, connect the adjectives and nouns with a line from one to the other.
FAQs
How can I create a bubble map?
To create a simple bubble map, draw circles on paper and write a topic or idea in the center circle. Draw surrounding bubbles and write related descriptive words, categories, or ideas in each bubble. Connect the bubbles back to the central topic. Color code bubbles for visual organization if desired.
How do I create a bubble map in Word?
In Word, insert text boxes to create bubbles on a page. Insert a circle text box for the central topic. Insert additional circle text boxes around it for sub-topics. Format text box colors and lines as desired. Connect boxes with arrows or lines to show relationships between ideas.
How to do a bubble map in Canva?
Open a blank Canva document and search for bubble shapes in Elements. Drag a large bubble to the center as your focal topic. Add smaller bubbles around it for sub-topics. Customize bubble colors, add text, and connect with lines or arrows. Canva has bubble map templates to start with as well.
How do I create a bubble map in Excel?
In Excel, a bubble map can be made by inserting circular shapes onto a worksheet. Size and color code the shapes to distinguish main and sub-topics. Add text inside the shape bubbles. Position shapes close together and connect related bubbles with lines or arrows. Adjust formatting as needed.
















![Free Printable Roommate Agreement Templates [Word, PDF] 1 Roommate Agreement](https://www.typecalendar.com/wp-content/uploads/2023/06/Roommate-Agreement-150x150.jpg)
![Free Printable Credit Card Authorization Form Templates [PDF, Word, Excel] 2 Credit Card Authorization Form](https://www.typecalendar.com/wp-content/uploads/2023/06/Credit-Card-Authorization-Form-150x150.jpg)
![Free Printable Blank US Map Templates [Editable] 3 Blank US Map Printable](https://www.typecalendar.com/wp-content/uploads/2023/10/Blank-US-Map-150x150.jpg 150w, https://www.typecalendar.com/wp-content/uploads/2023/10/Blank-US-Map-1200x1200.jpg 1200w)
