A bar graph is a visual representation of data, using bars of equal width to compare different categories. It’s a simple and effective way to present information in a clear and organized manner. The bars can be arranged either vertically or horizontally, allowing for customization based on the specific needs of the data being presented. Bar graphs are a common tool used by researchers, data analysts, and other professionals to effectively communicate complex information in an easy-to-understand format.
Table of Contents
What Is a Bar Graph and Why Does It Matter?

Bar charts bring together categorical data side by side to quickly show differences in volume, proportion or frequency. Since bar length mirrors magnitude, viewers see which category leads or lags without reading axes, crunching percentages, or scanning rows. Such clarity helps defend budget shares in board meetings, draw students’ eyes to the core insight in class, and spotlight performance leaps in marketing decks. In short, bar charts quickly turn co
TypeCalendar’s 48 Template Bar Graph Collection
Each template in TypeCalendar’s collection is designed to appeal to different expressive languages. The training packages are pastel-toned, have a wide axis and a notepad area, making it easier to annotate the course material. Business and finance templates make a strong first impression in senior management presentations with contrasting colors on dark backgrounds.
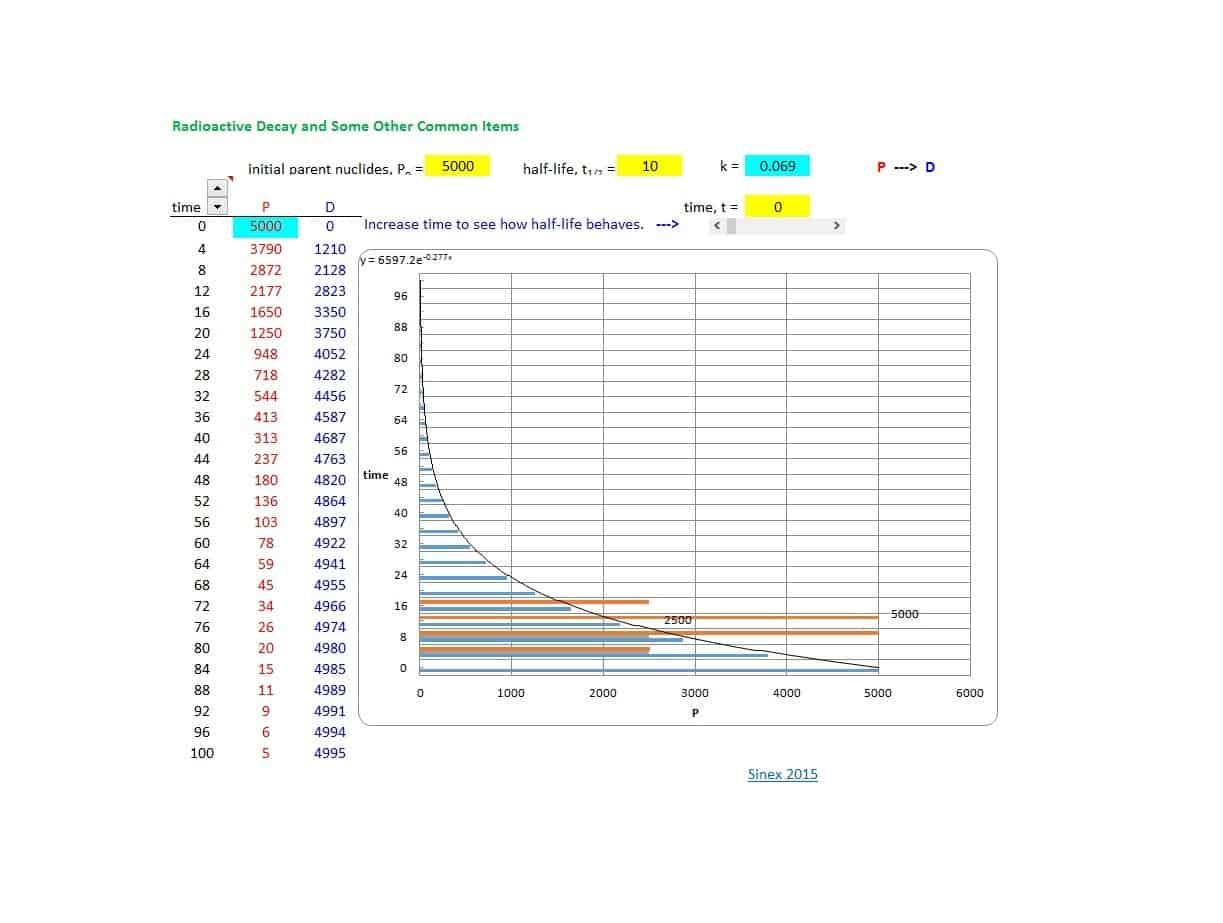
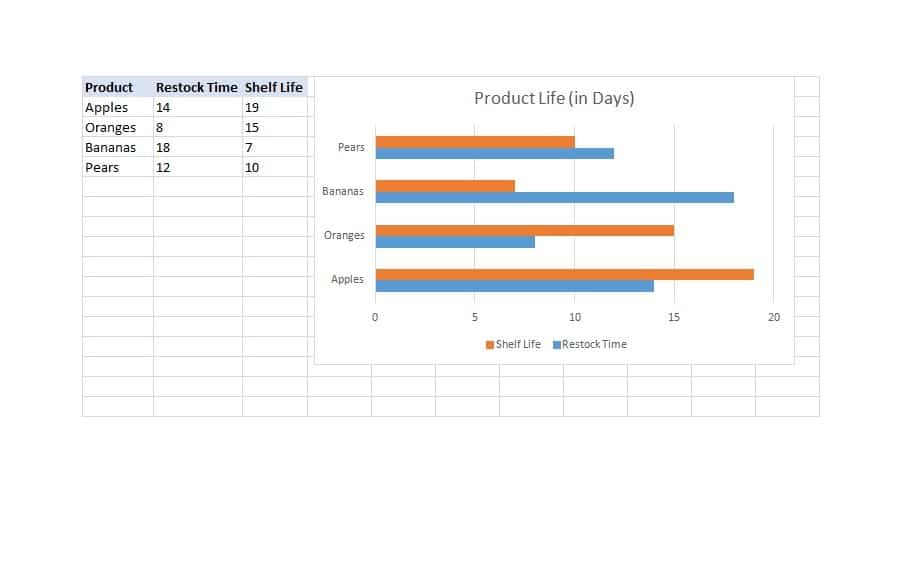
Marketing & social media focused designs fit into a horizontal 16:9 ratio; there are also alternatives compatible with Instagram square and story sizes. Scientific research plots include millimeter-scale, fine-line backgrounds and ± error bar areas. Expanding from simple two-category columns to multi-axis, stacked (stacked) and percentile normalized (100% stacked) versions, this 48 template package offers the appropriate graph, no matter how complex the data is.
Formats, Ease of Editing and Sharing
Each bar chart template comes in dual formats: PDF and PPTX. PDF is ready for office printing with 300 dpi CMYK settings, while PPTX allows drag-and-drop editing in PowerPoint or Google Slides. Embedded formulas are prepared in XLSX/Sheets files to automatically update the chart as soon as you change the raw data, so you can refresh your monthly report in minutes. For designers, SVG/EPS layers make changing the color palette and font in Illustrator or Figma a few clicks away. High-resolution PNG and frame-rate JPG outputs for mobile sharing and social media posts are also included in the package; you can collect feedback by sending it to the Slack channel or WhatsApp group with one tap.
Analysis & Presentation Tips
After opening your chart, a few simple tactics are enough for the visual effect to peak. First of all, if the number of categories is high, reduce the color saturation and use different shades of the same tone; this reduces the fatigue of the eyes looking at the screen. Placing the highest value on the left or top when sorting data points supports the reader’s natural reading orientation.
Short but descriptive titles summarize what the graph is saying in one sentence; you can avoid visual clutter by storing detailed comments in footnotes. If you’re using a stacked bar chart, adding a label that shows the sum of the sections clarifies how all the pieces form the bigger picture. Making the bars appear one by one with animation during the presentation directs the audience’s attention step by step to the increasing or decreasing trend.
Download Now—Tap into Raw Data Power!
In short, you don’t need to spend long hours turning raw data into a striking visual. Choose the one that suits your project from TypeCalendar’s 48 bar graph templates, add your colors and data, convert it to PDF with one click or embed it in your Slides presentation. So the numbers stay with you, and the story is told by your graph.


![Free Printable Credit Card Authorization Form Templates [PDF, Word, Excel] 1 Credit Card Authorization Form](https://www.typecalendar.com/wp-content/uploads/2023/06/Credit-Card-Authorization-Form-150x150.jpg)
![Free Printable Stock Ledger Templates [Excel,PDF, Word] 2 Stock Ledger](https://www.typecalendar.com/wp-content/uploads/2023/08/Stock-Ledger-150x150.jpg)
![Free Printable Financial Projections Templates [Excel, PDF] 3 Financial Projection](https://www.typecalendar.com/wp-content/uploads/2023/05/Financial-Projection-1-150x150.jpg)
