Last updated:
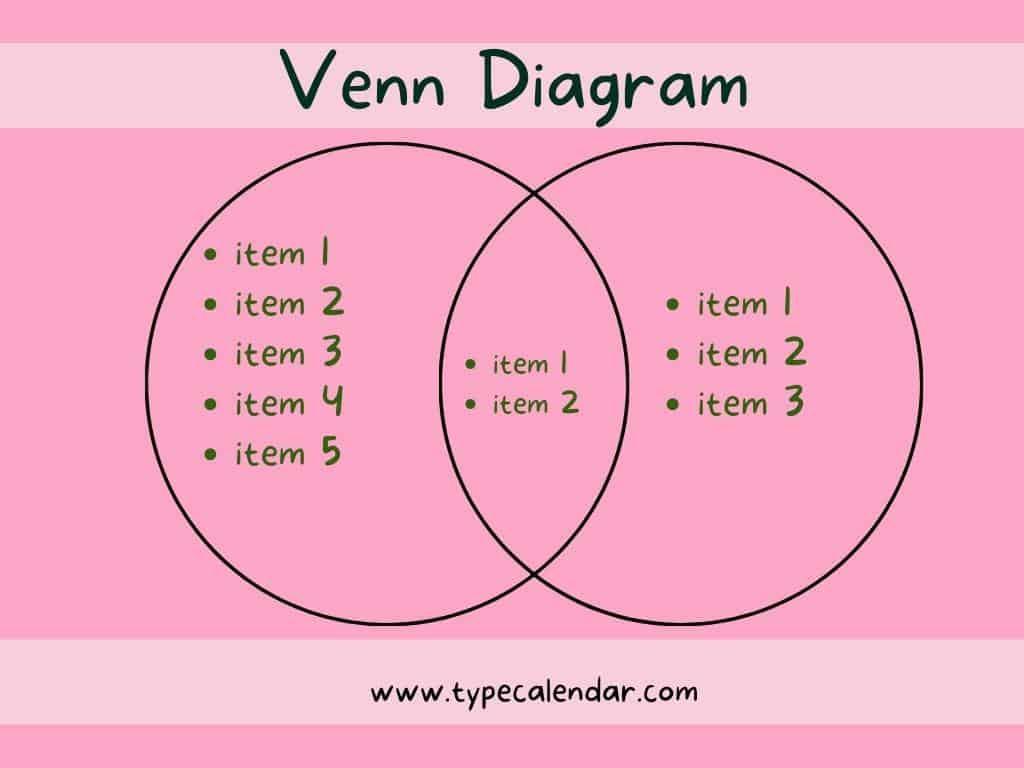
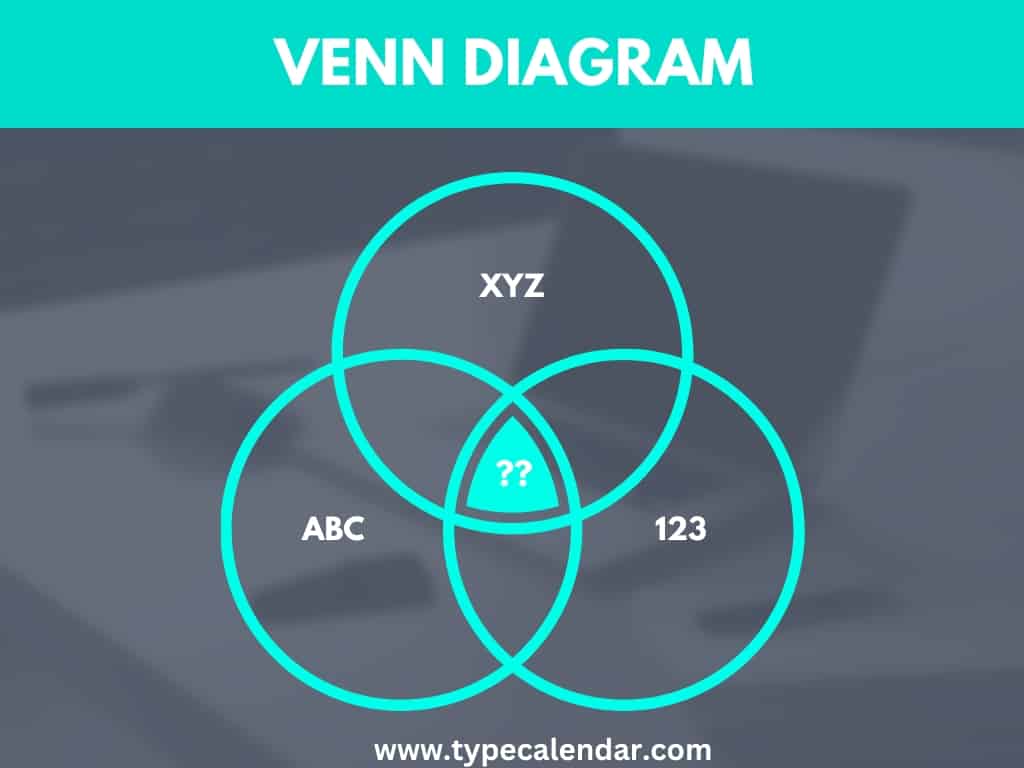
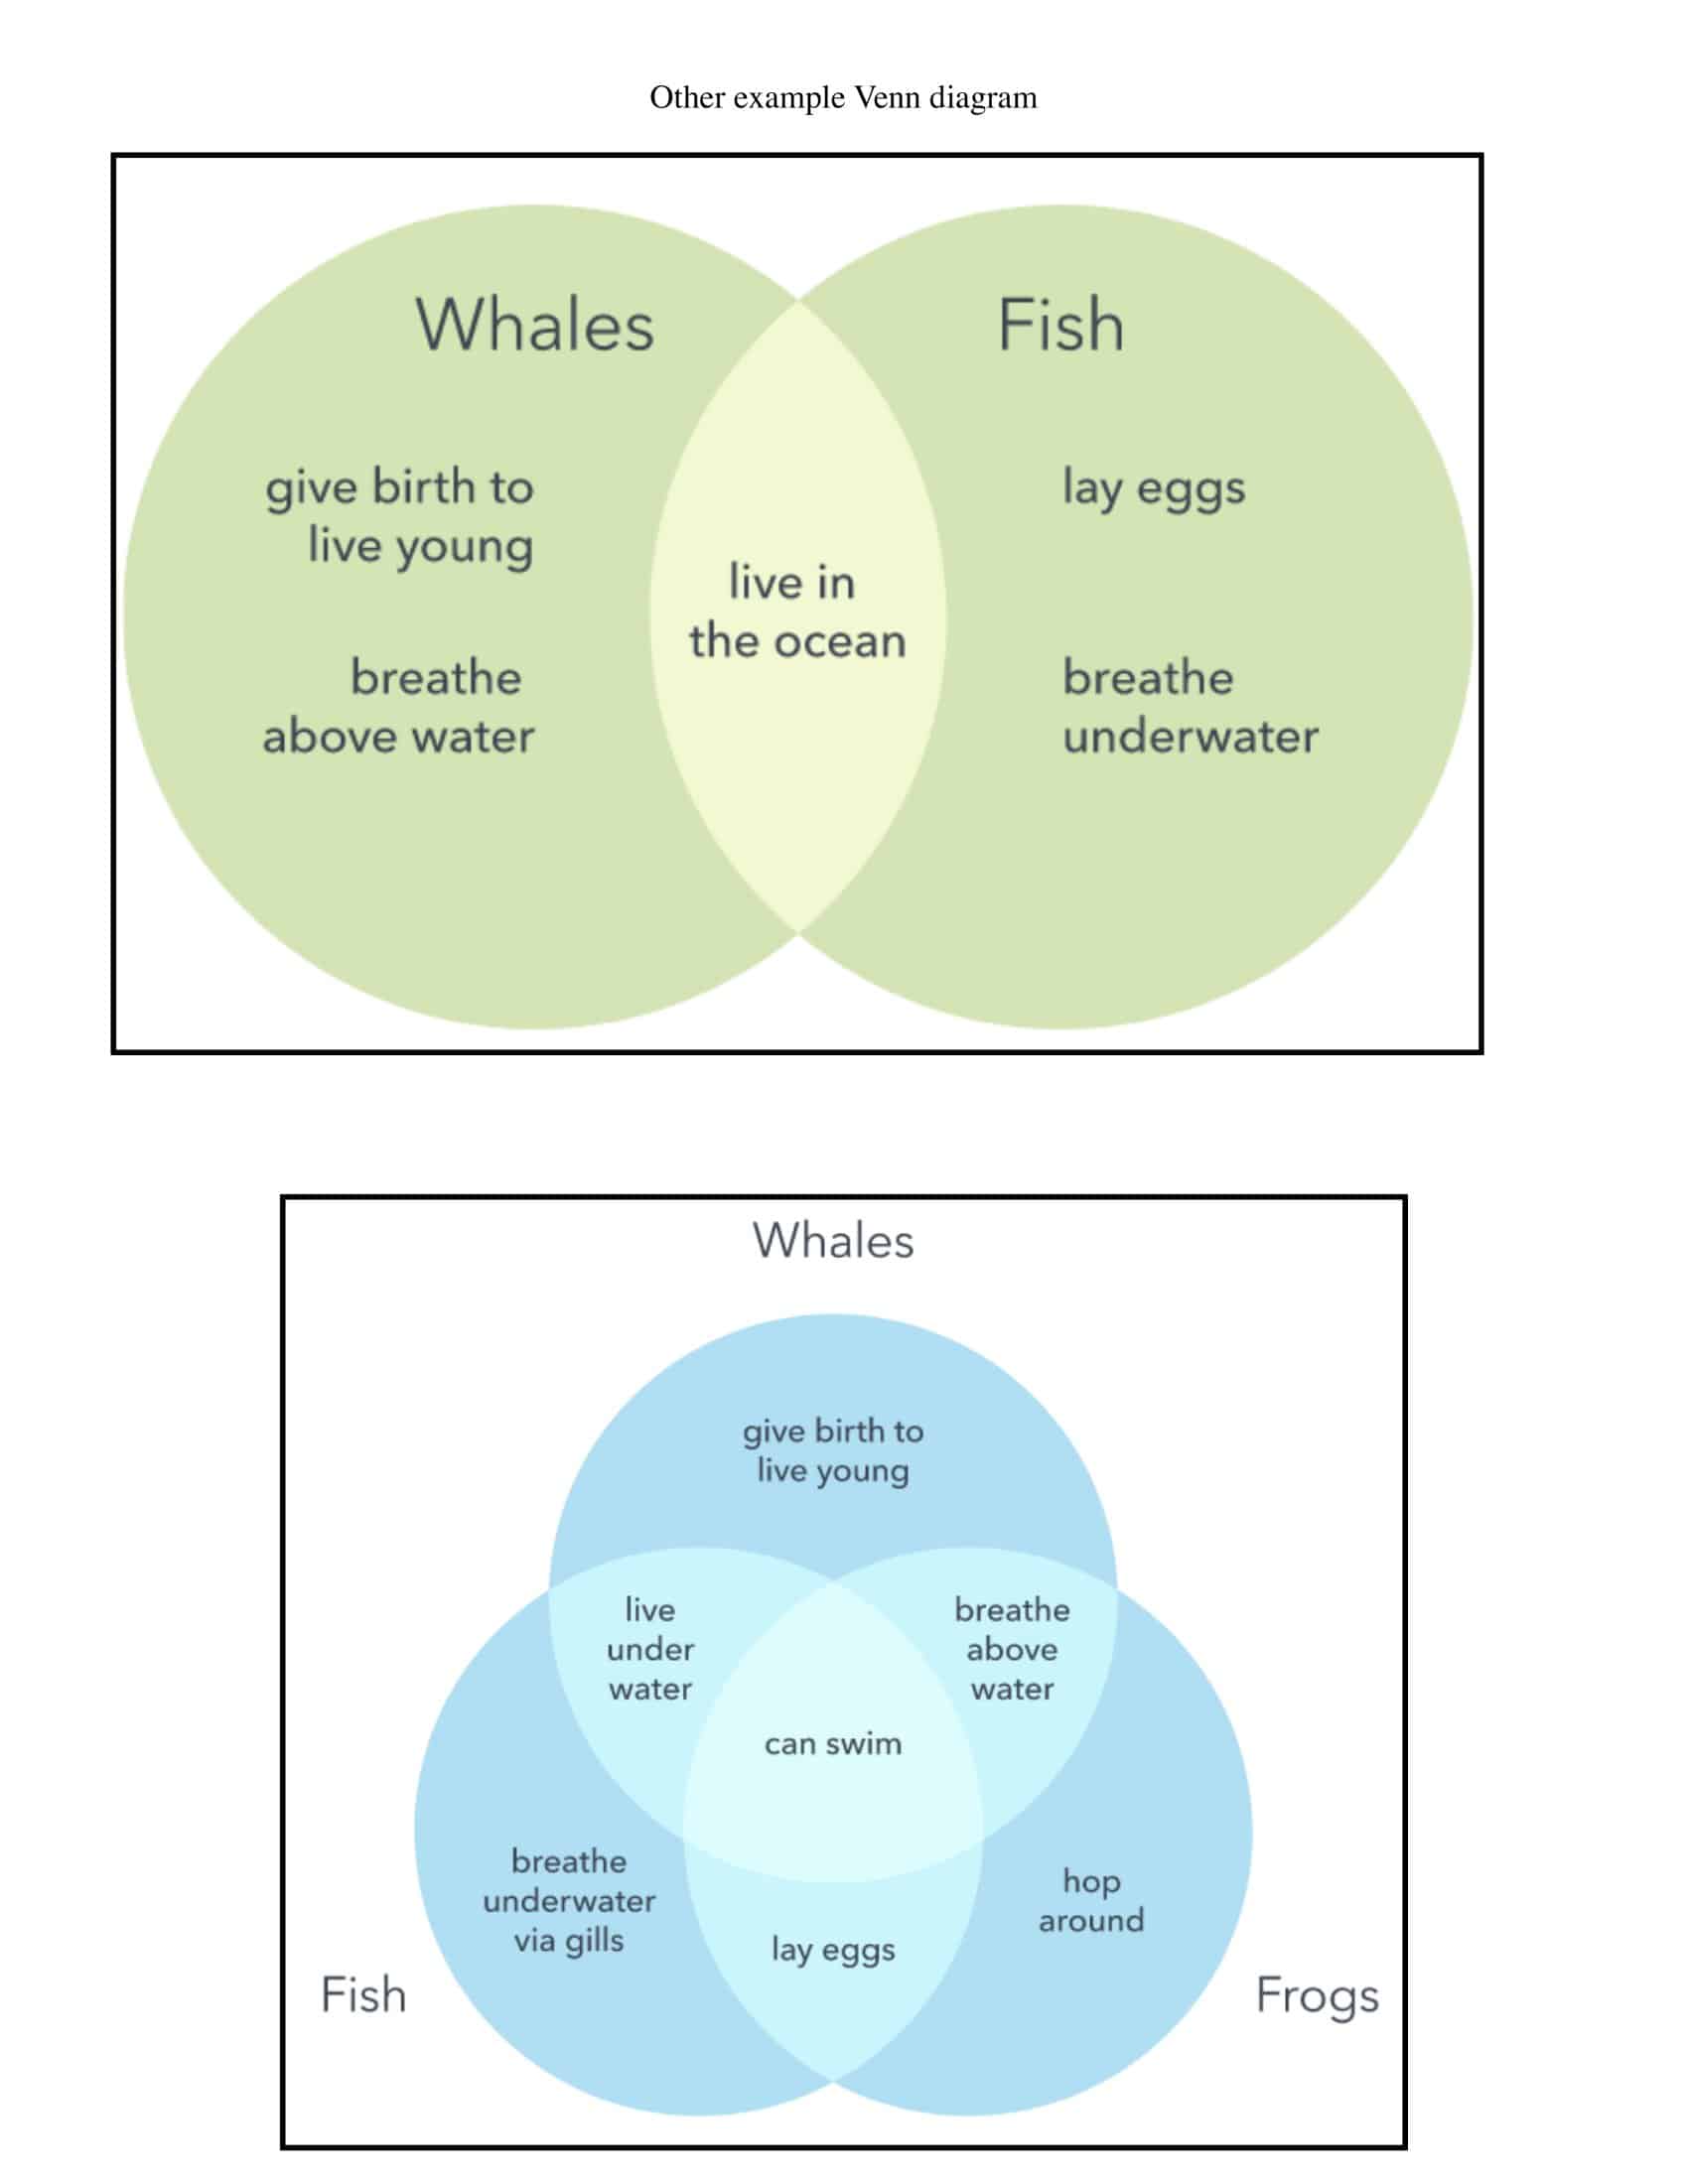
Describing the common points of two or more sets in words often leads to long sentences, complex tables and the risk of misunderstanding. A Venn diagram lays those relationships bare inside colorful rings. Whether you segment a Sunday audience or compare shared genes in biology class, the viewer asks, “What overlaps here?” and sees the answer in seconds. Because visual memory kicks in, the presenter’s pace quickens and the audience stays engaged longer.
Table of Contents
58 Flexible Venn Diagram Templates

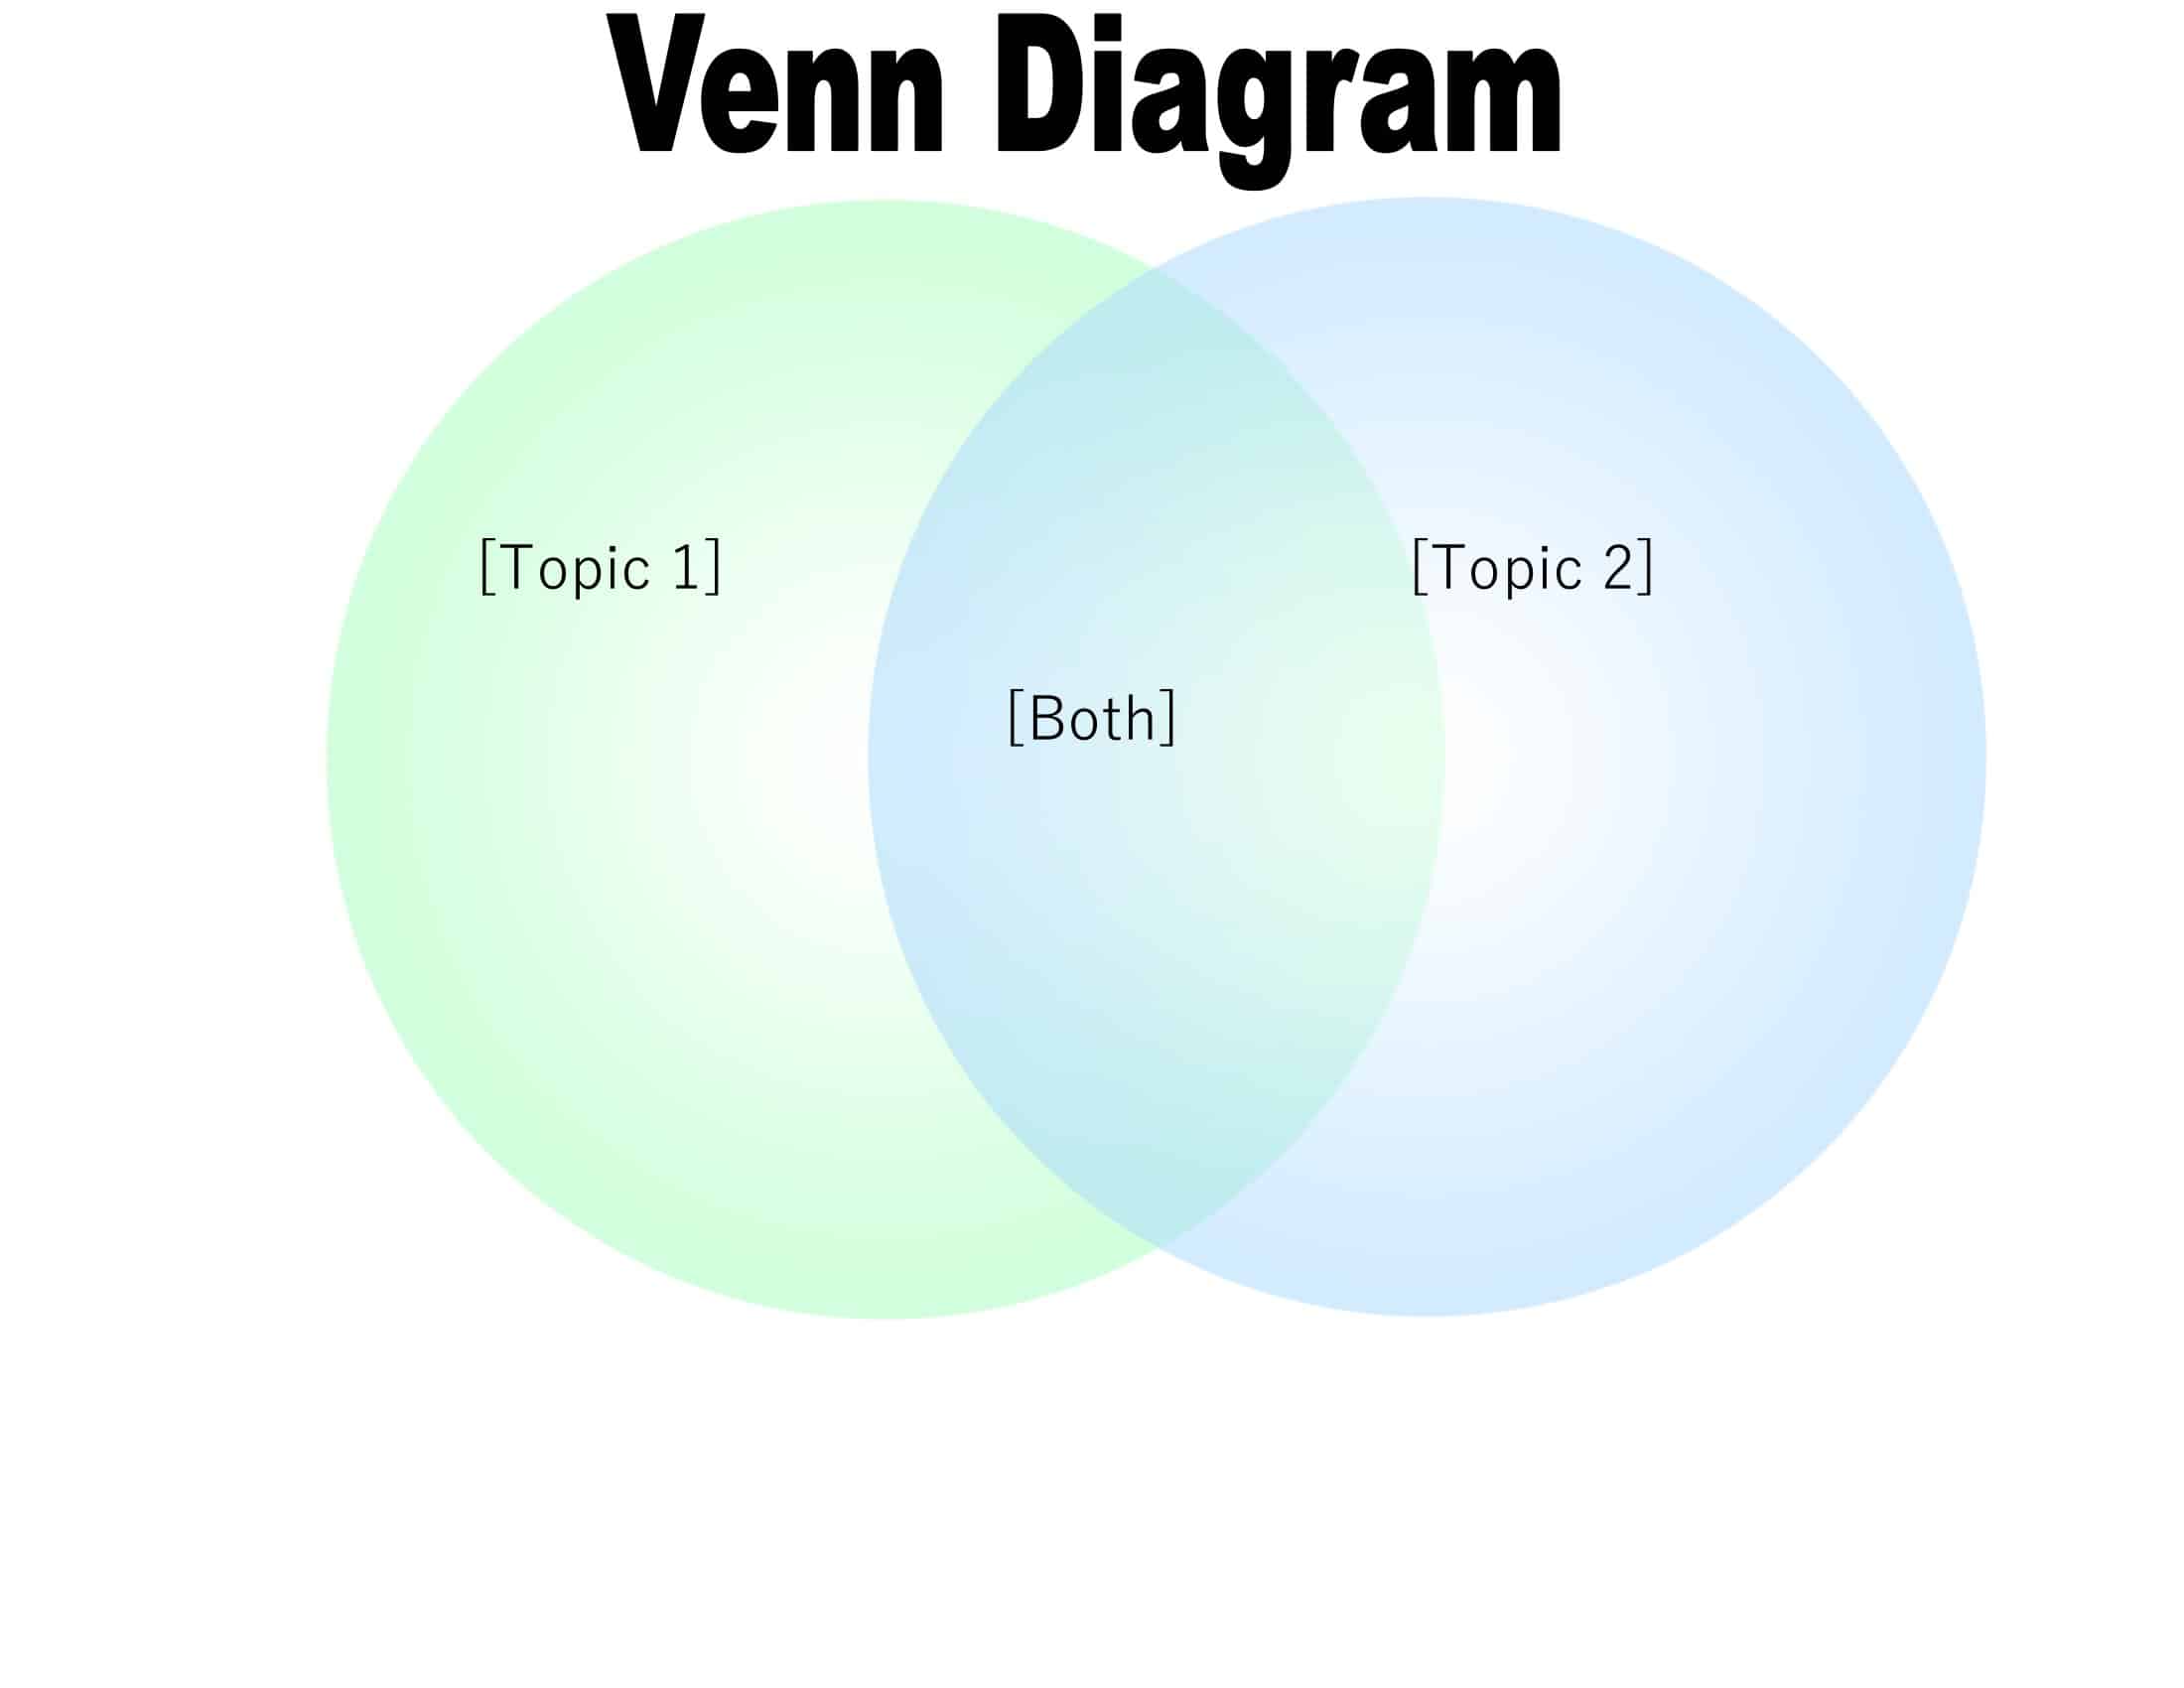
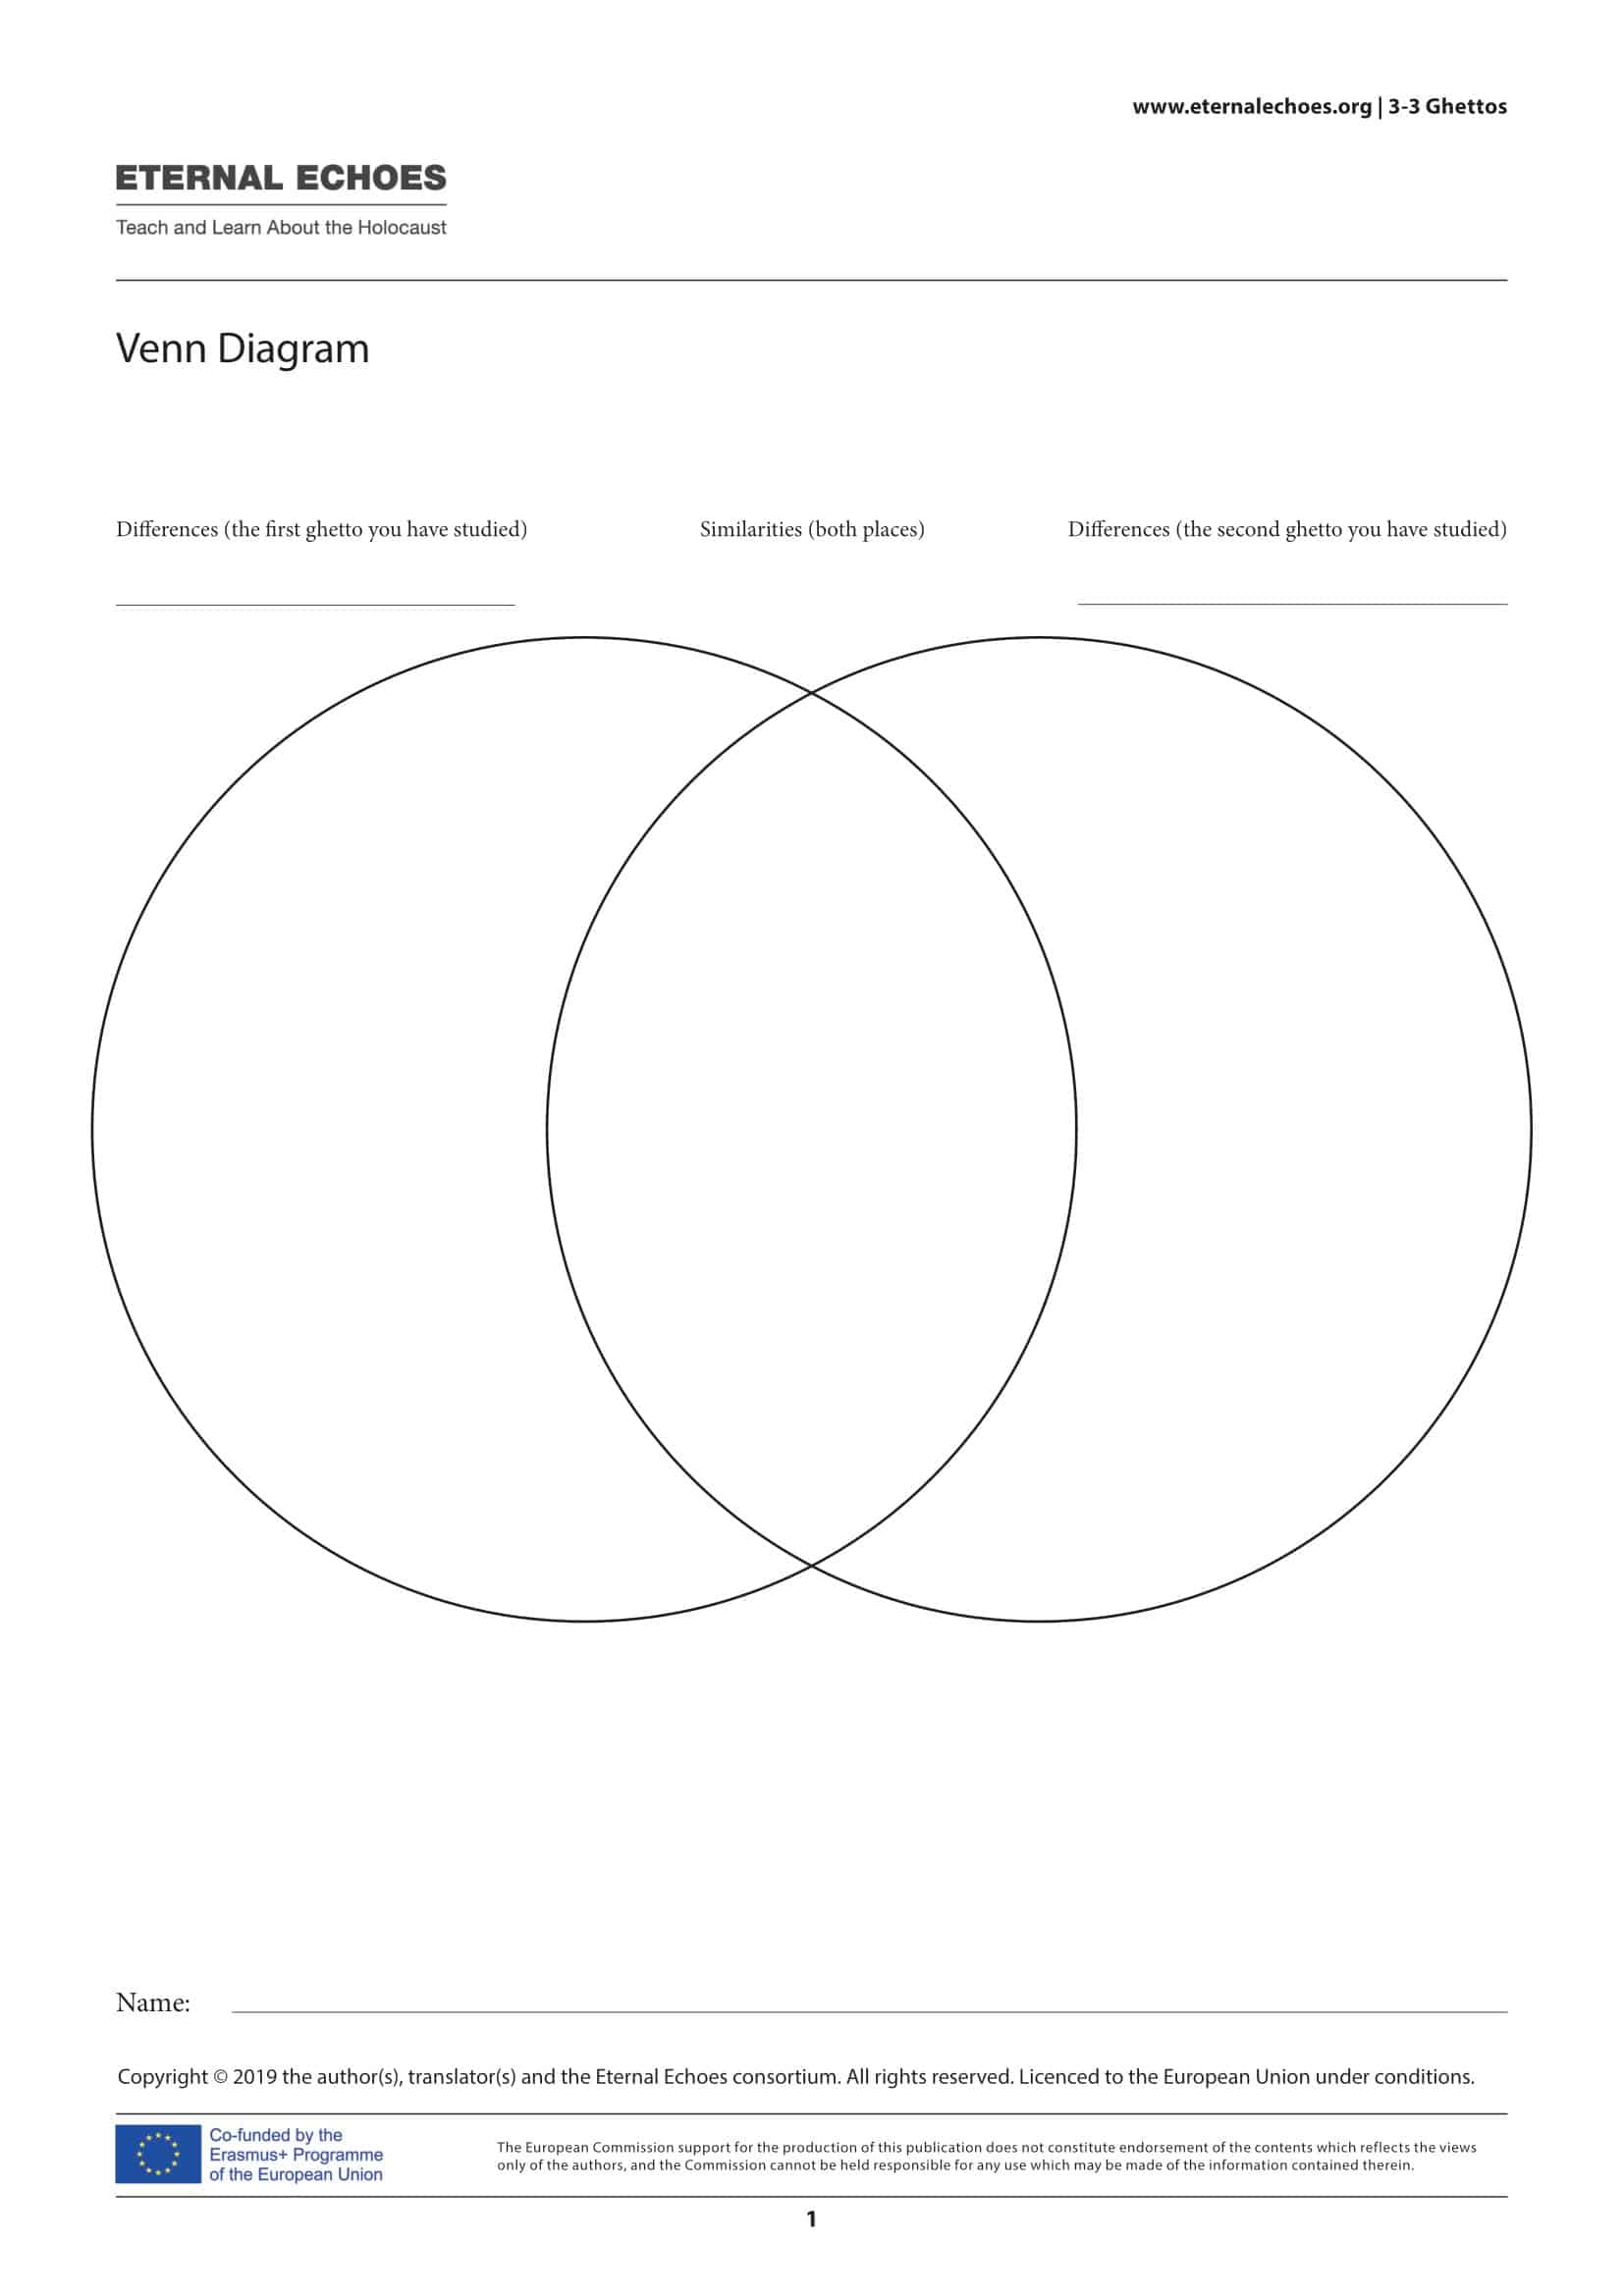
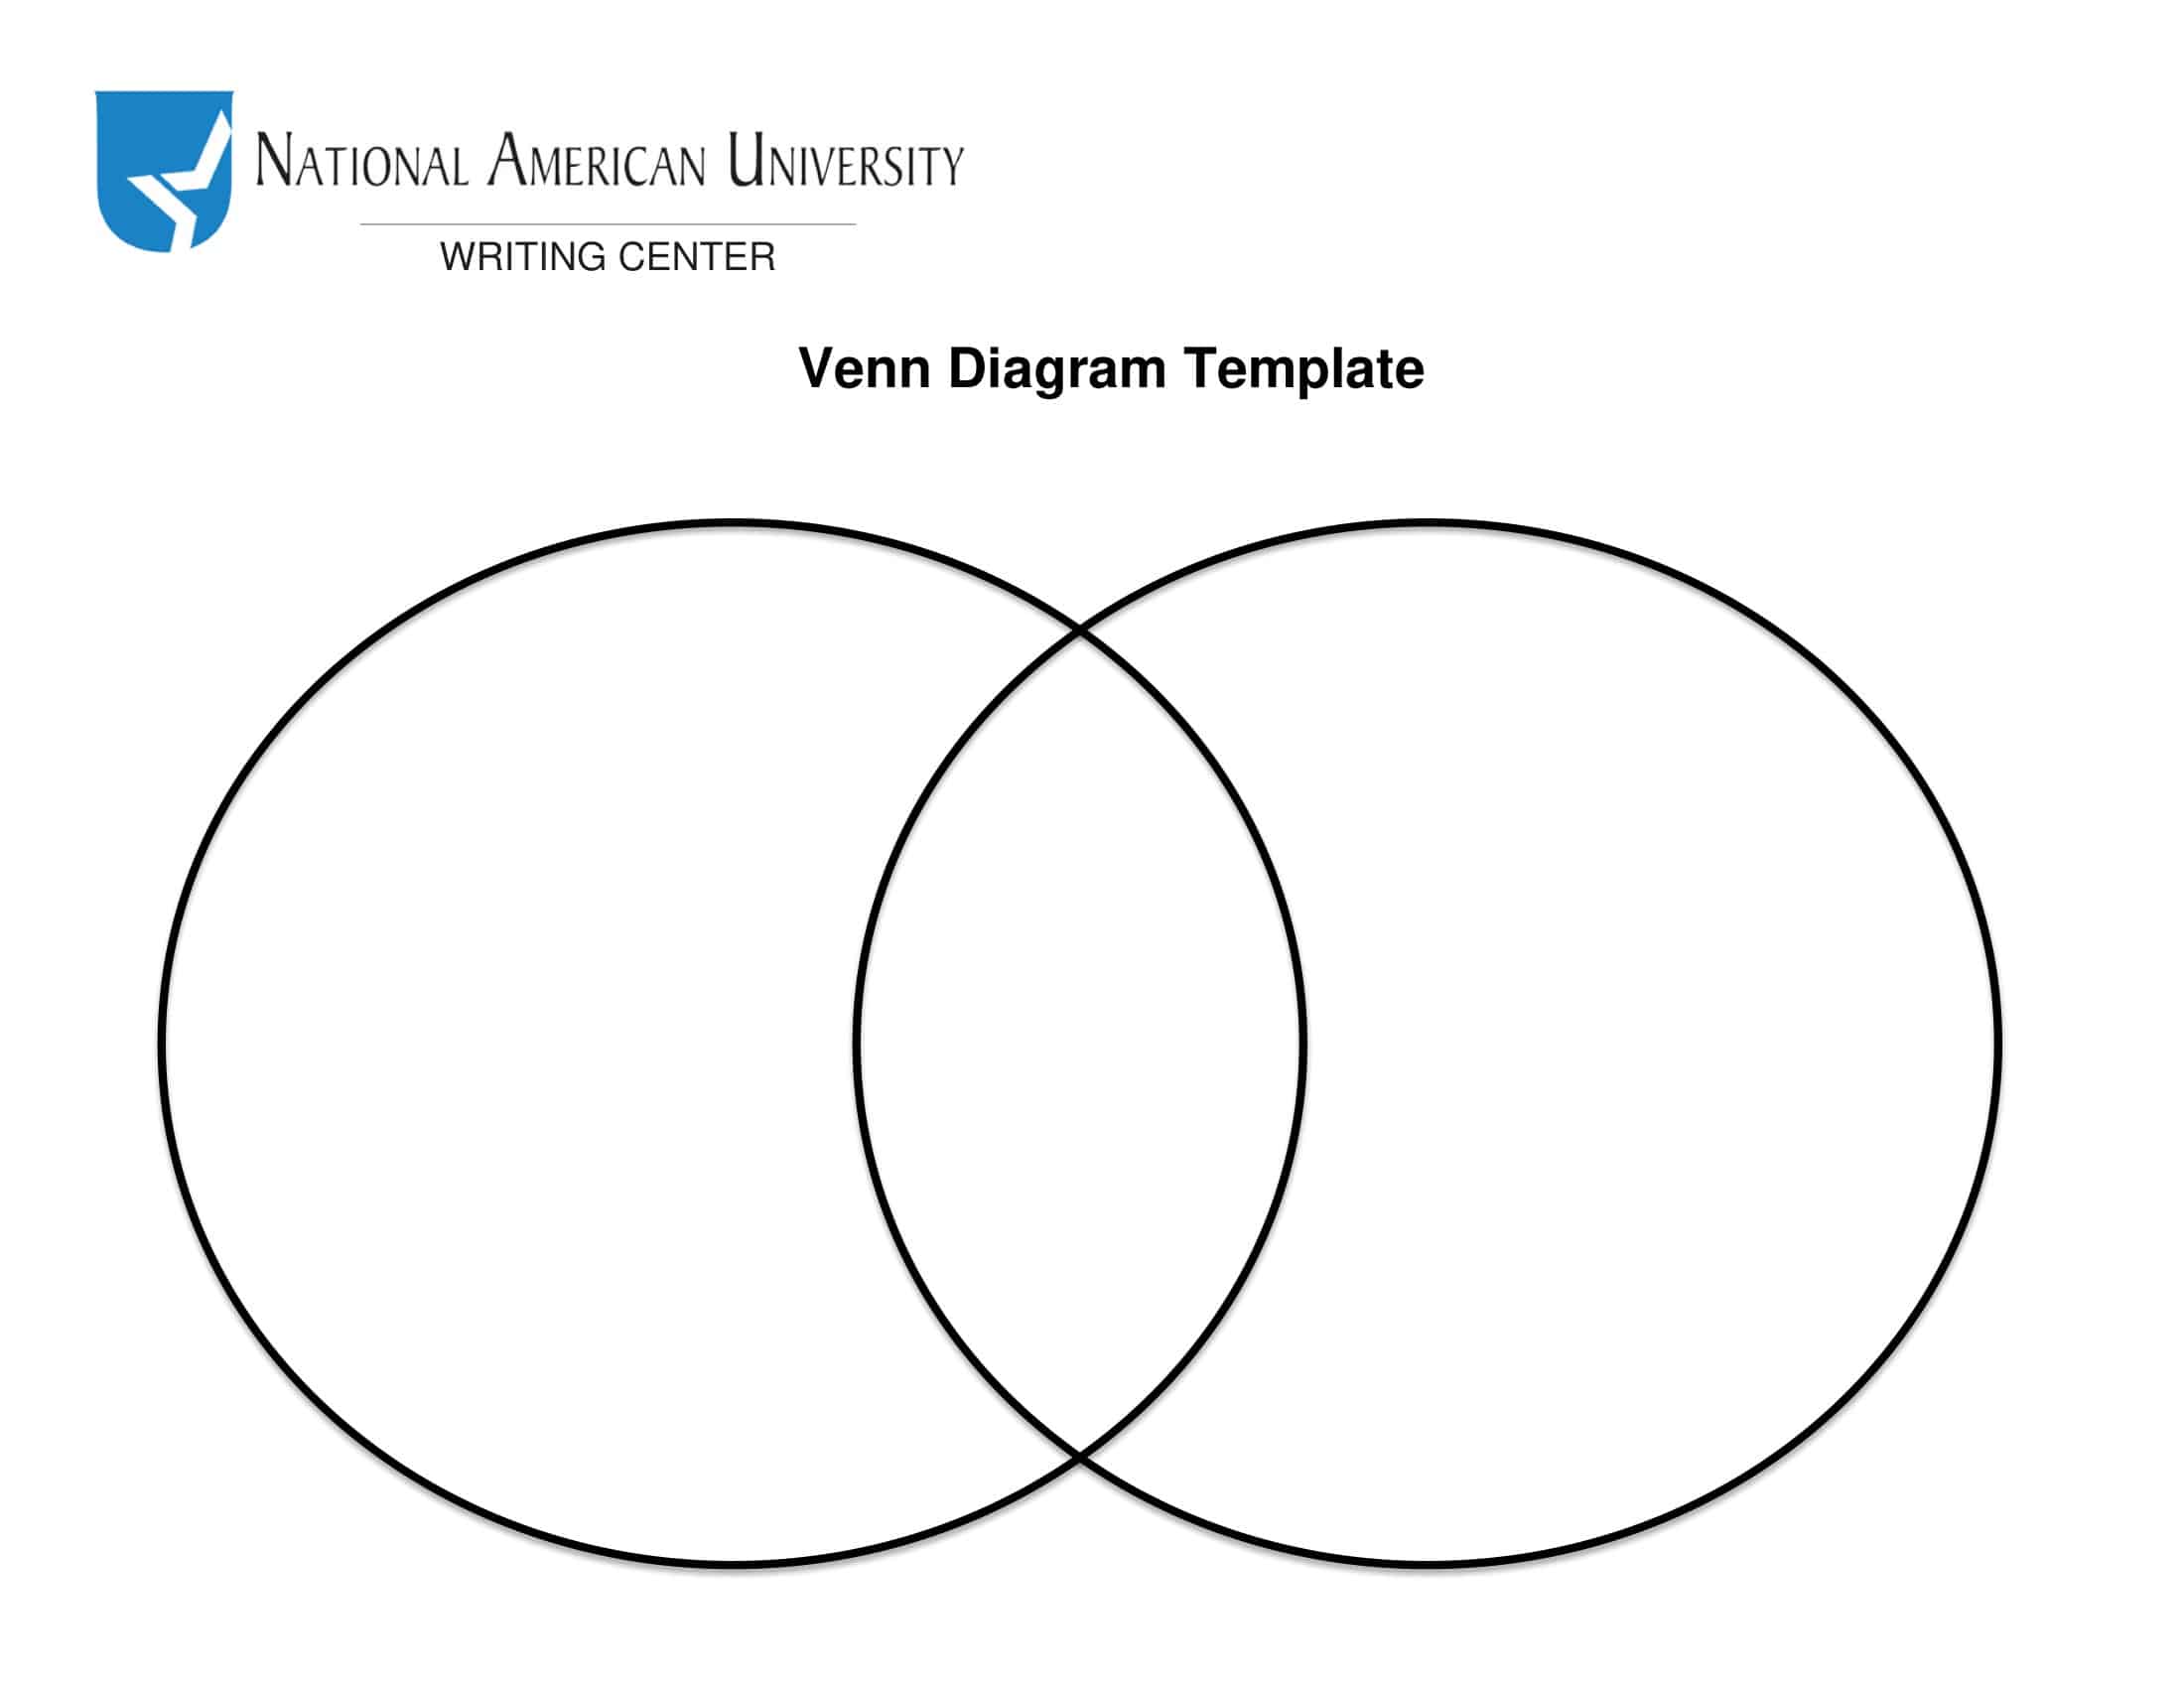
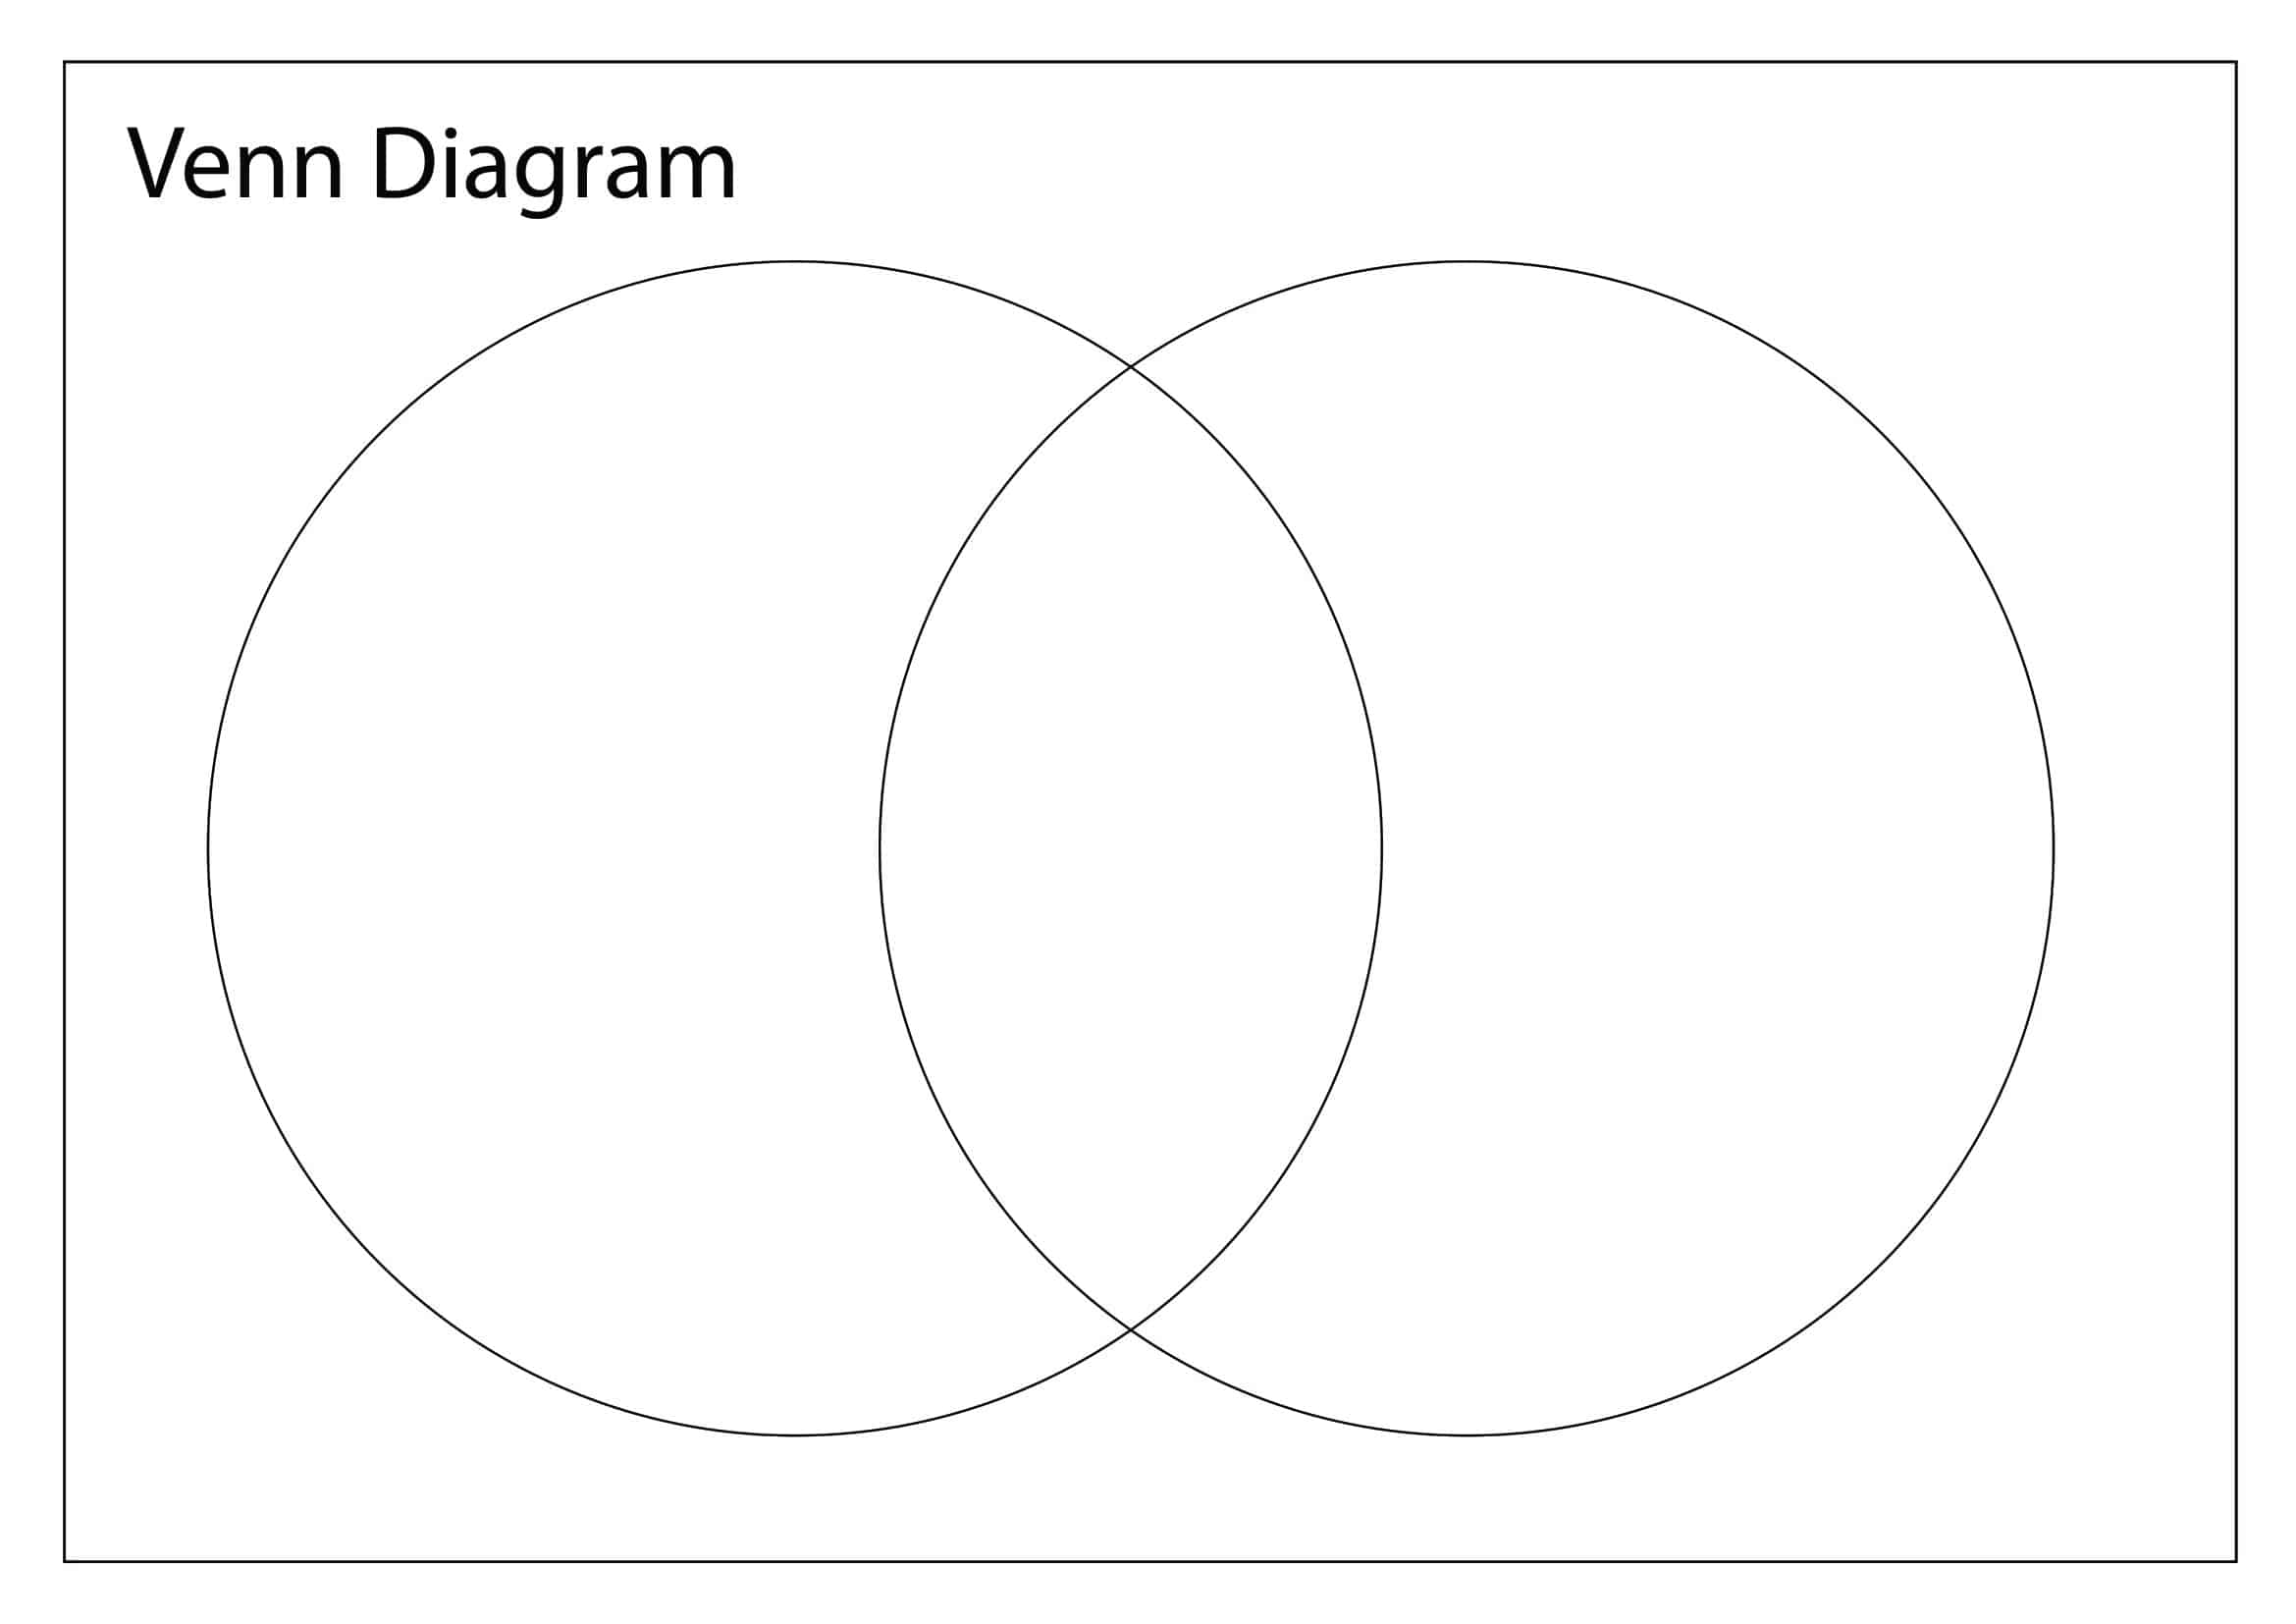
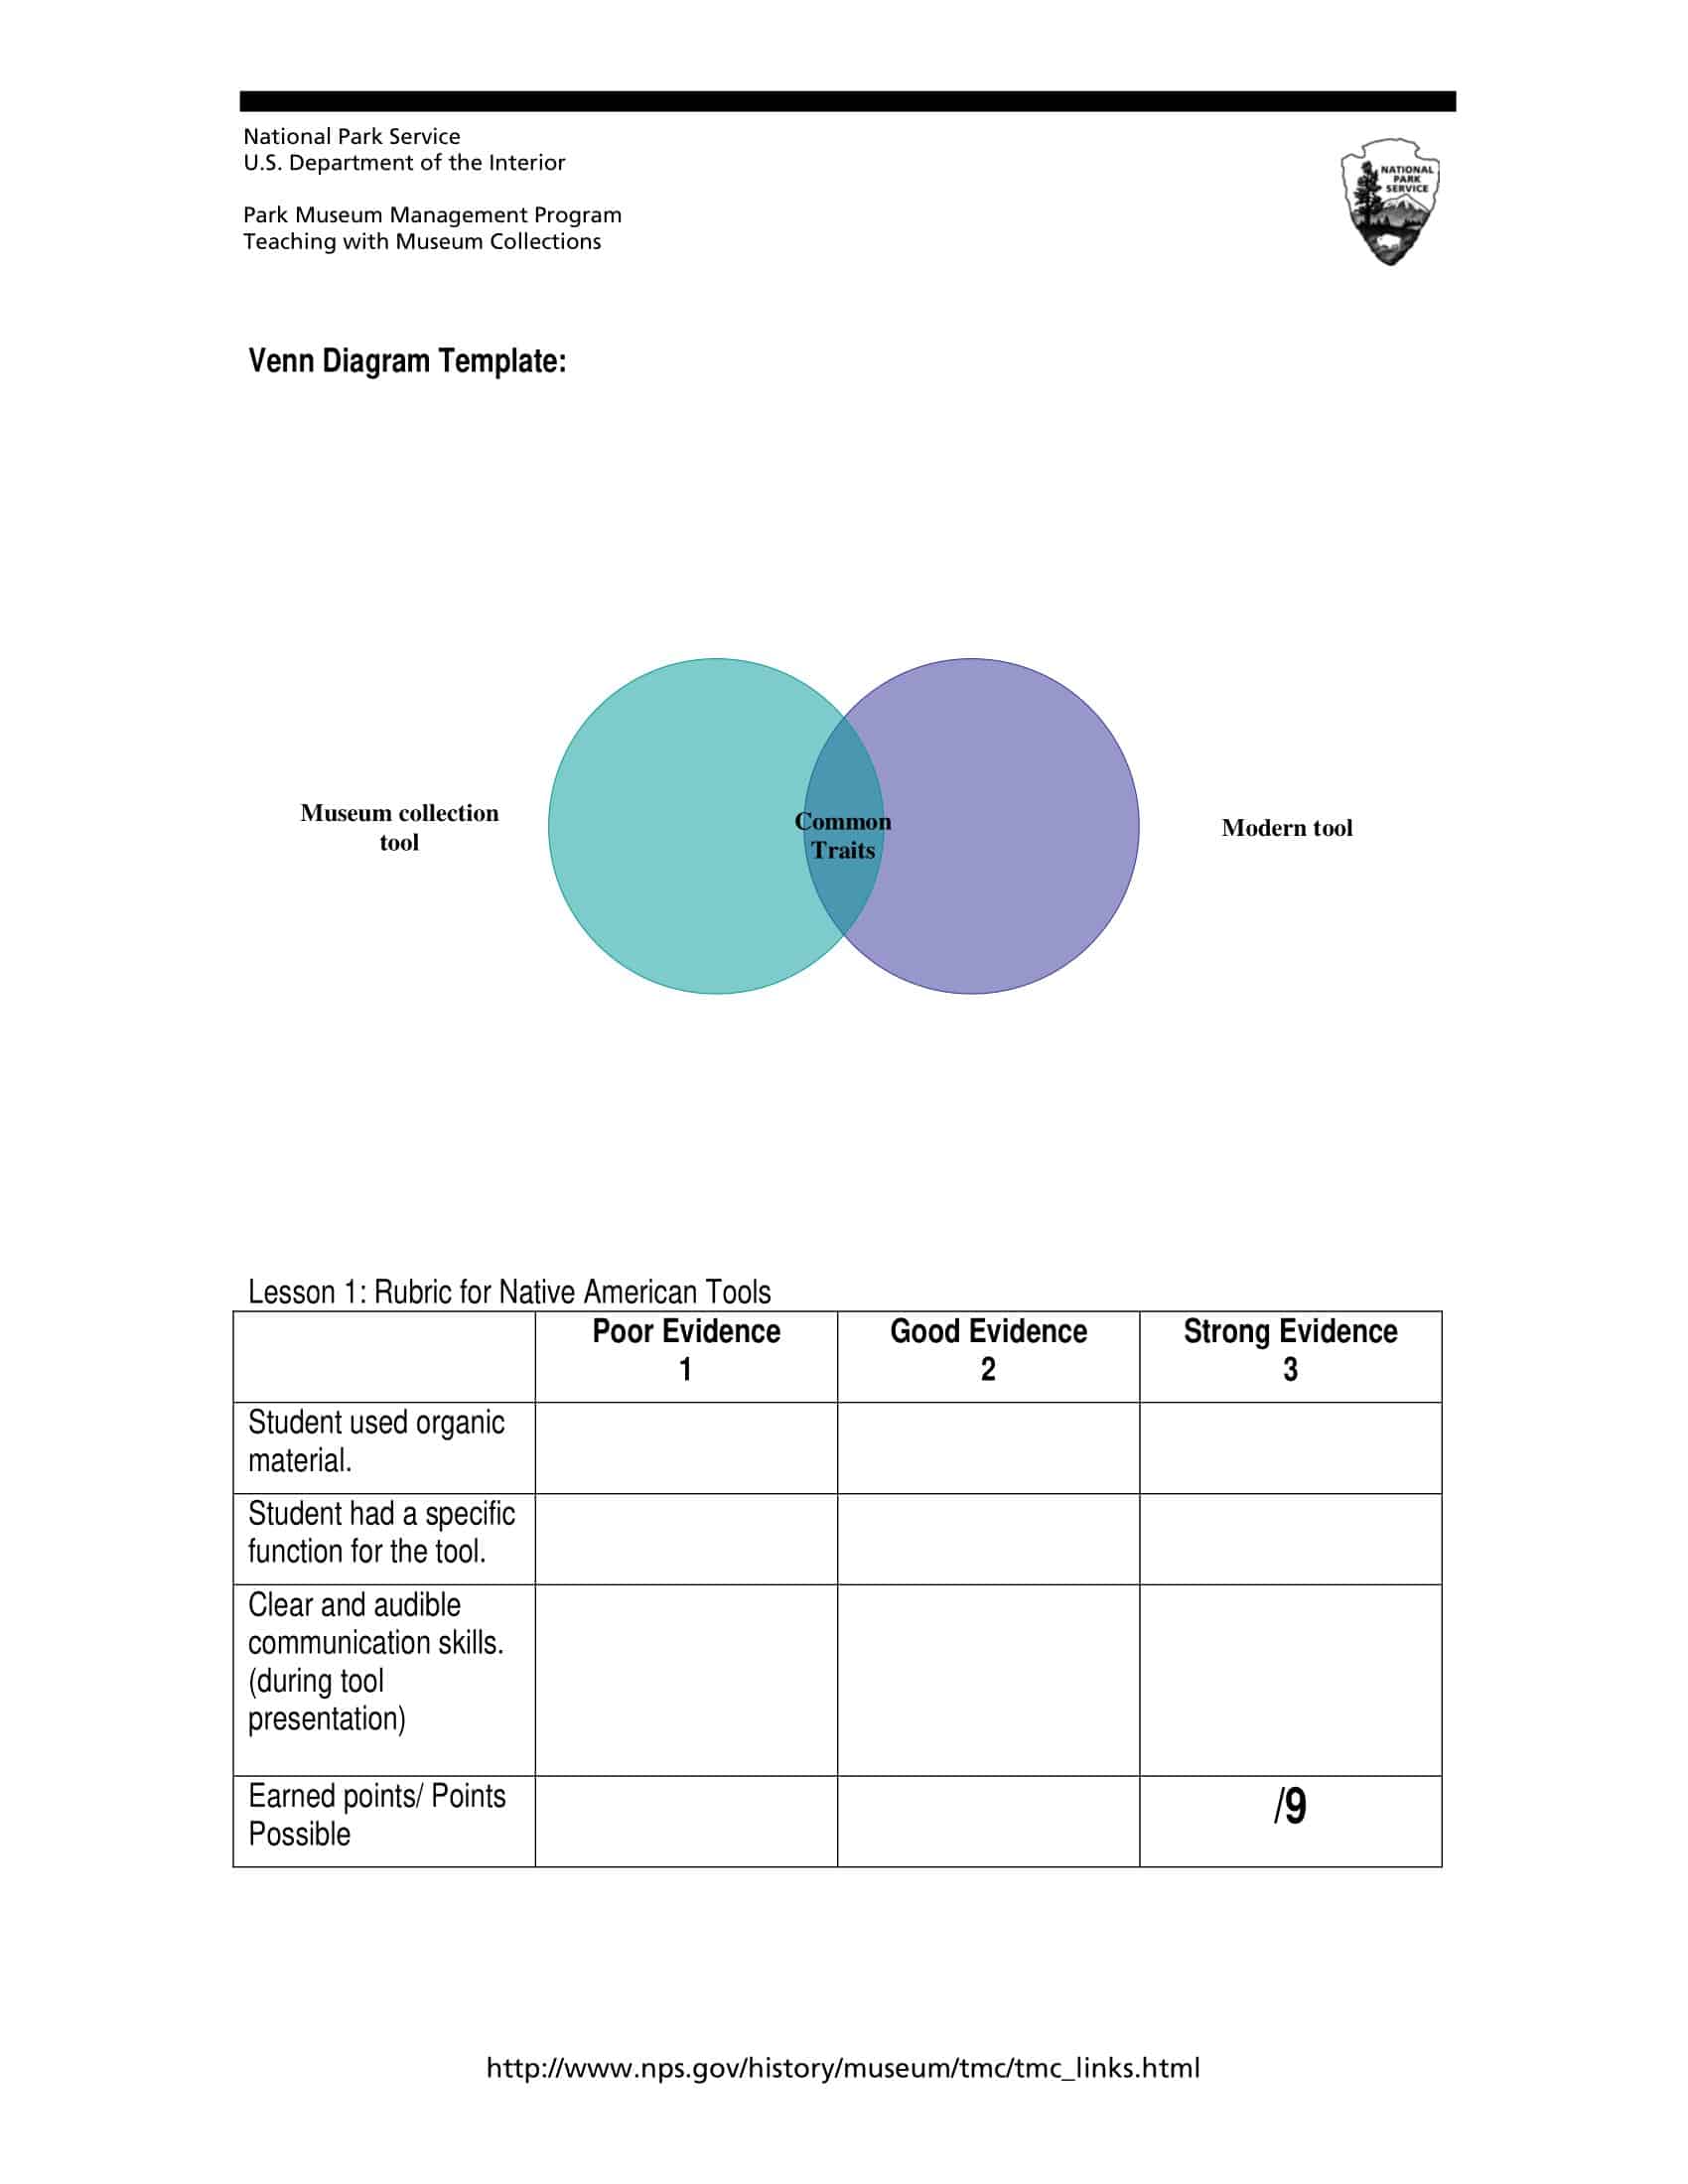
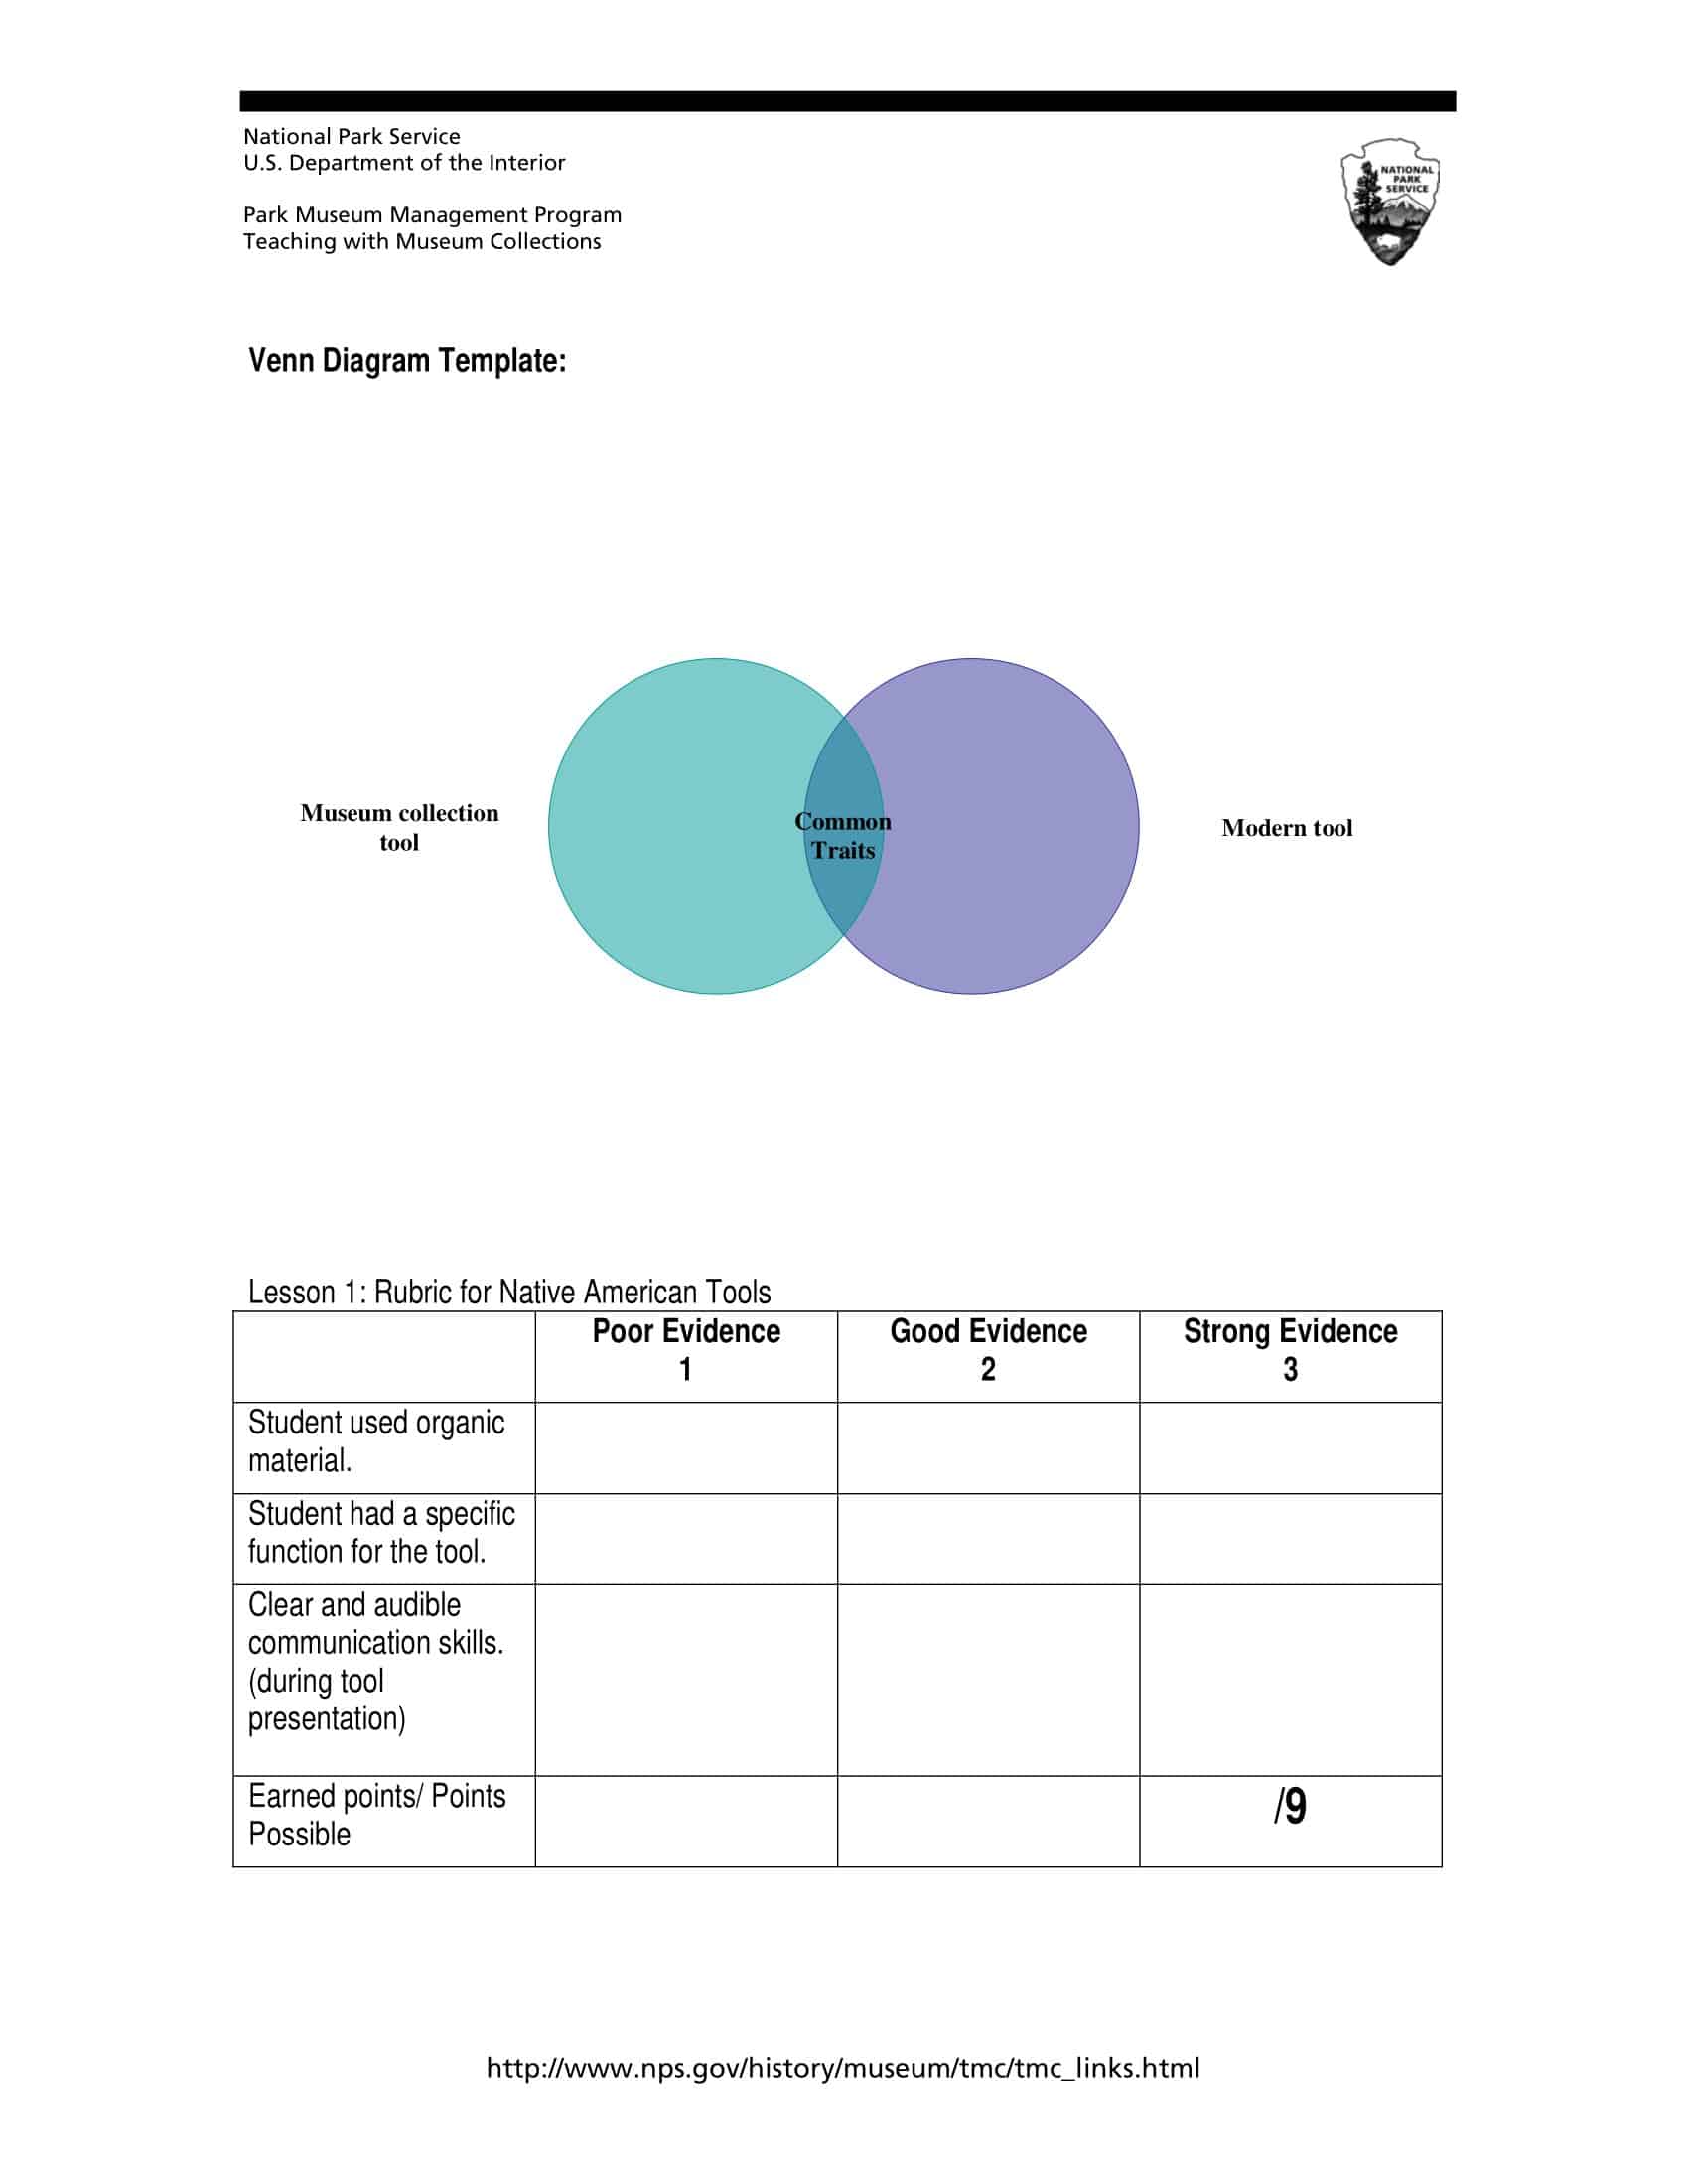
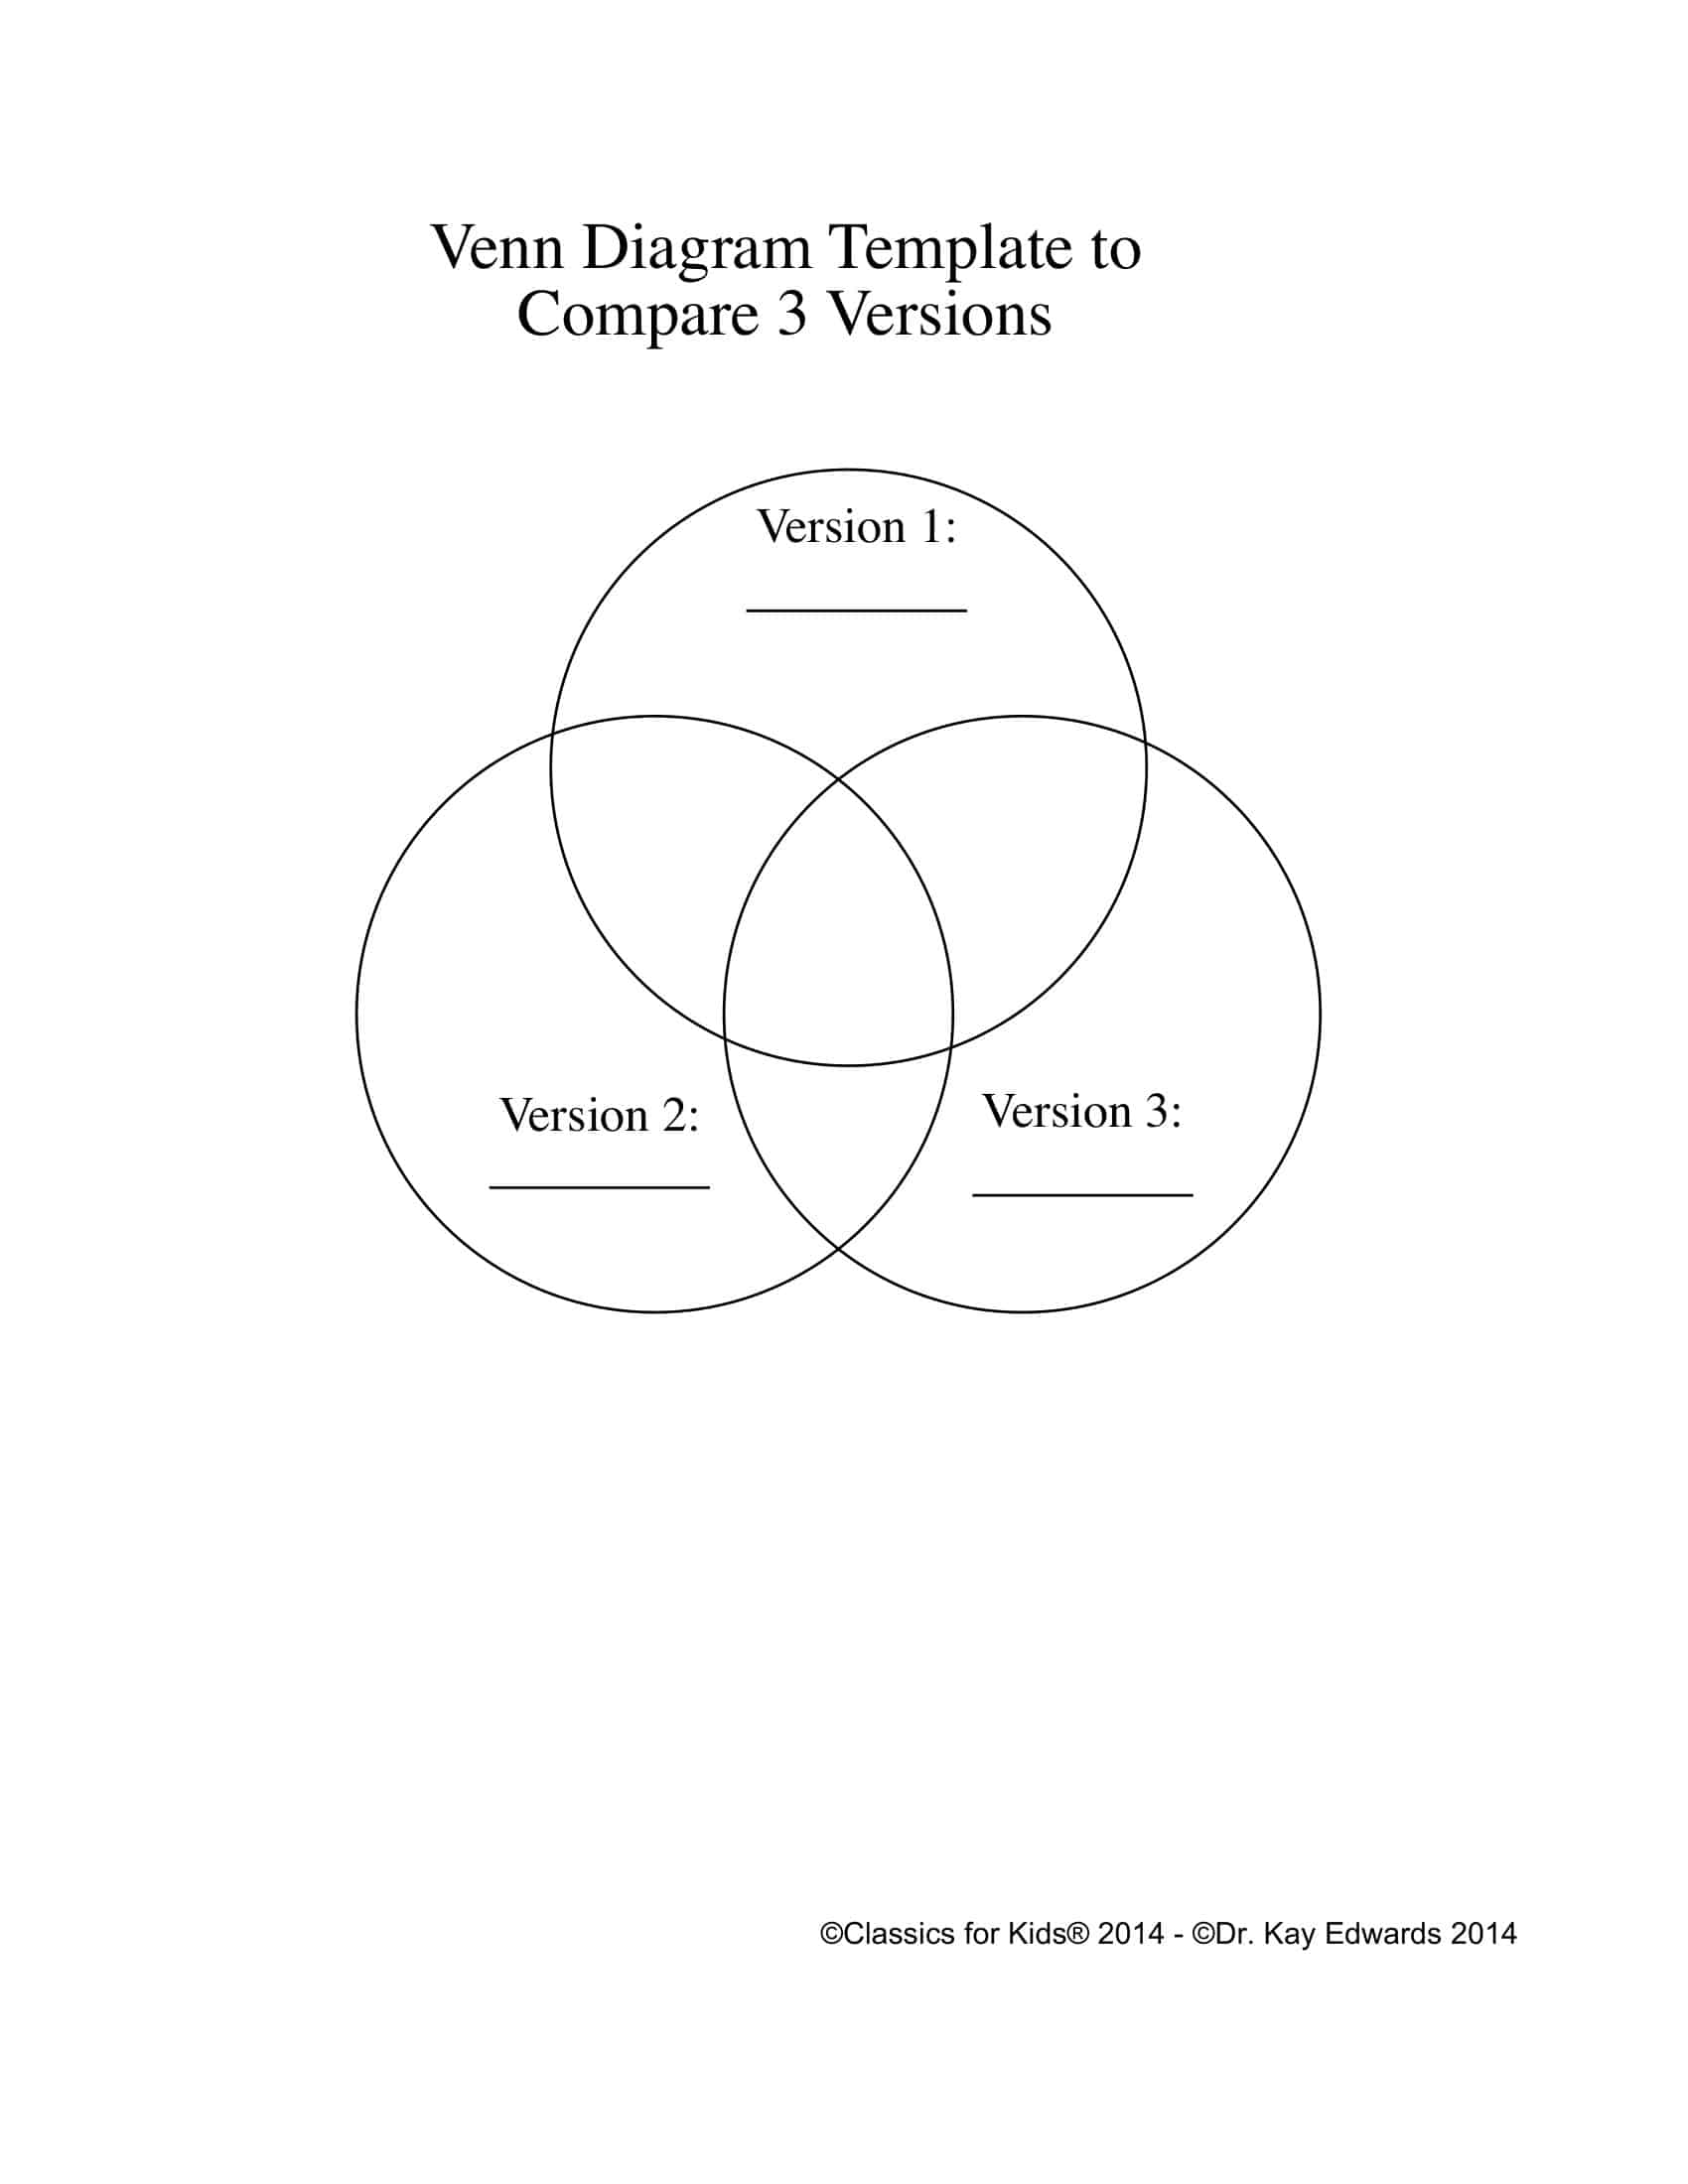
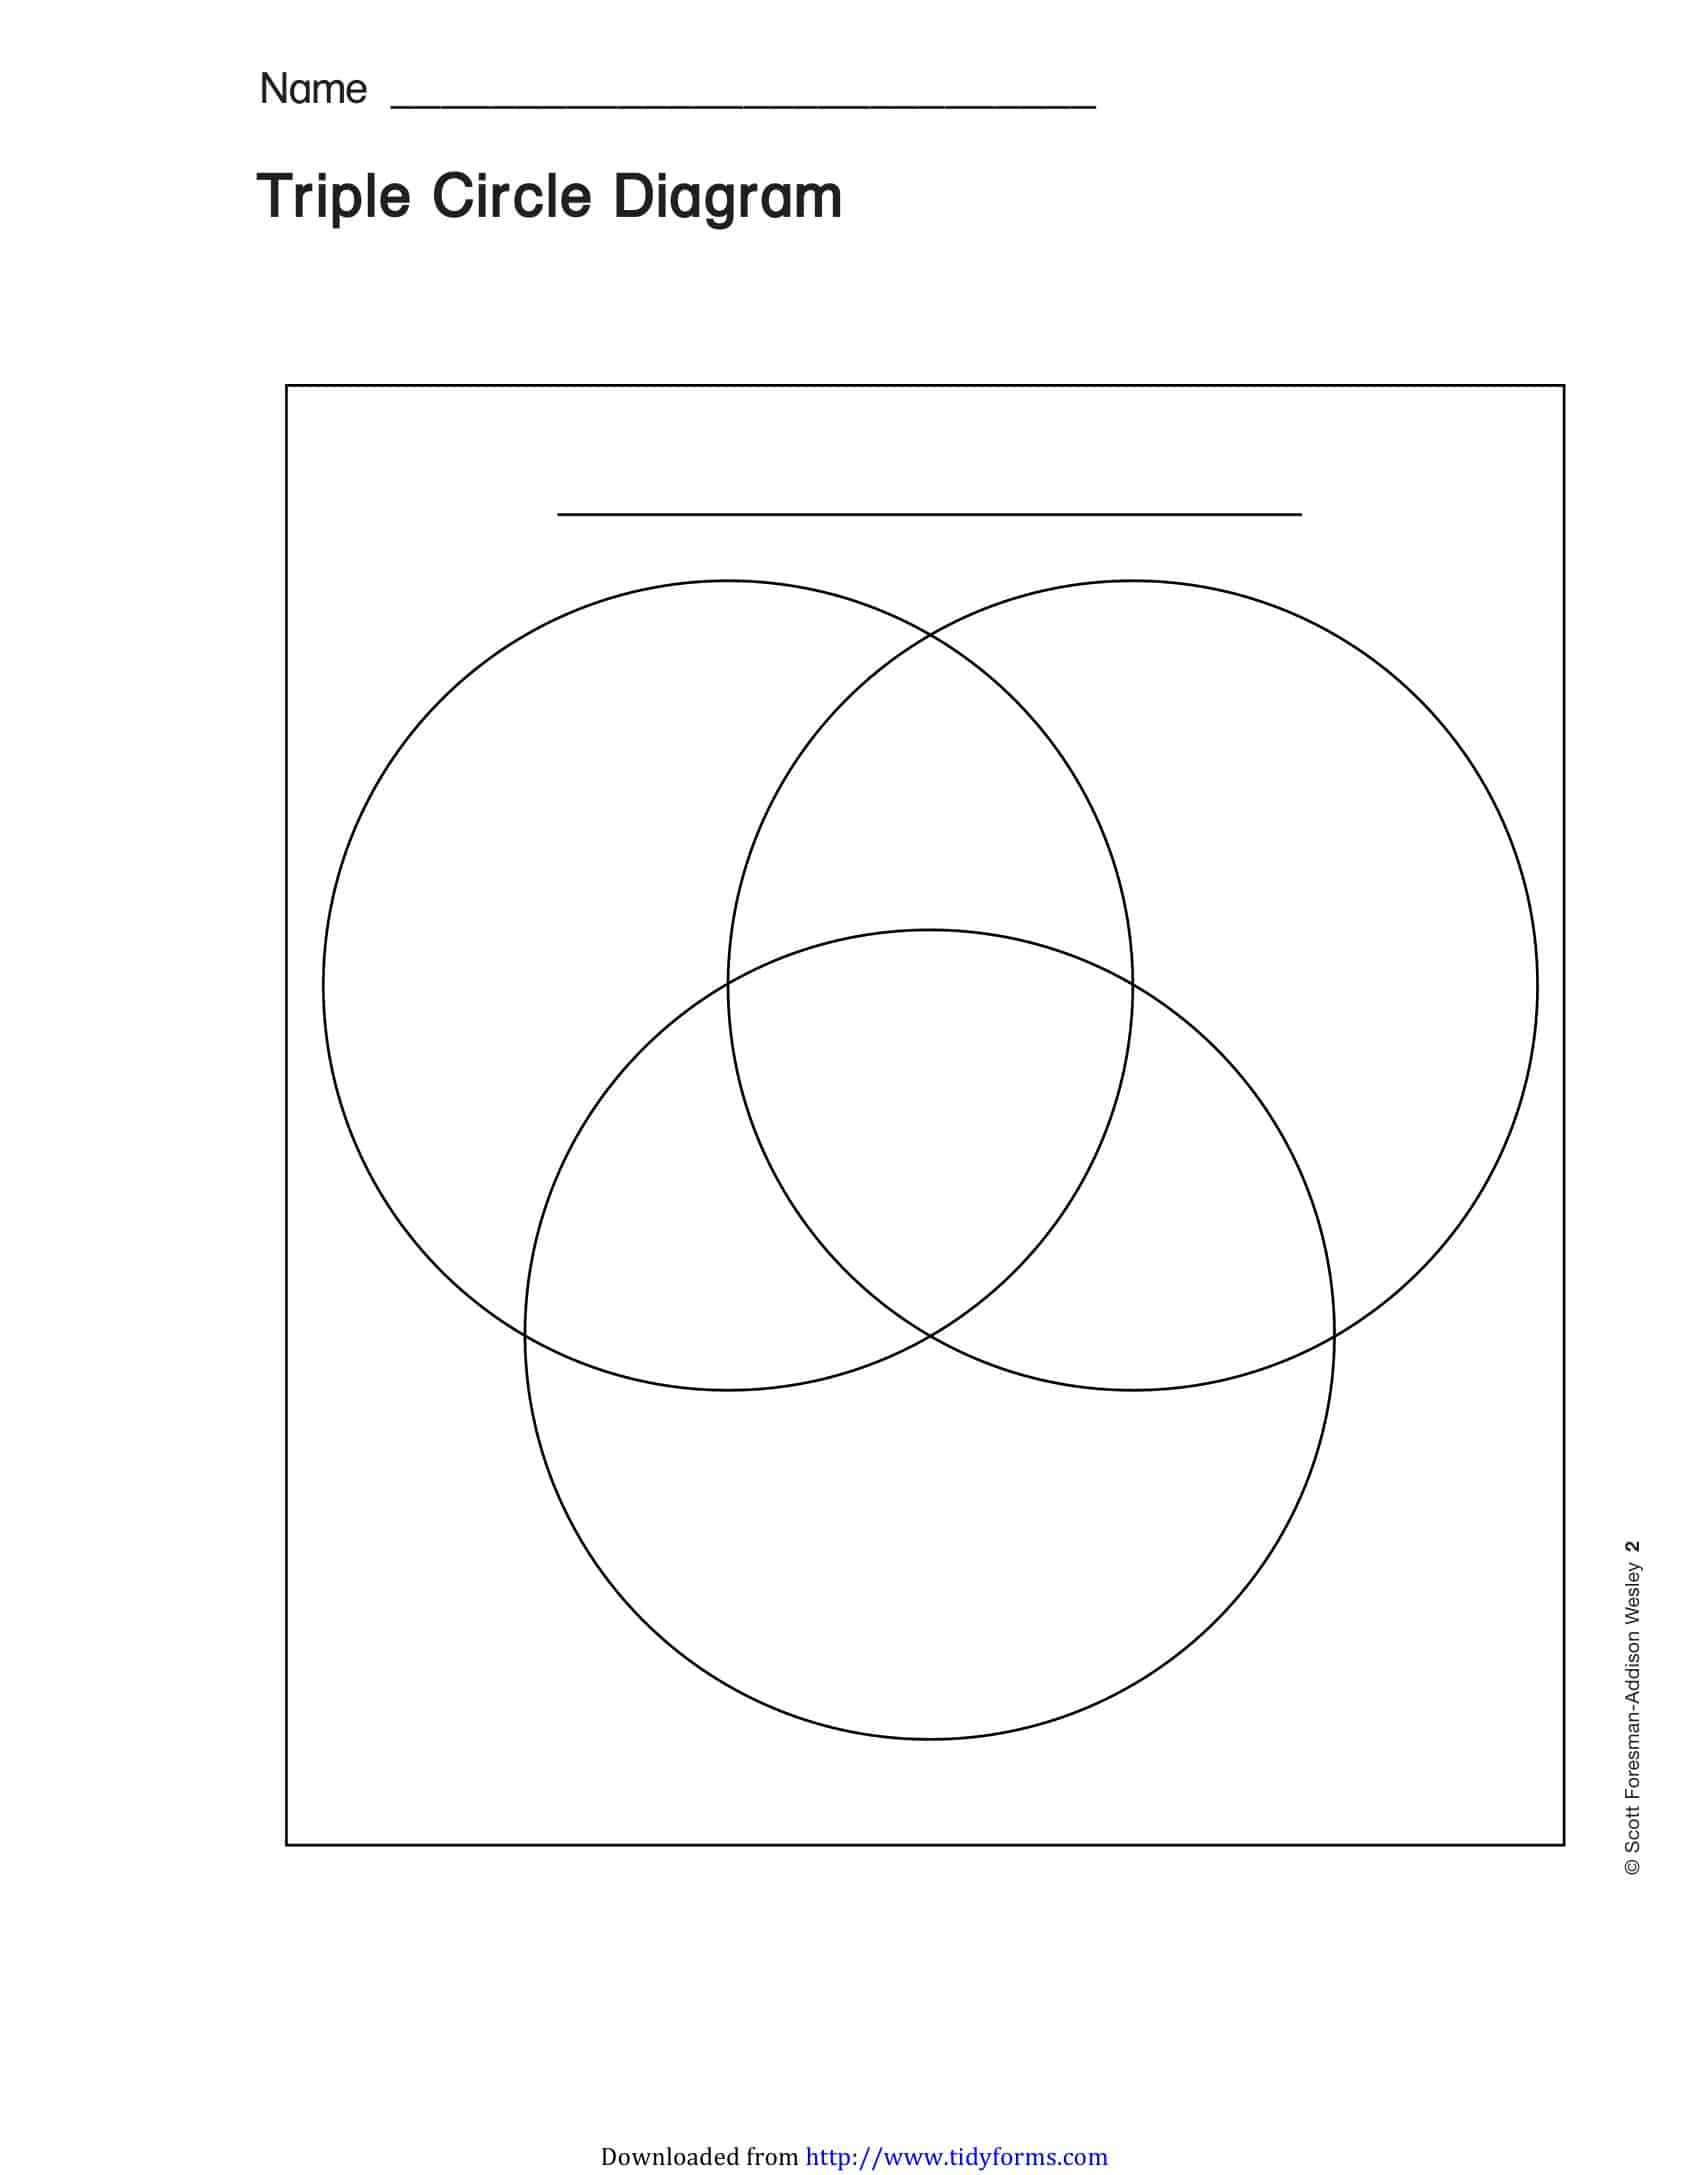
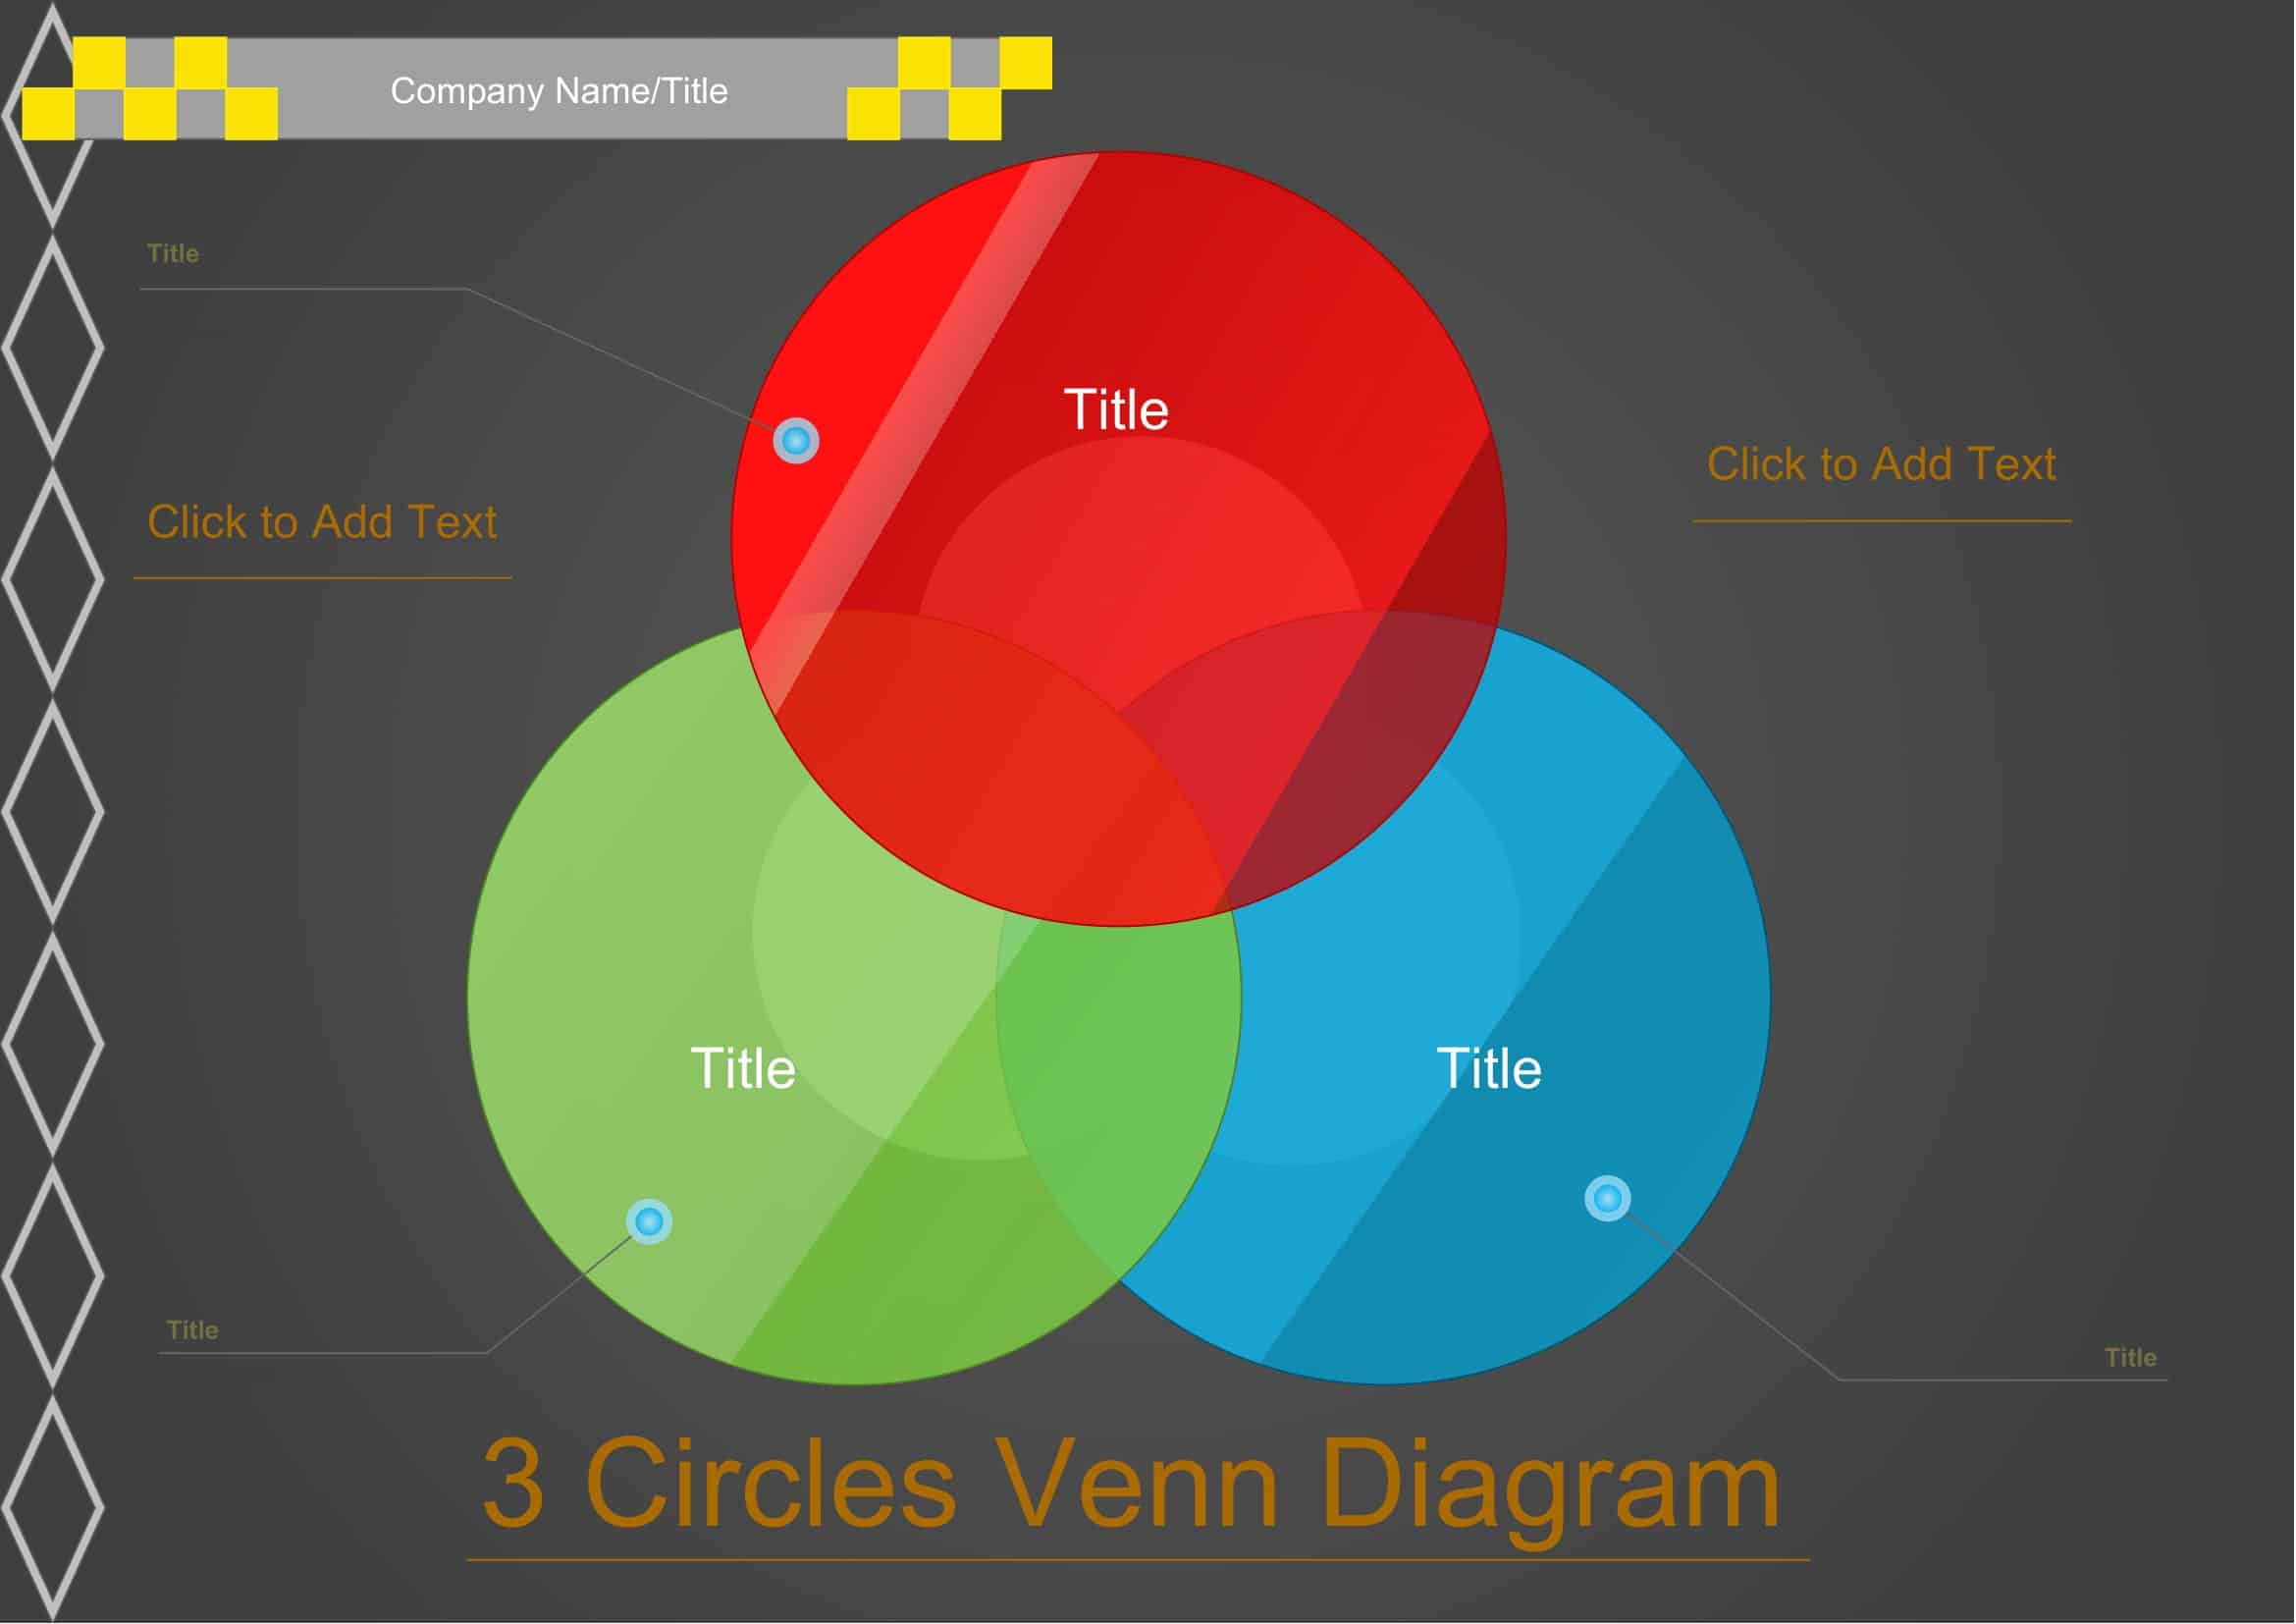
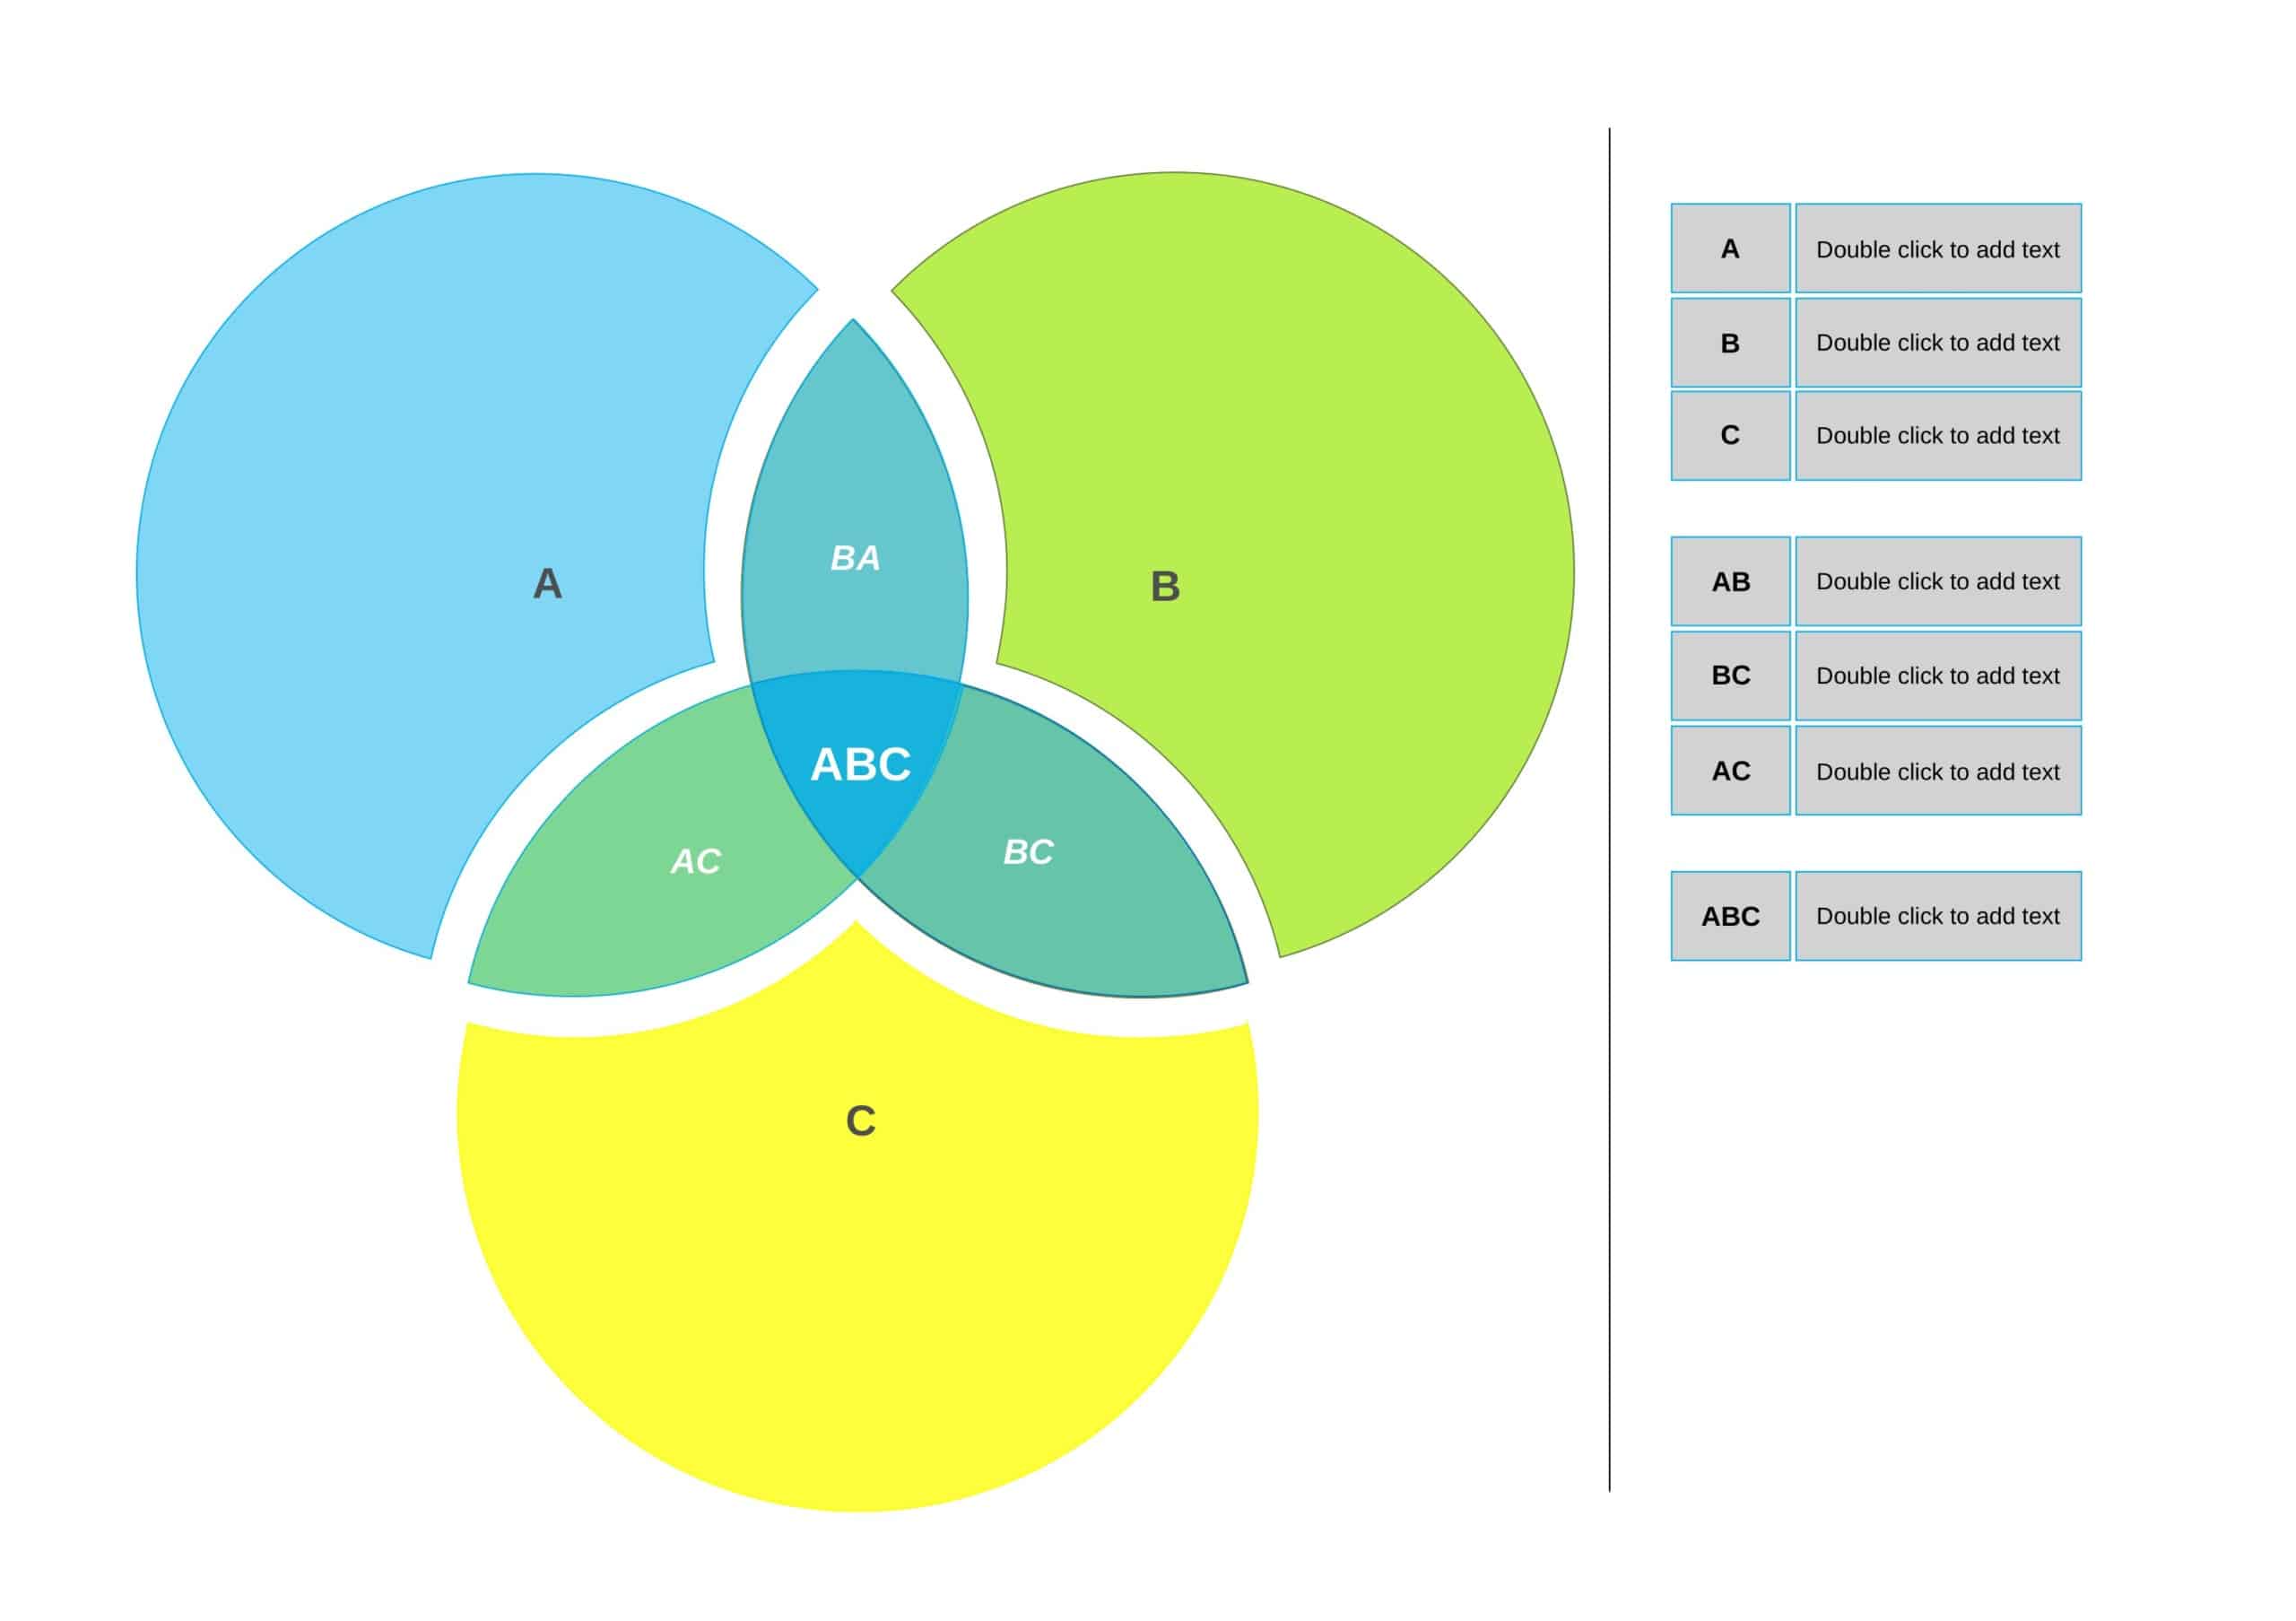
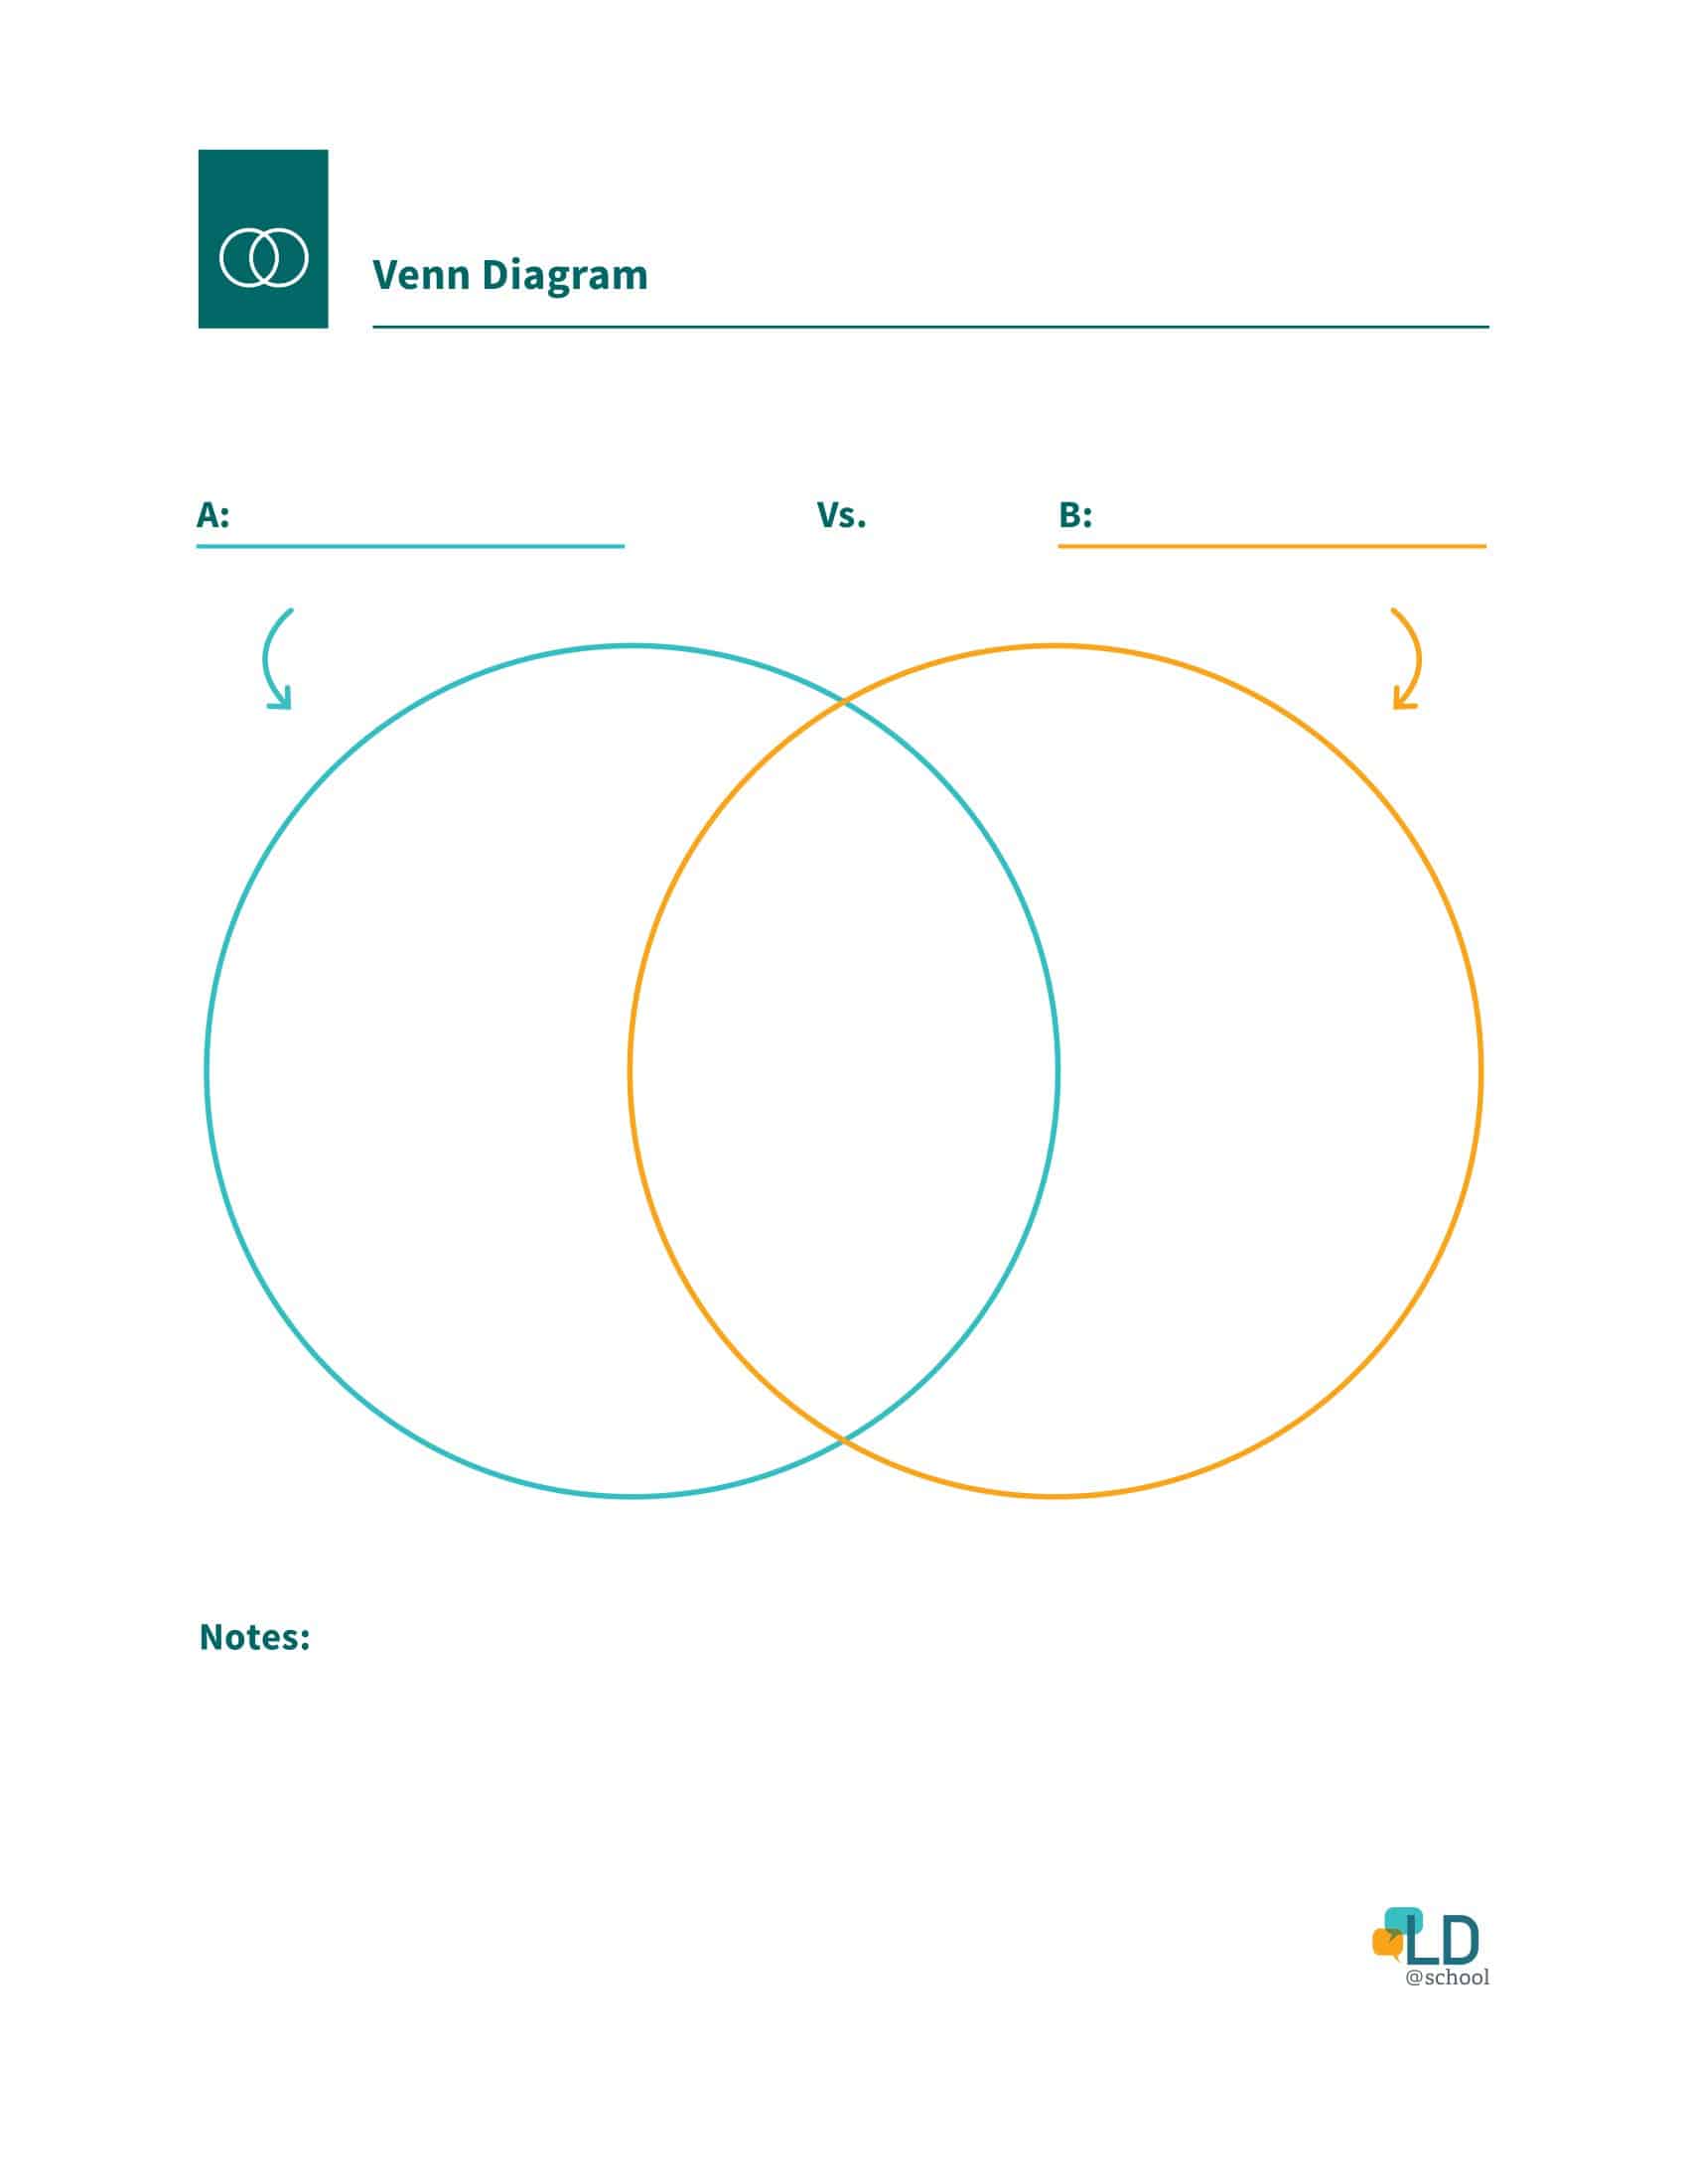
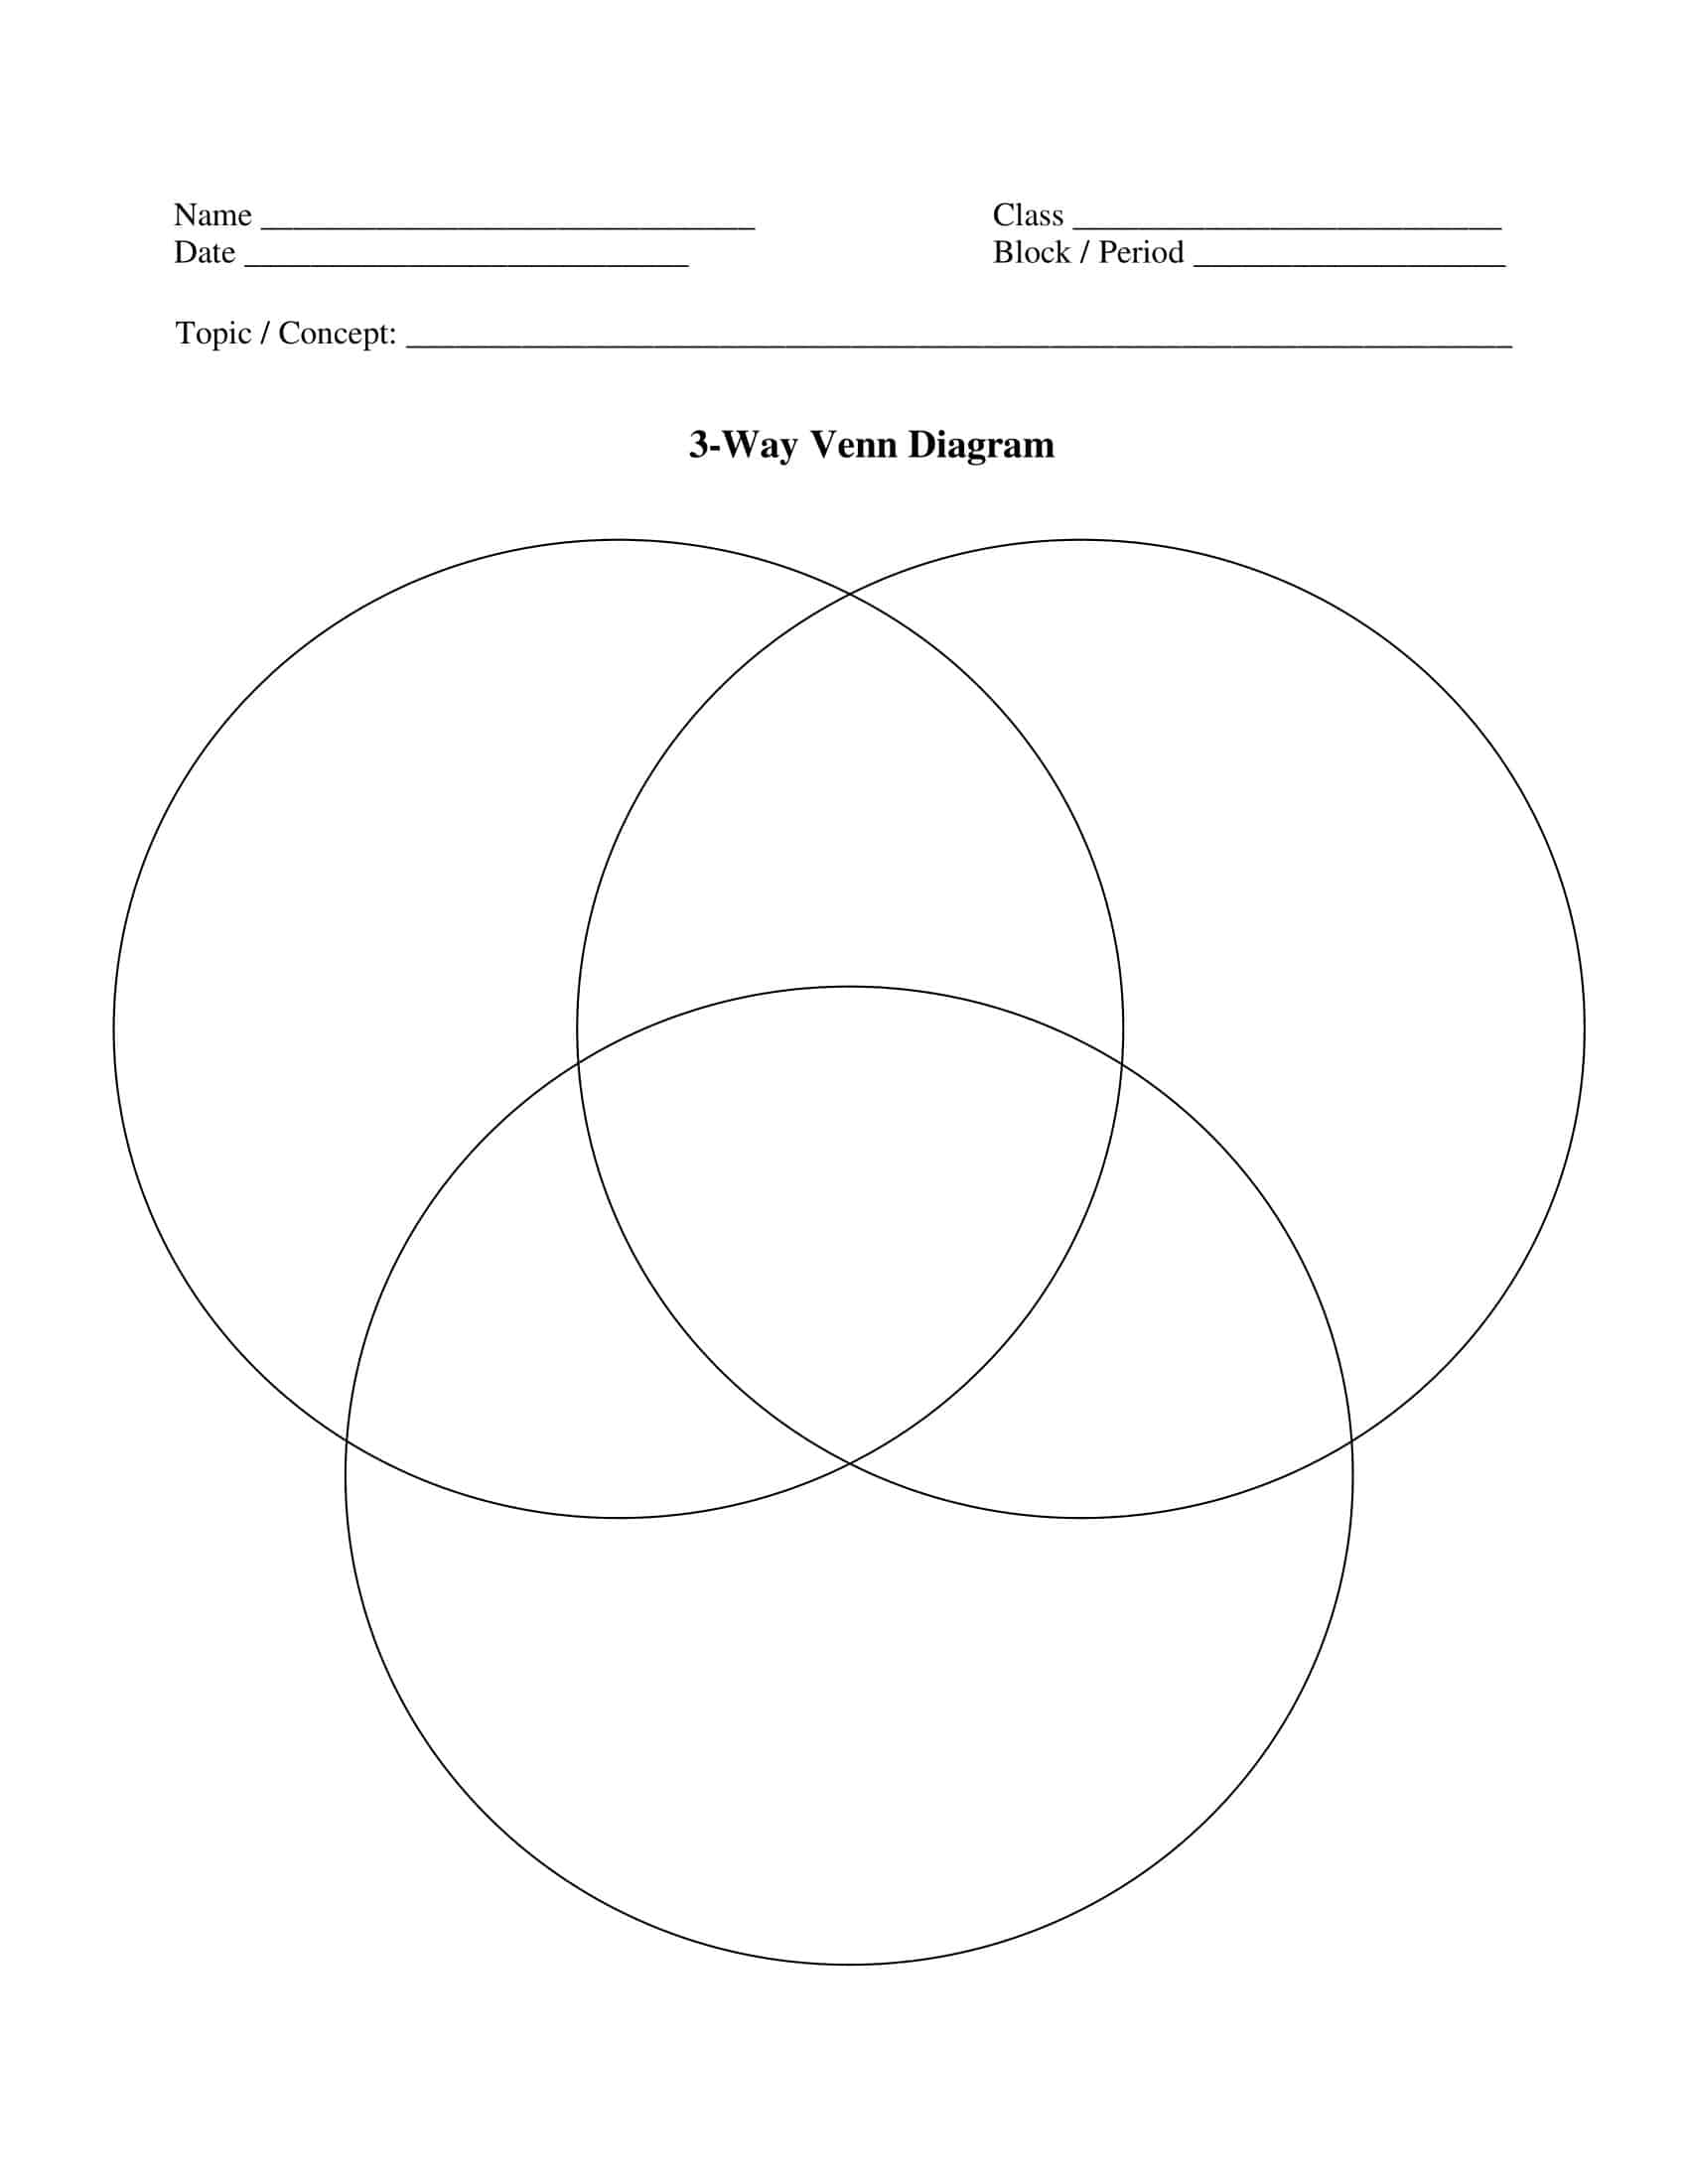
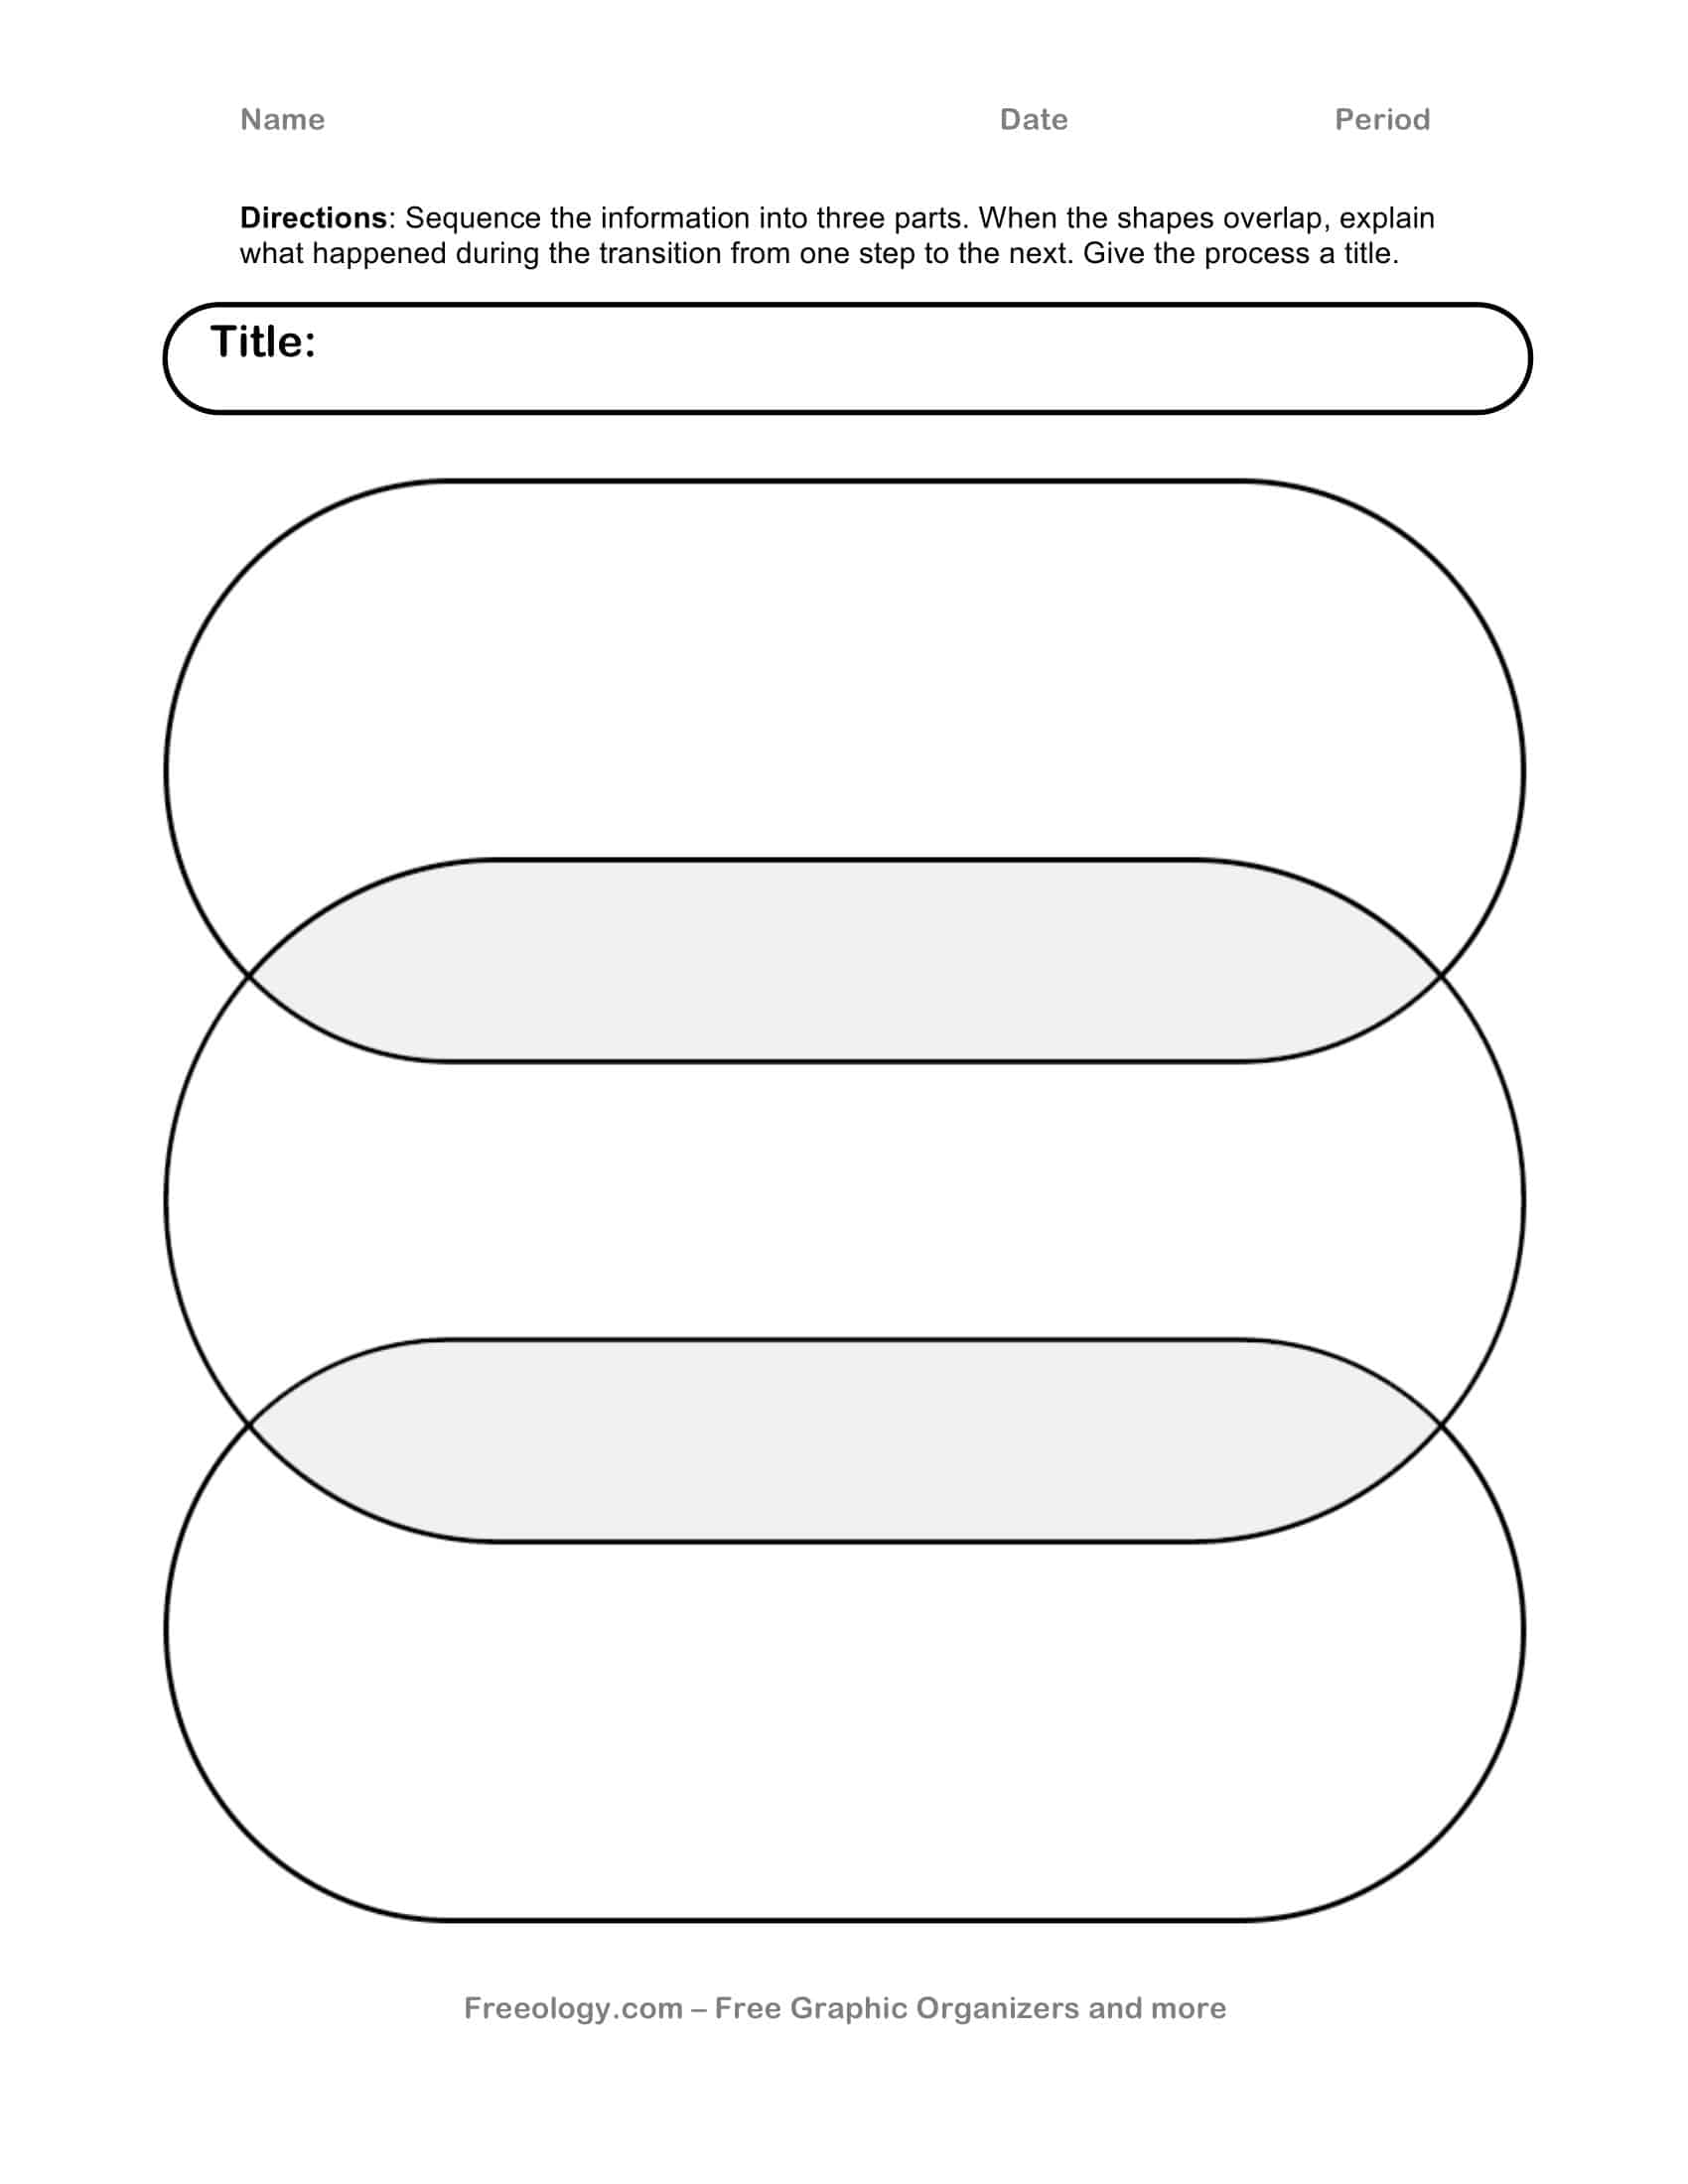
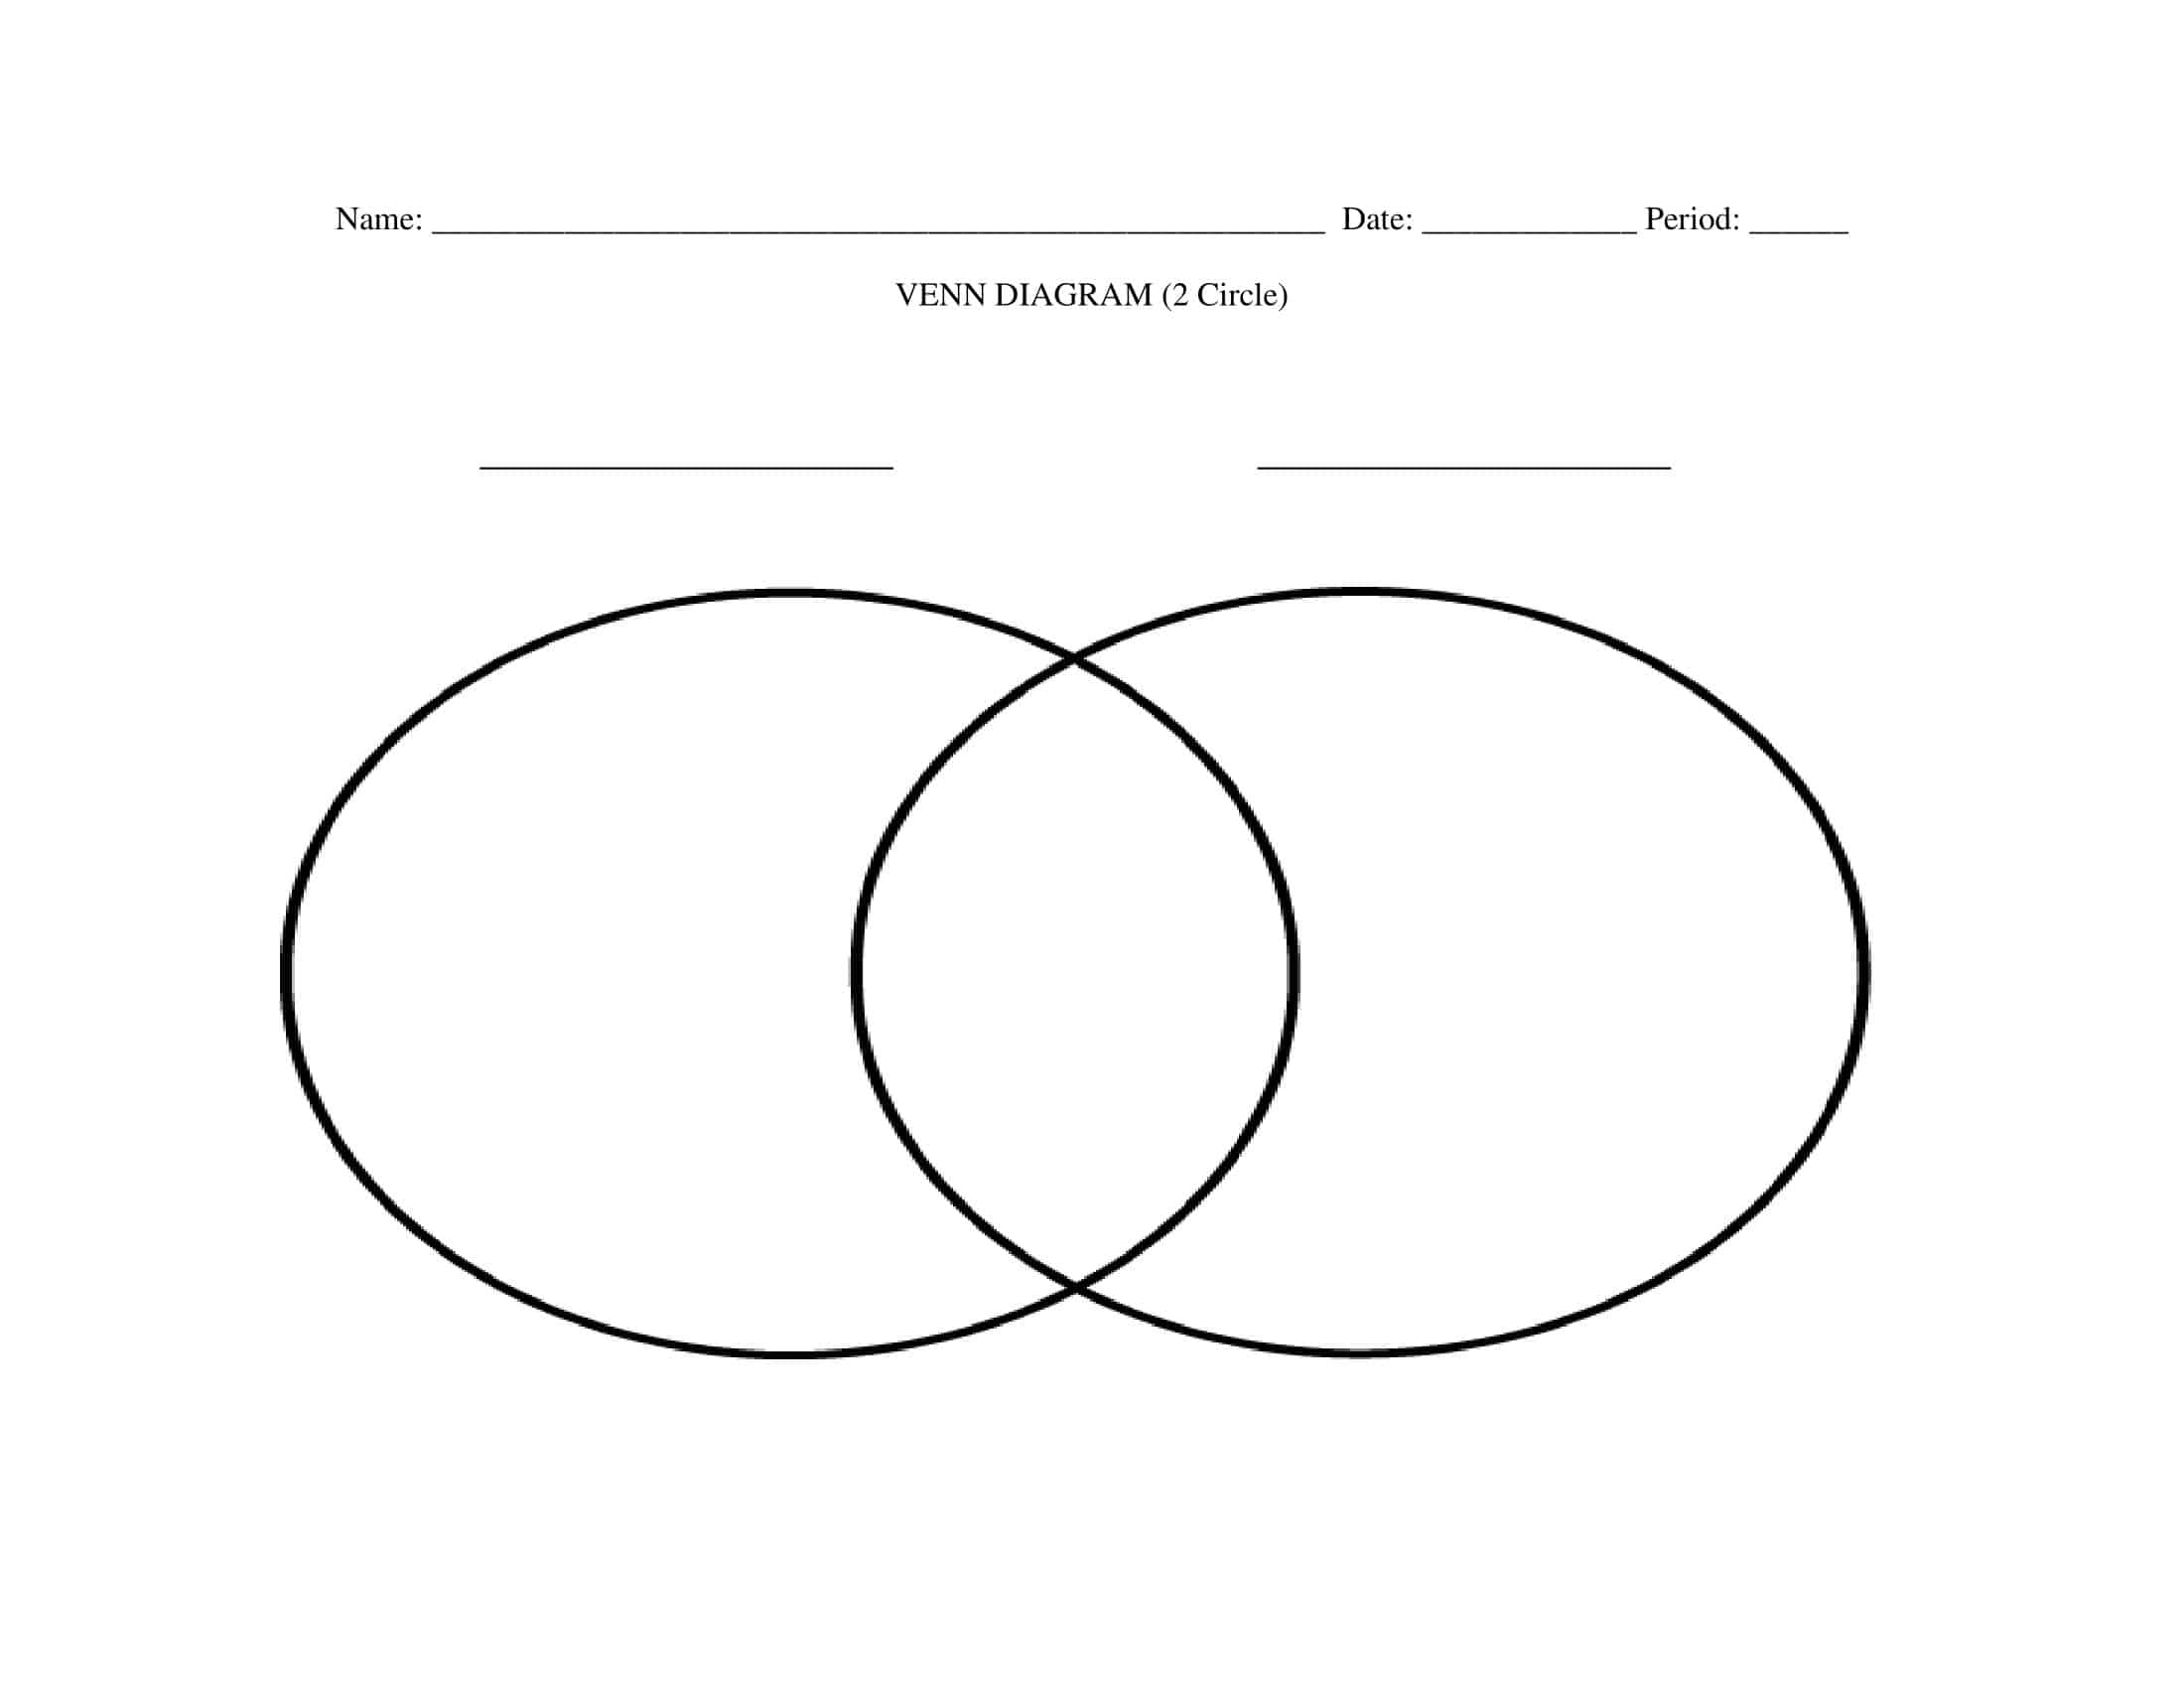
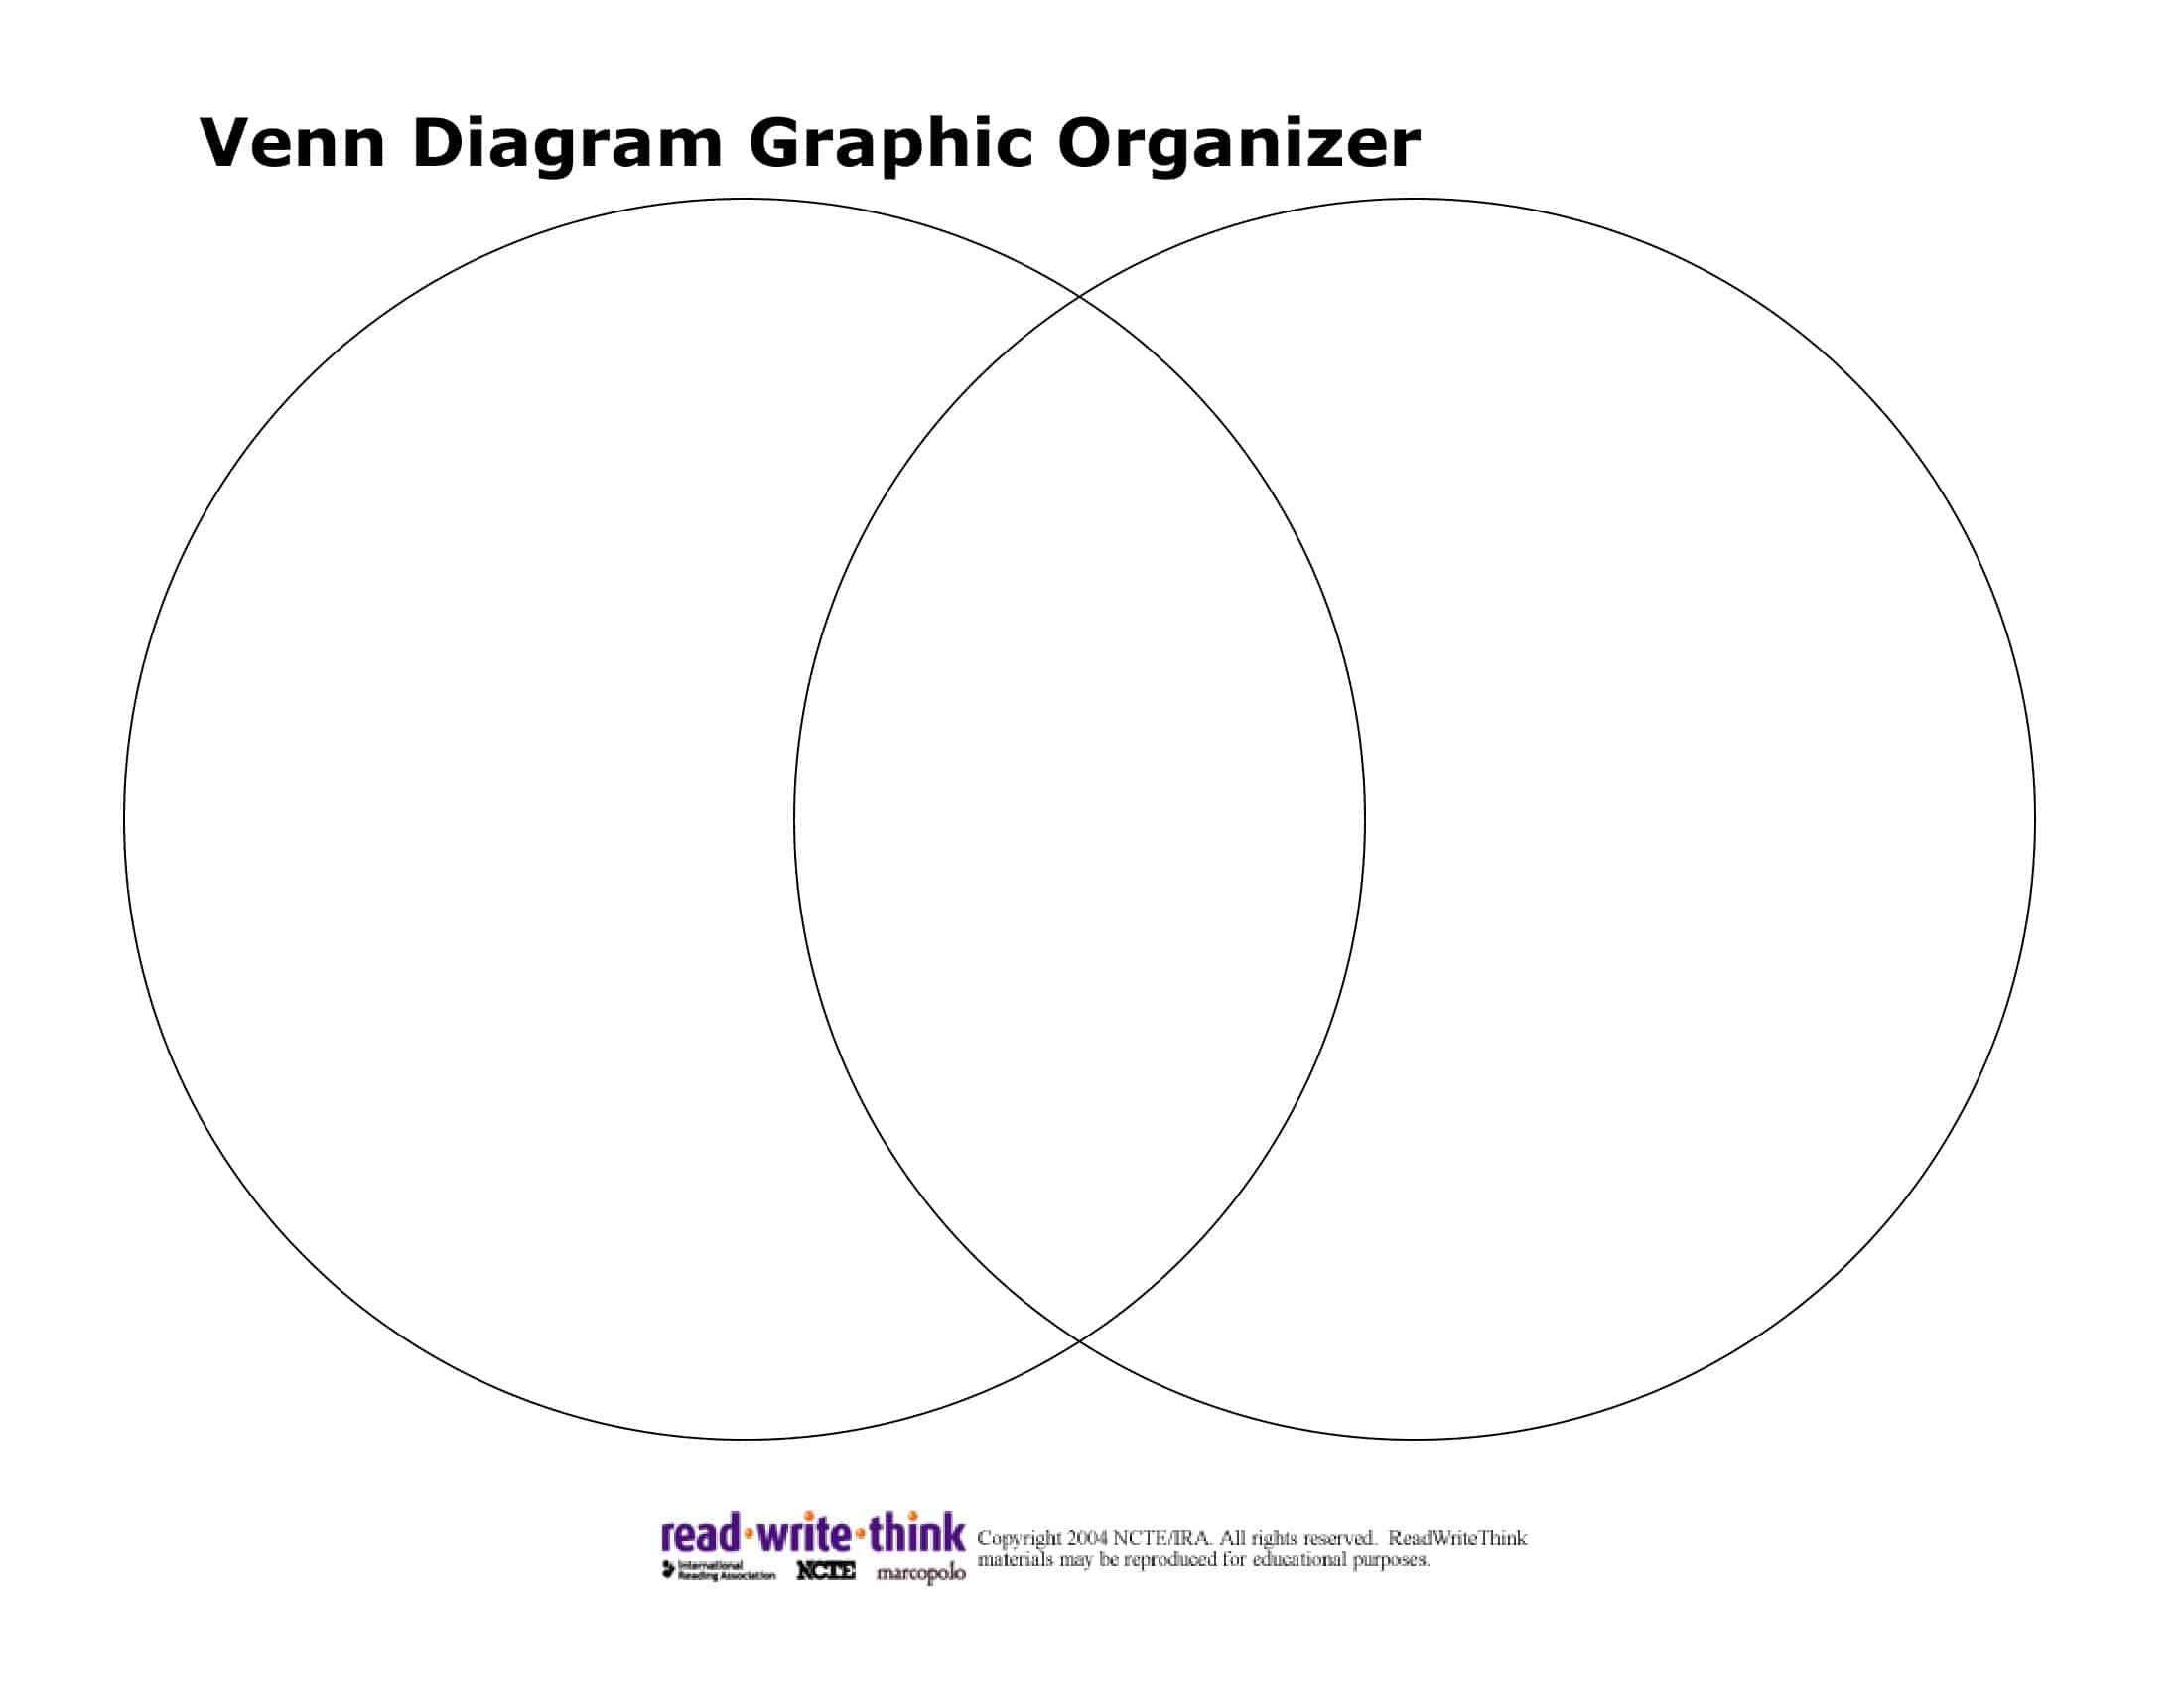
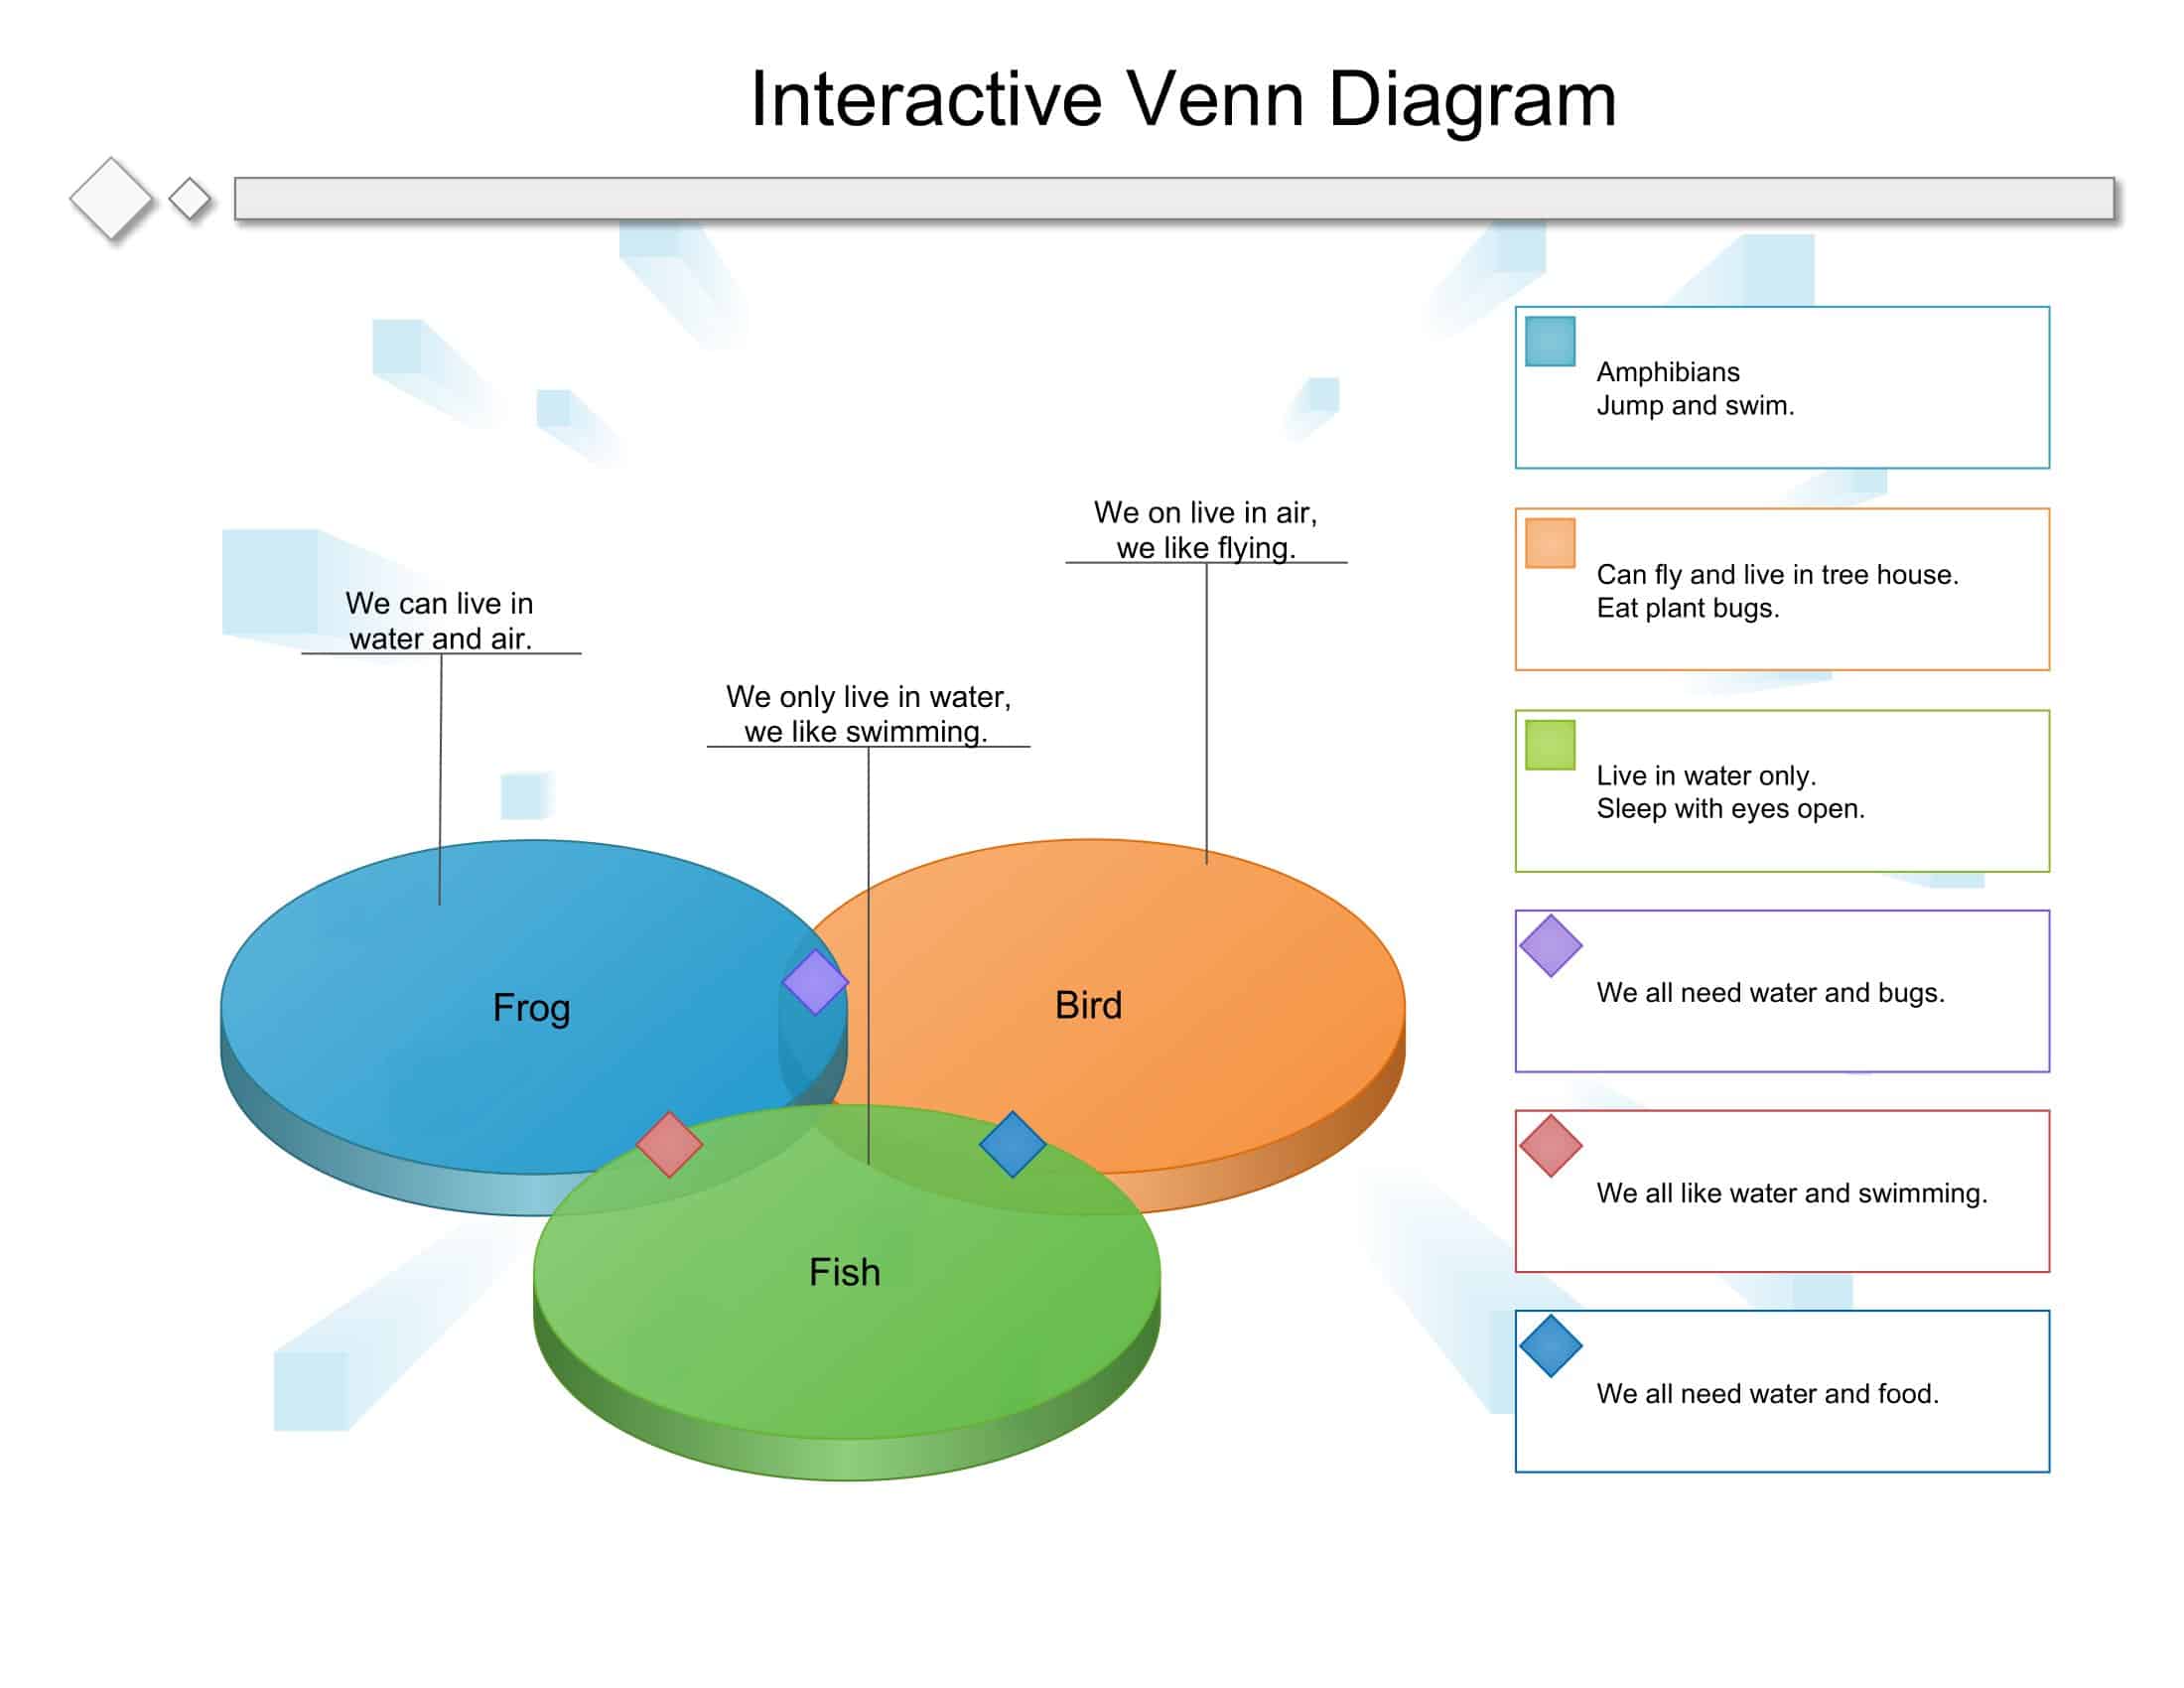
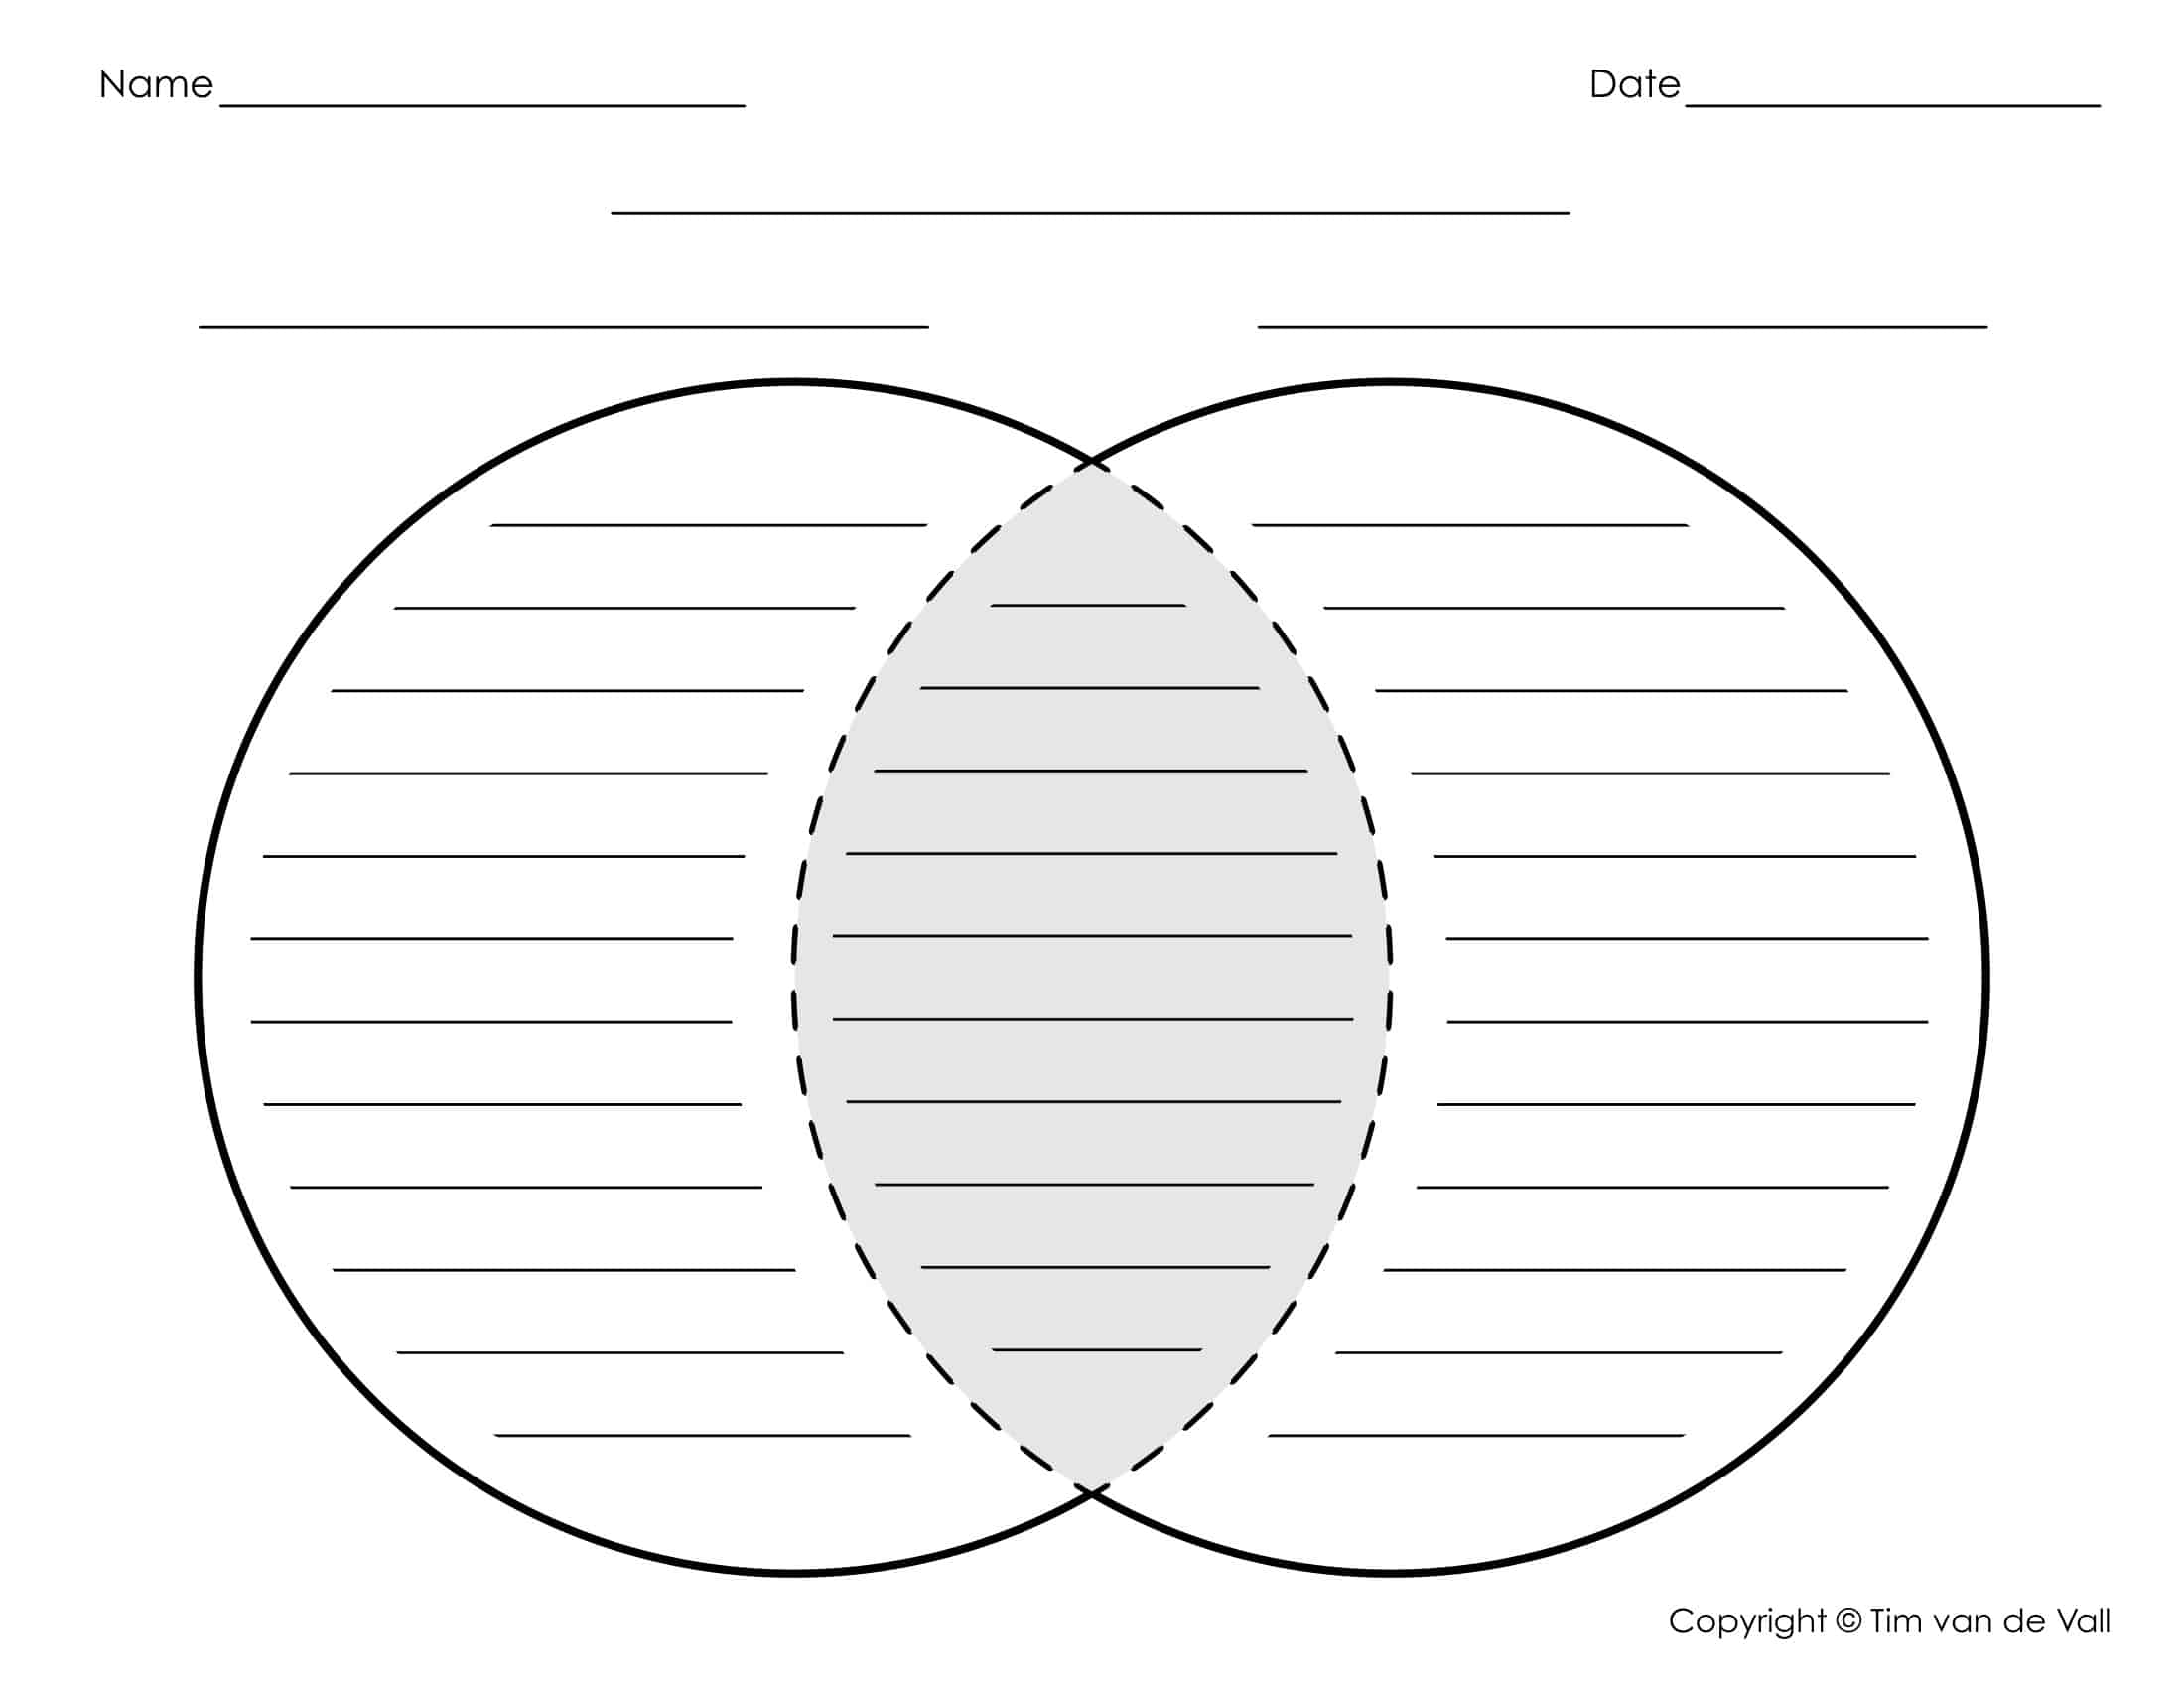
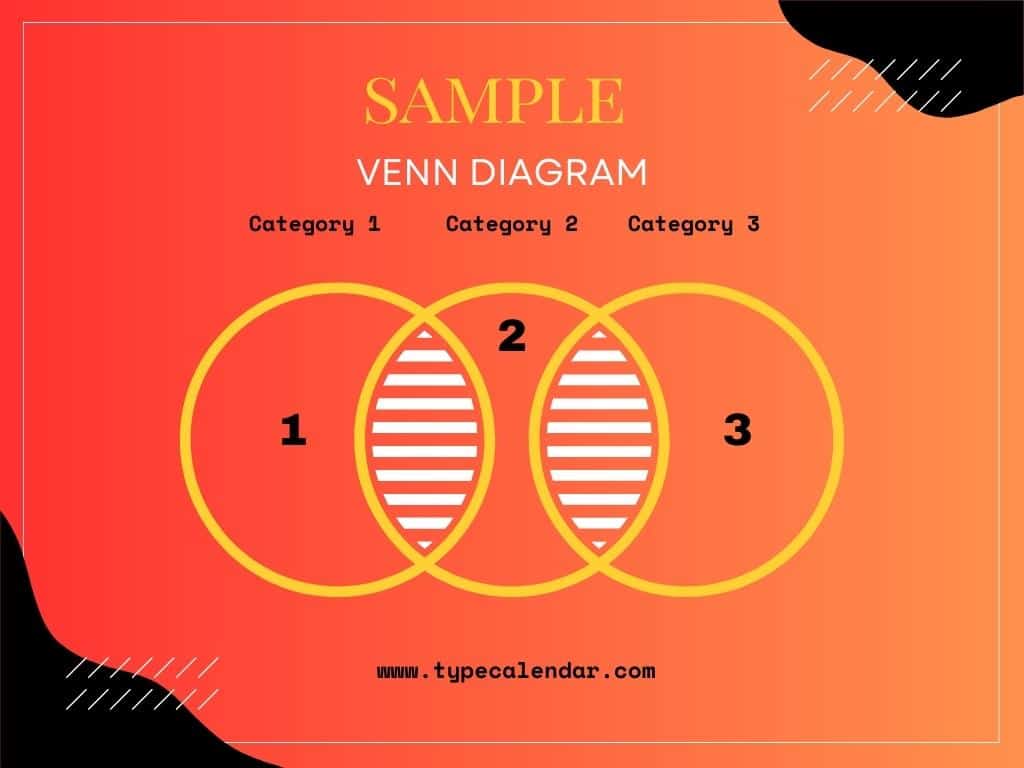
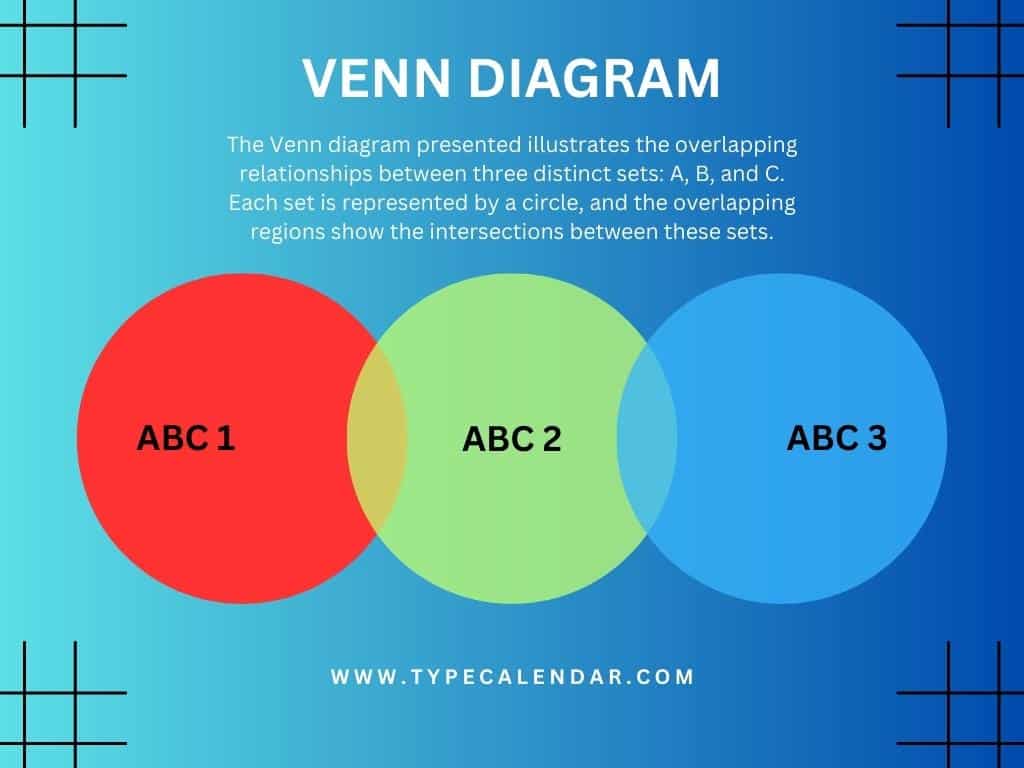
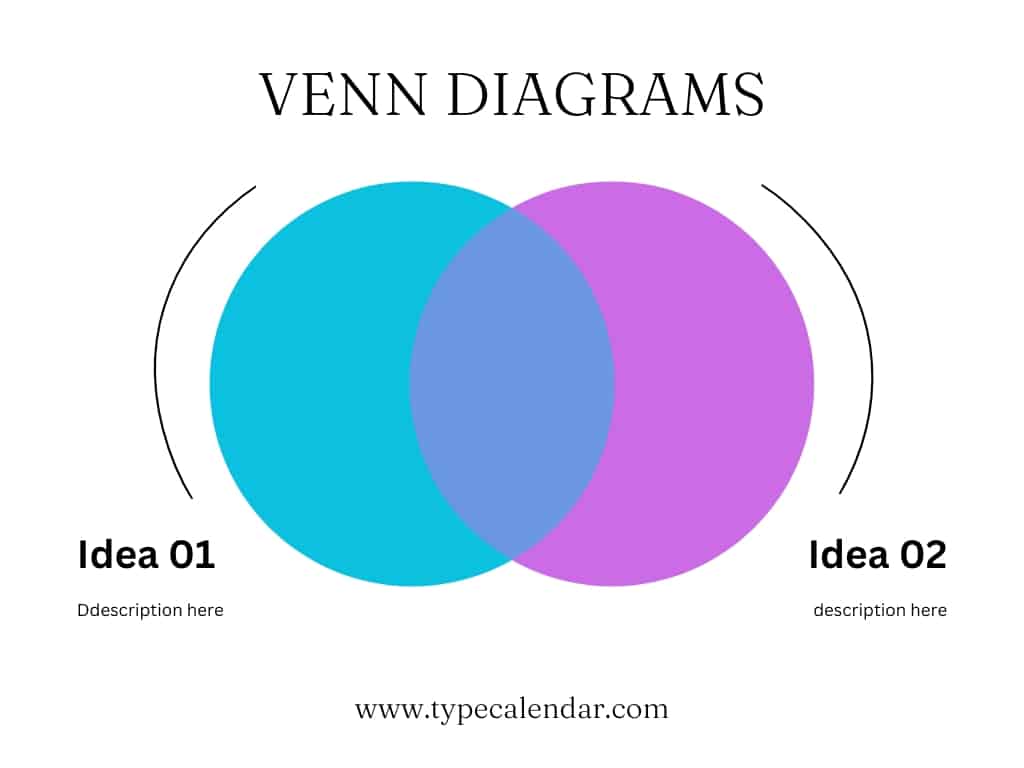
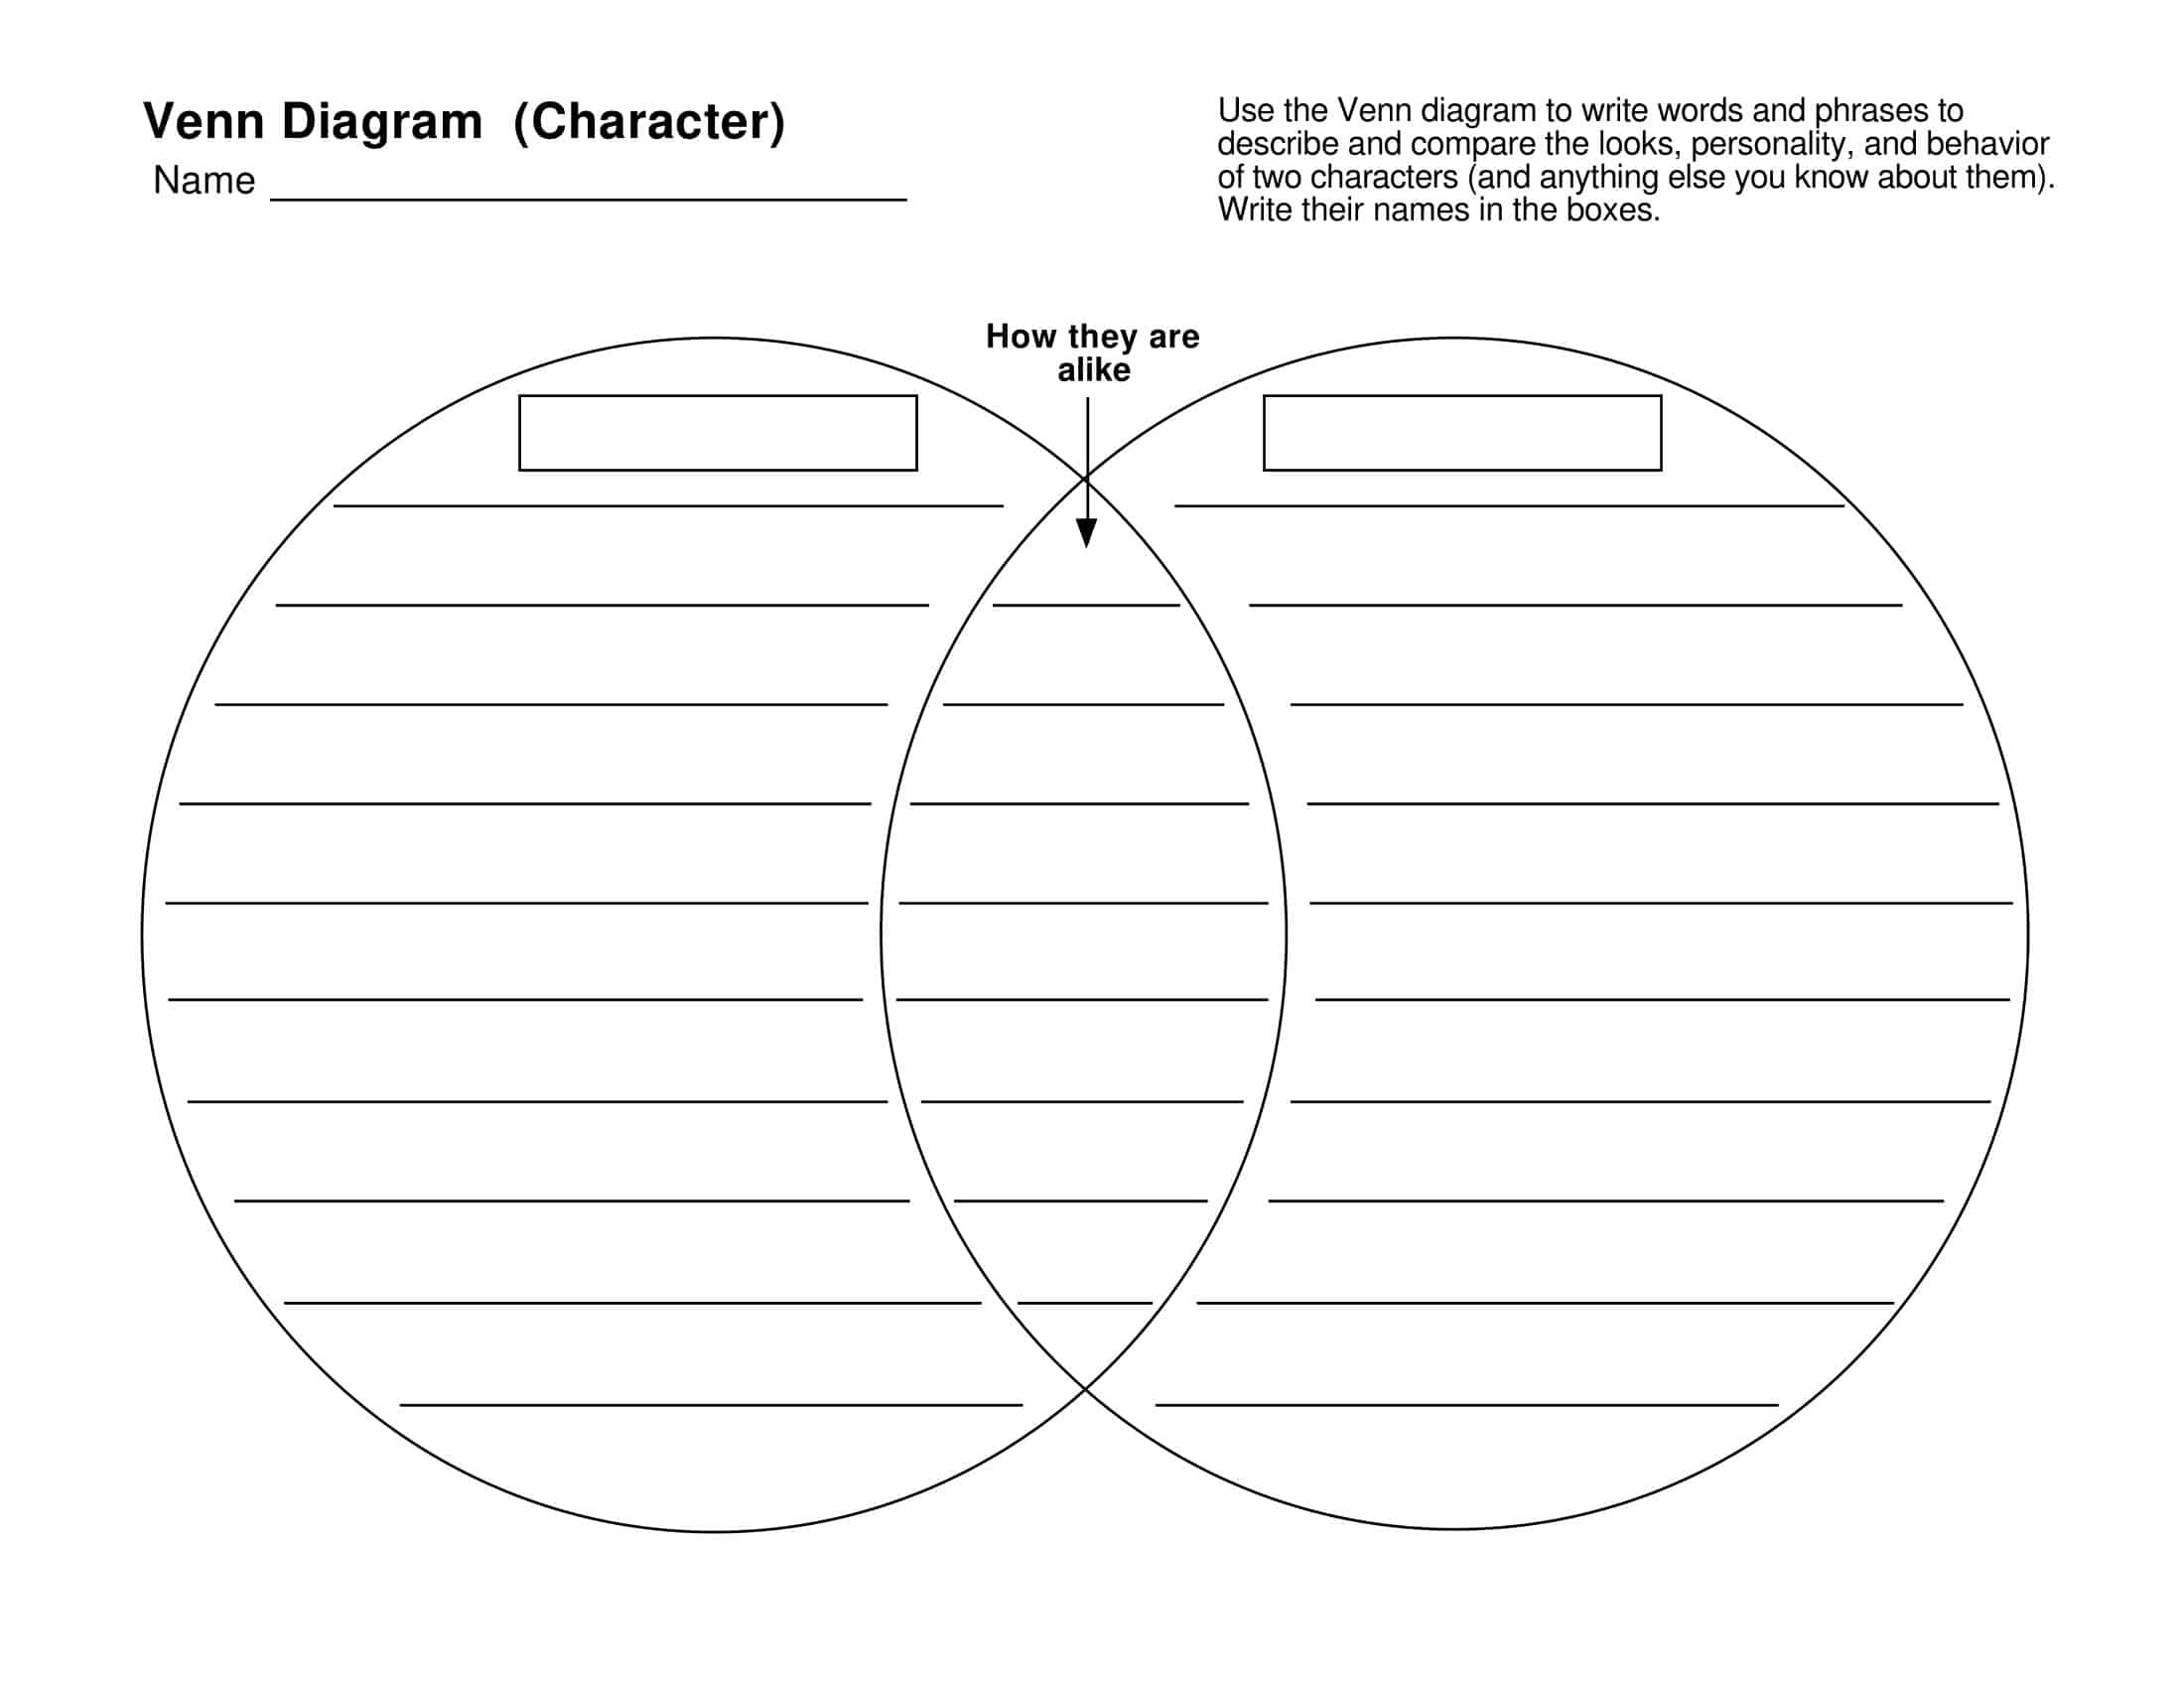
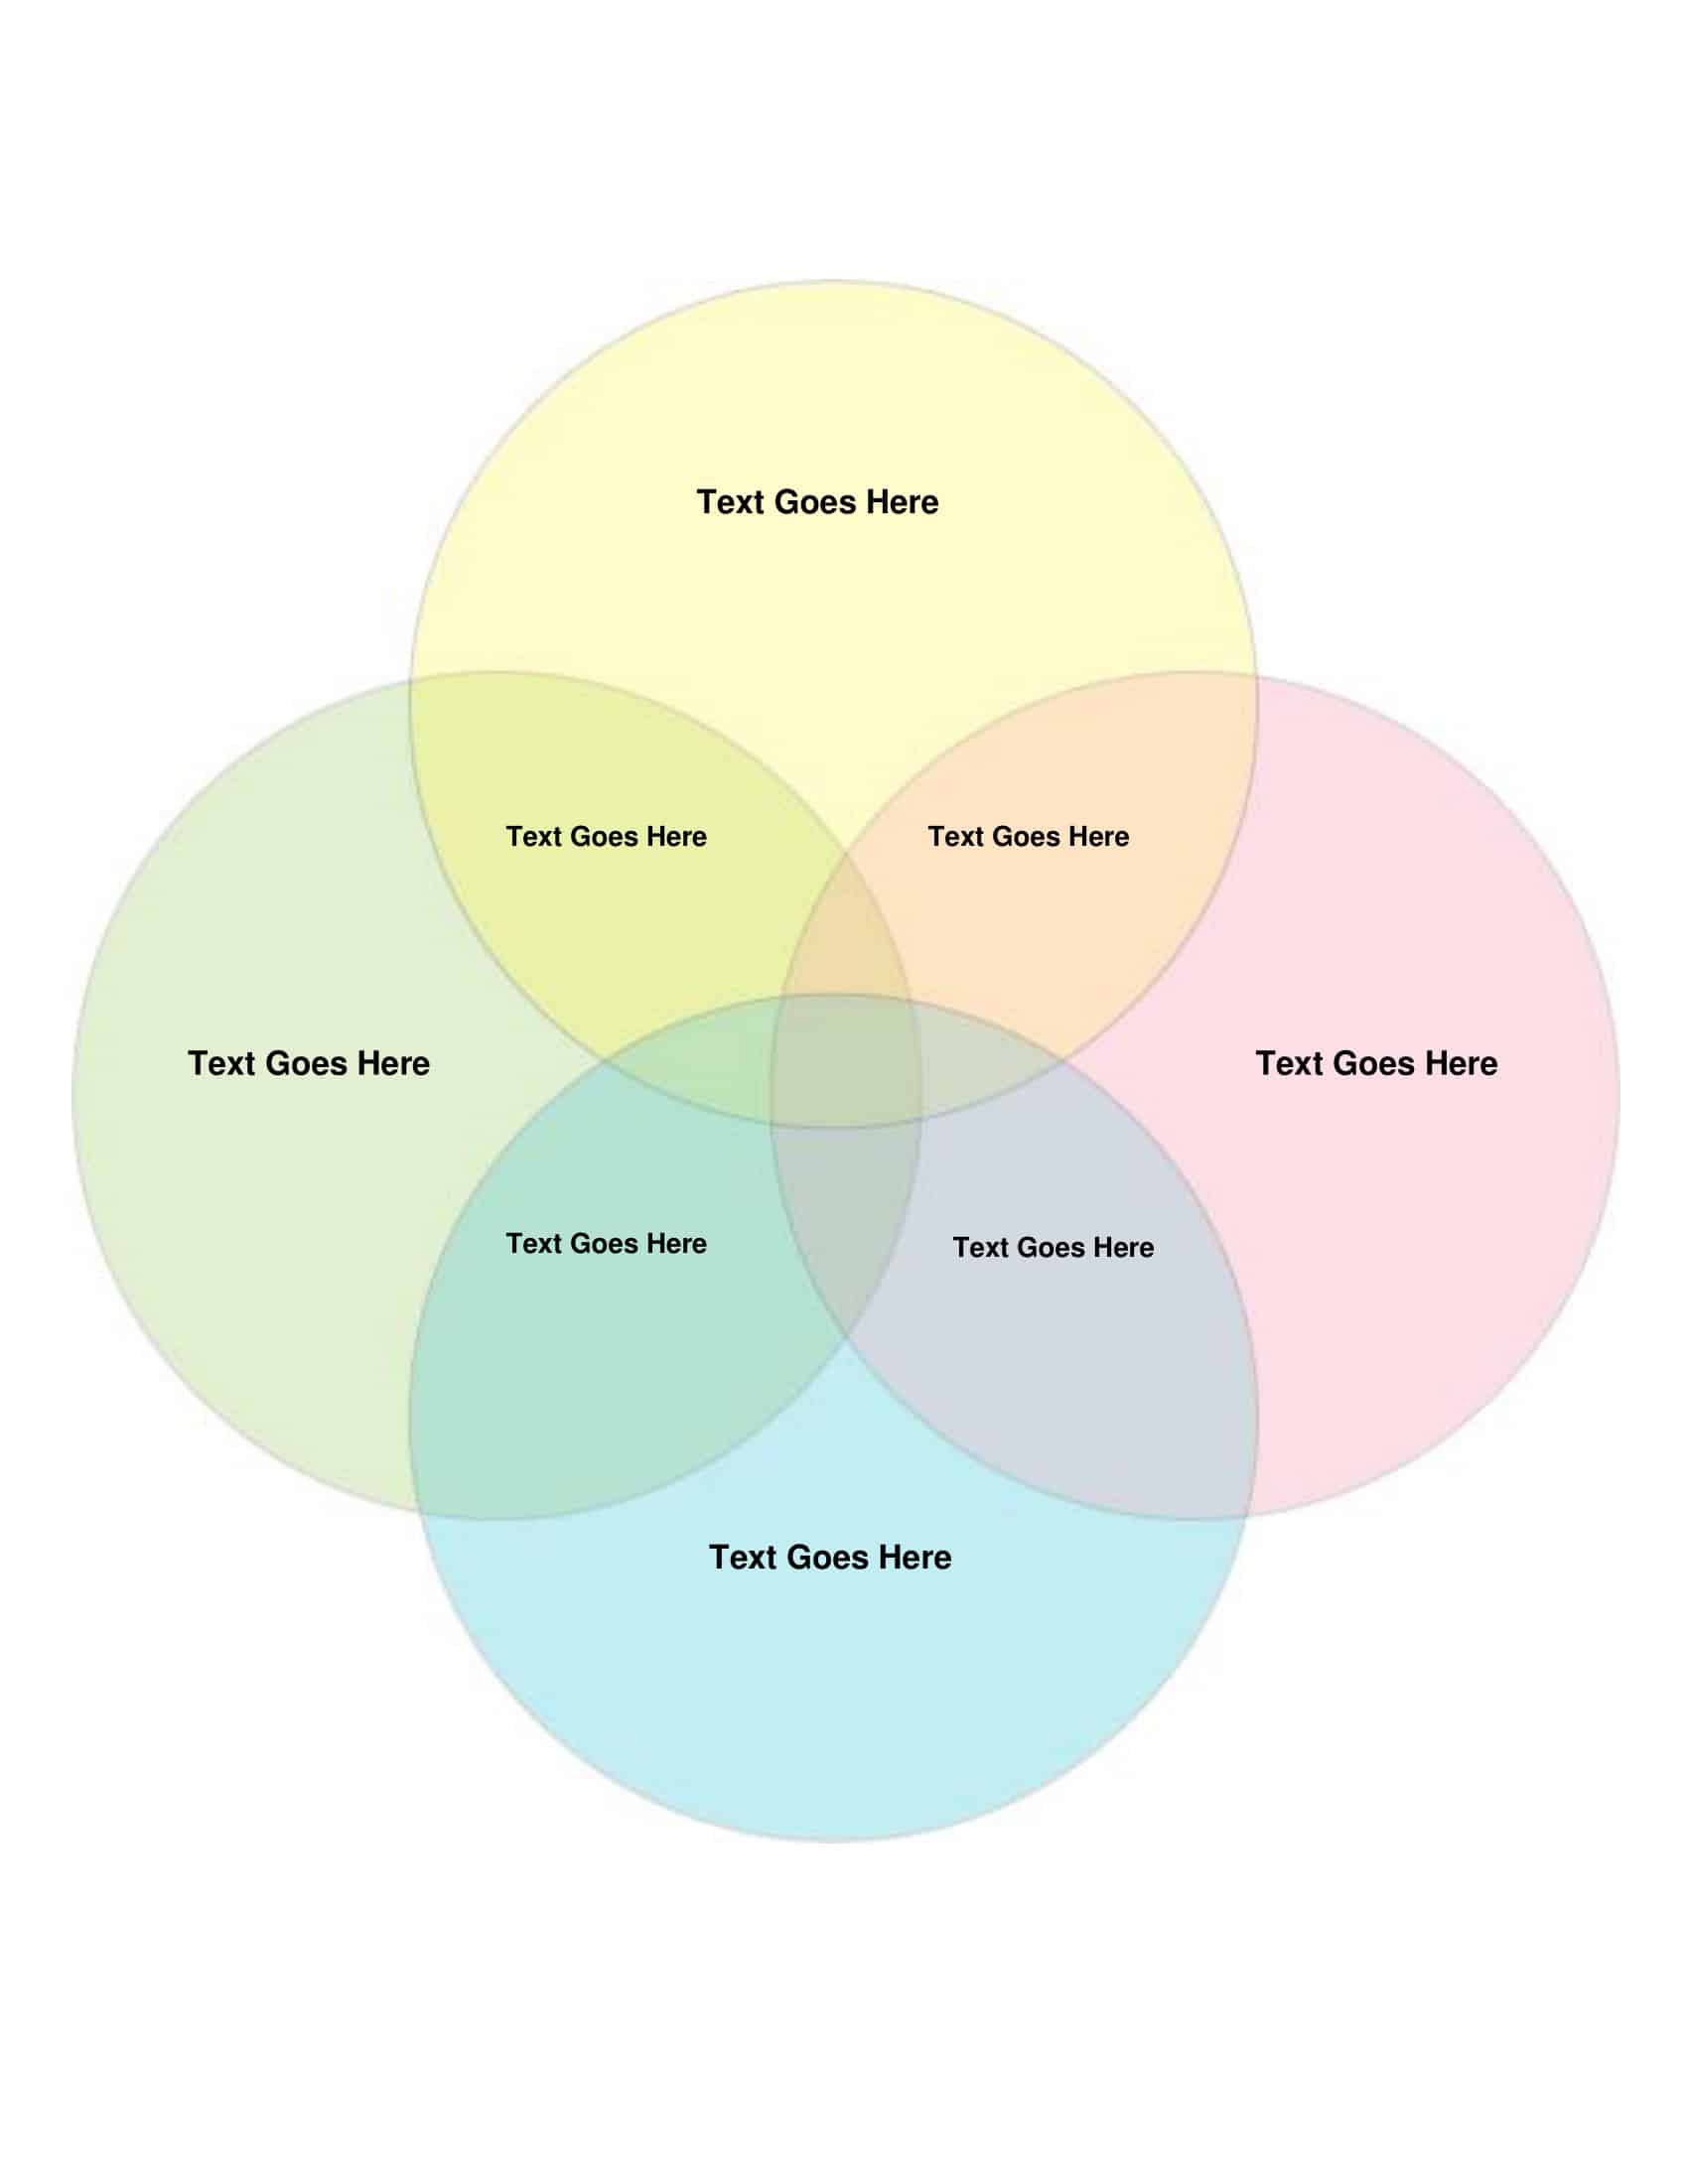
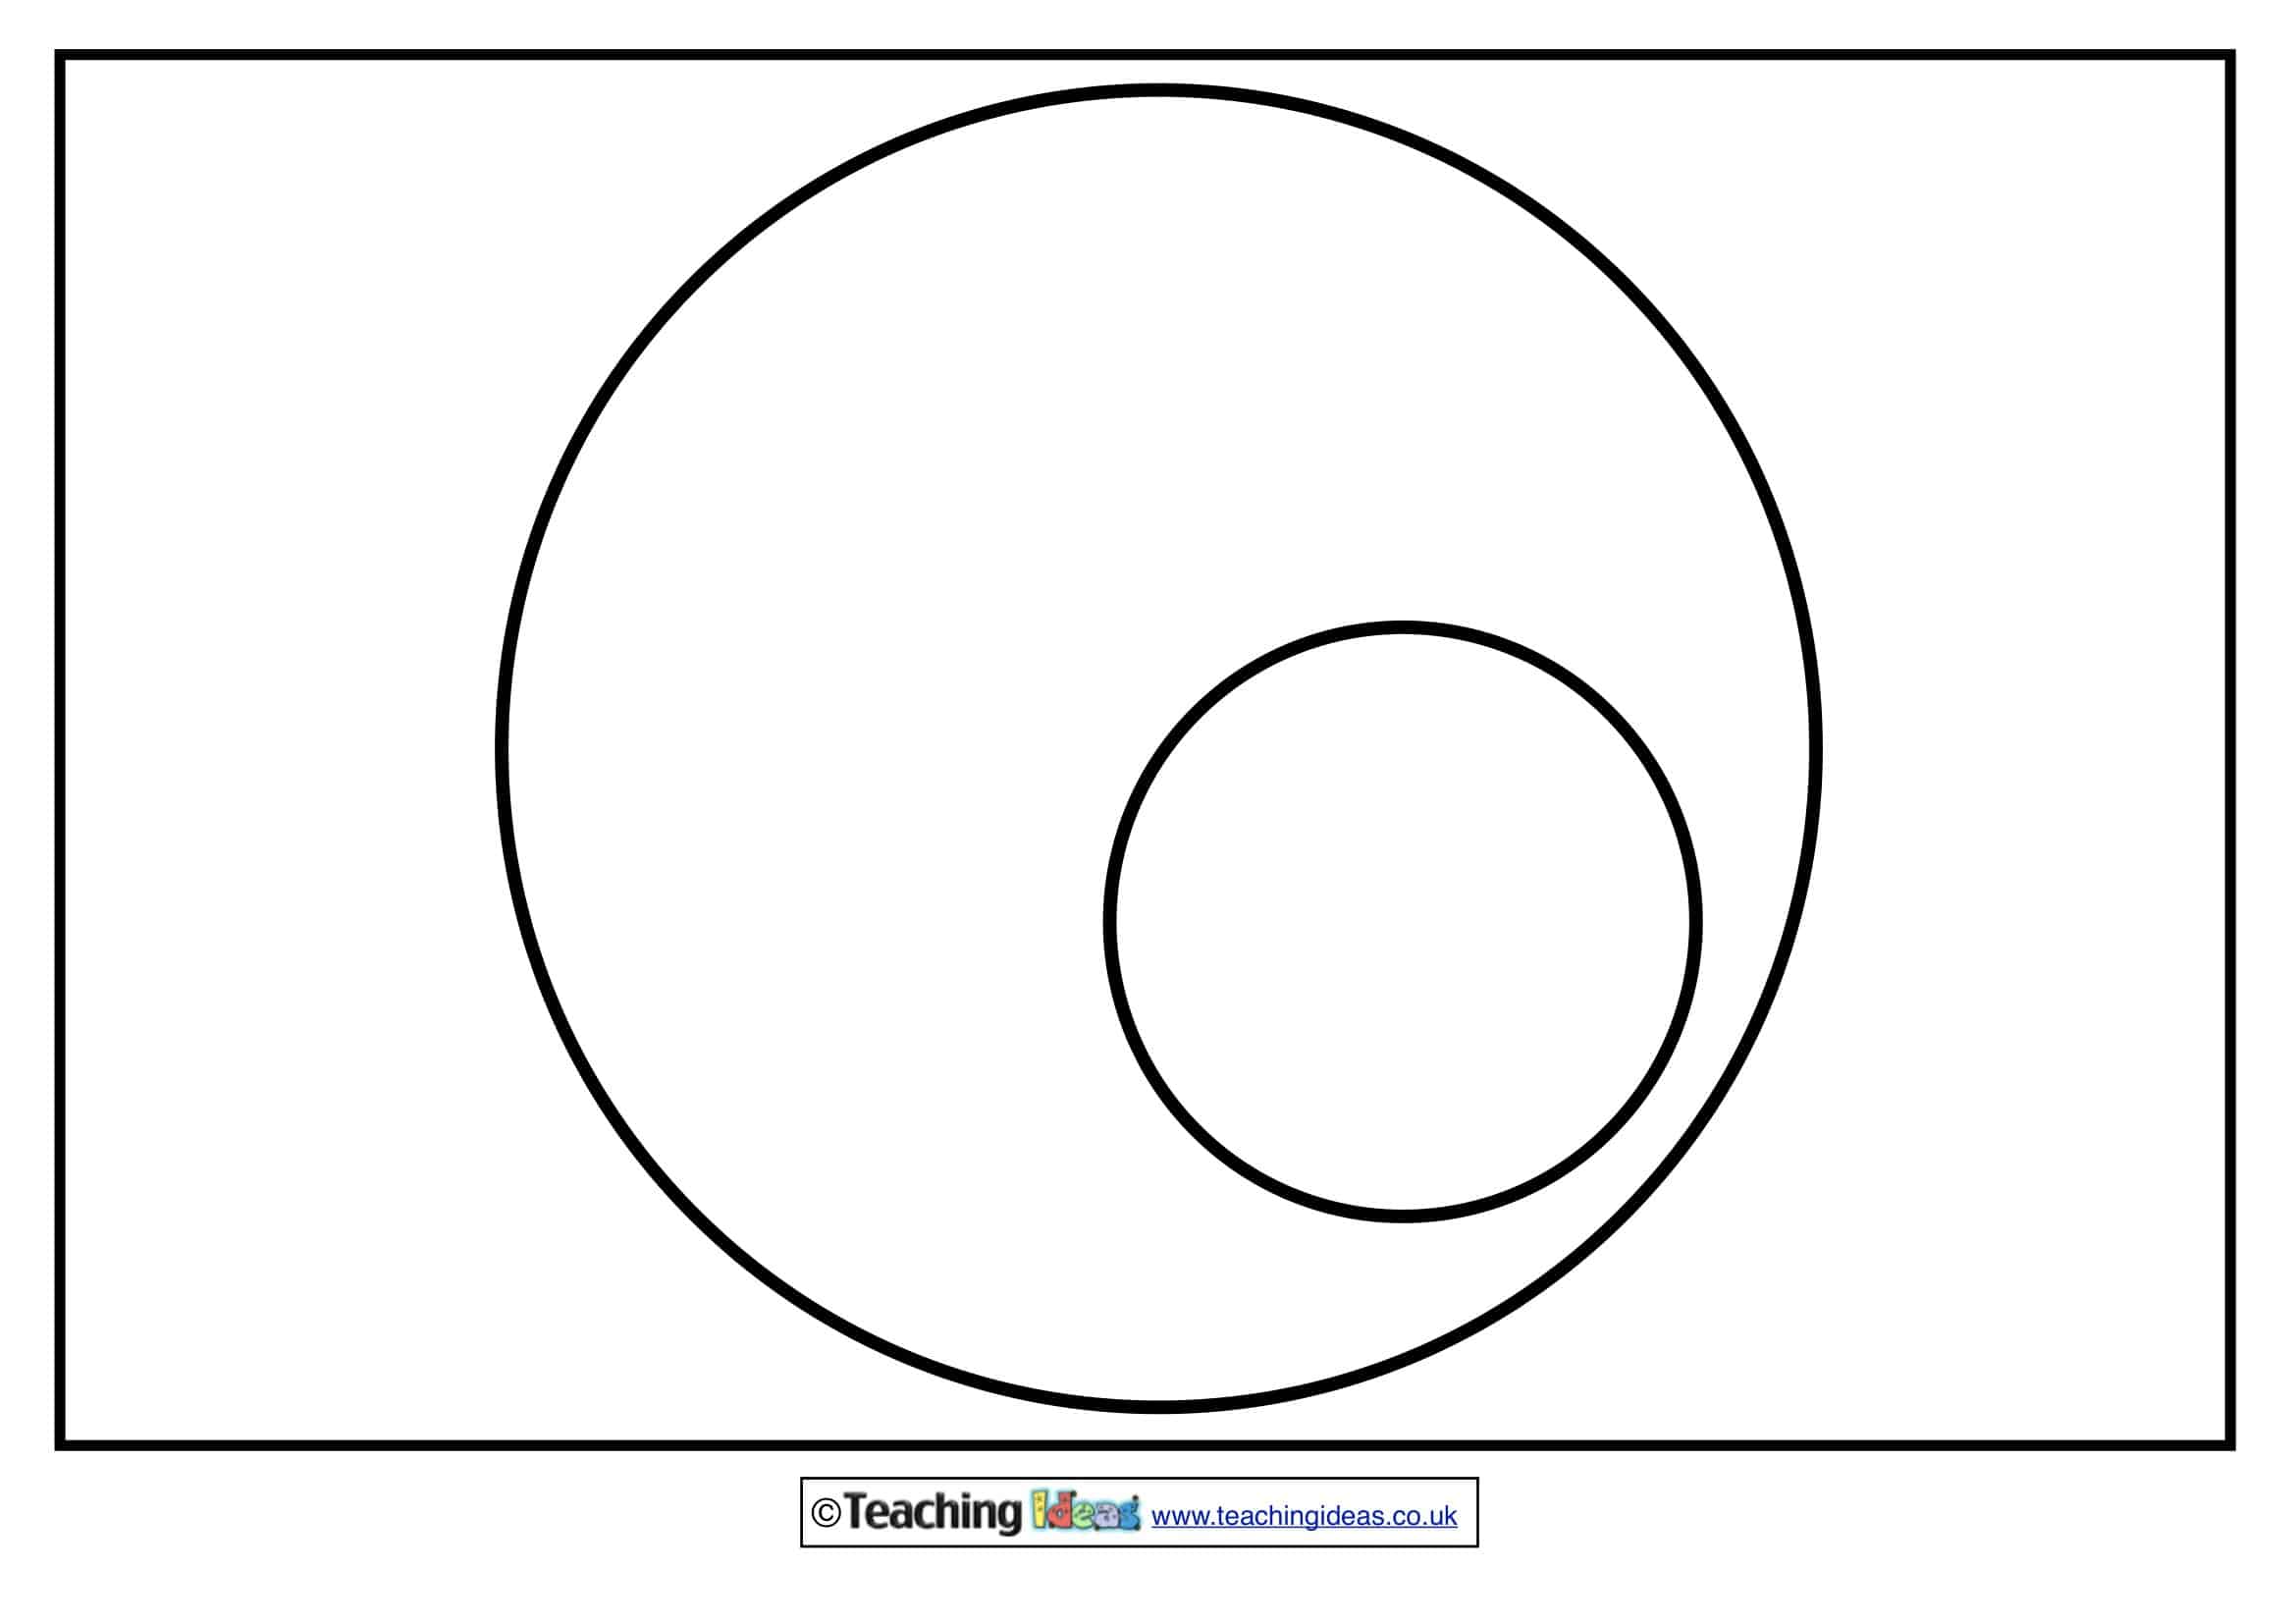
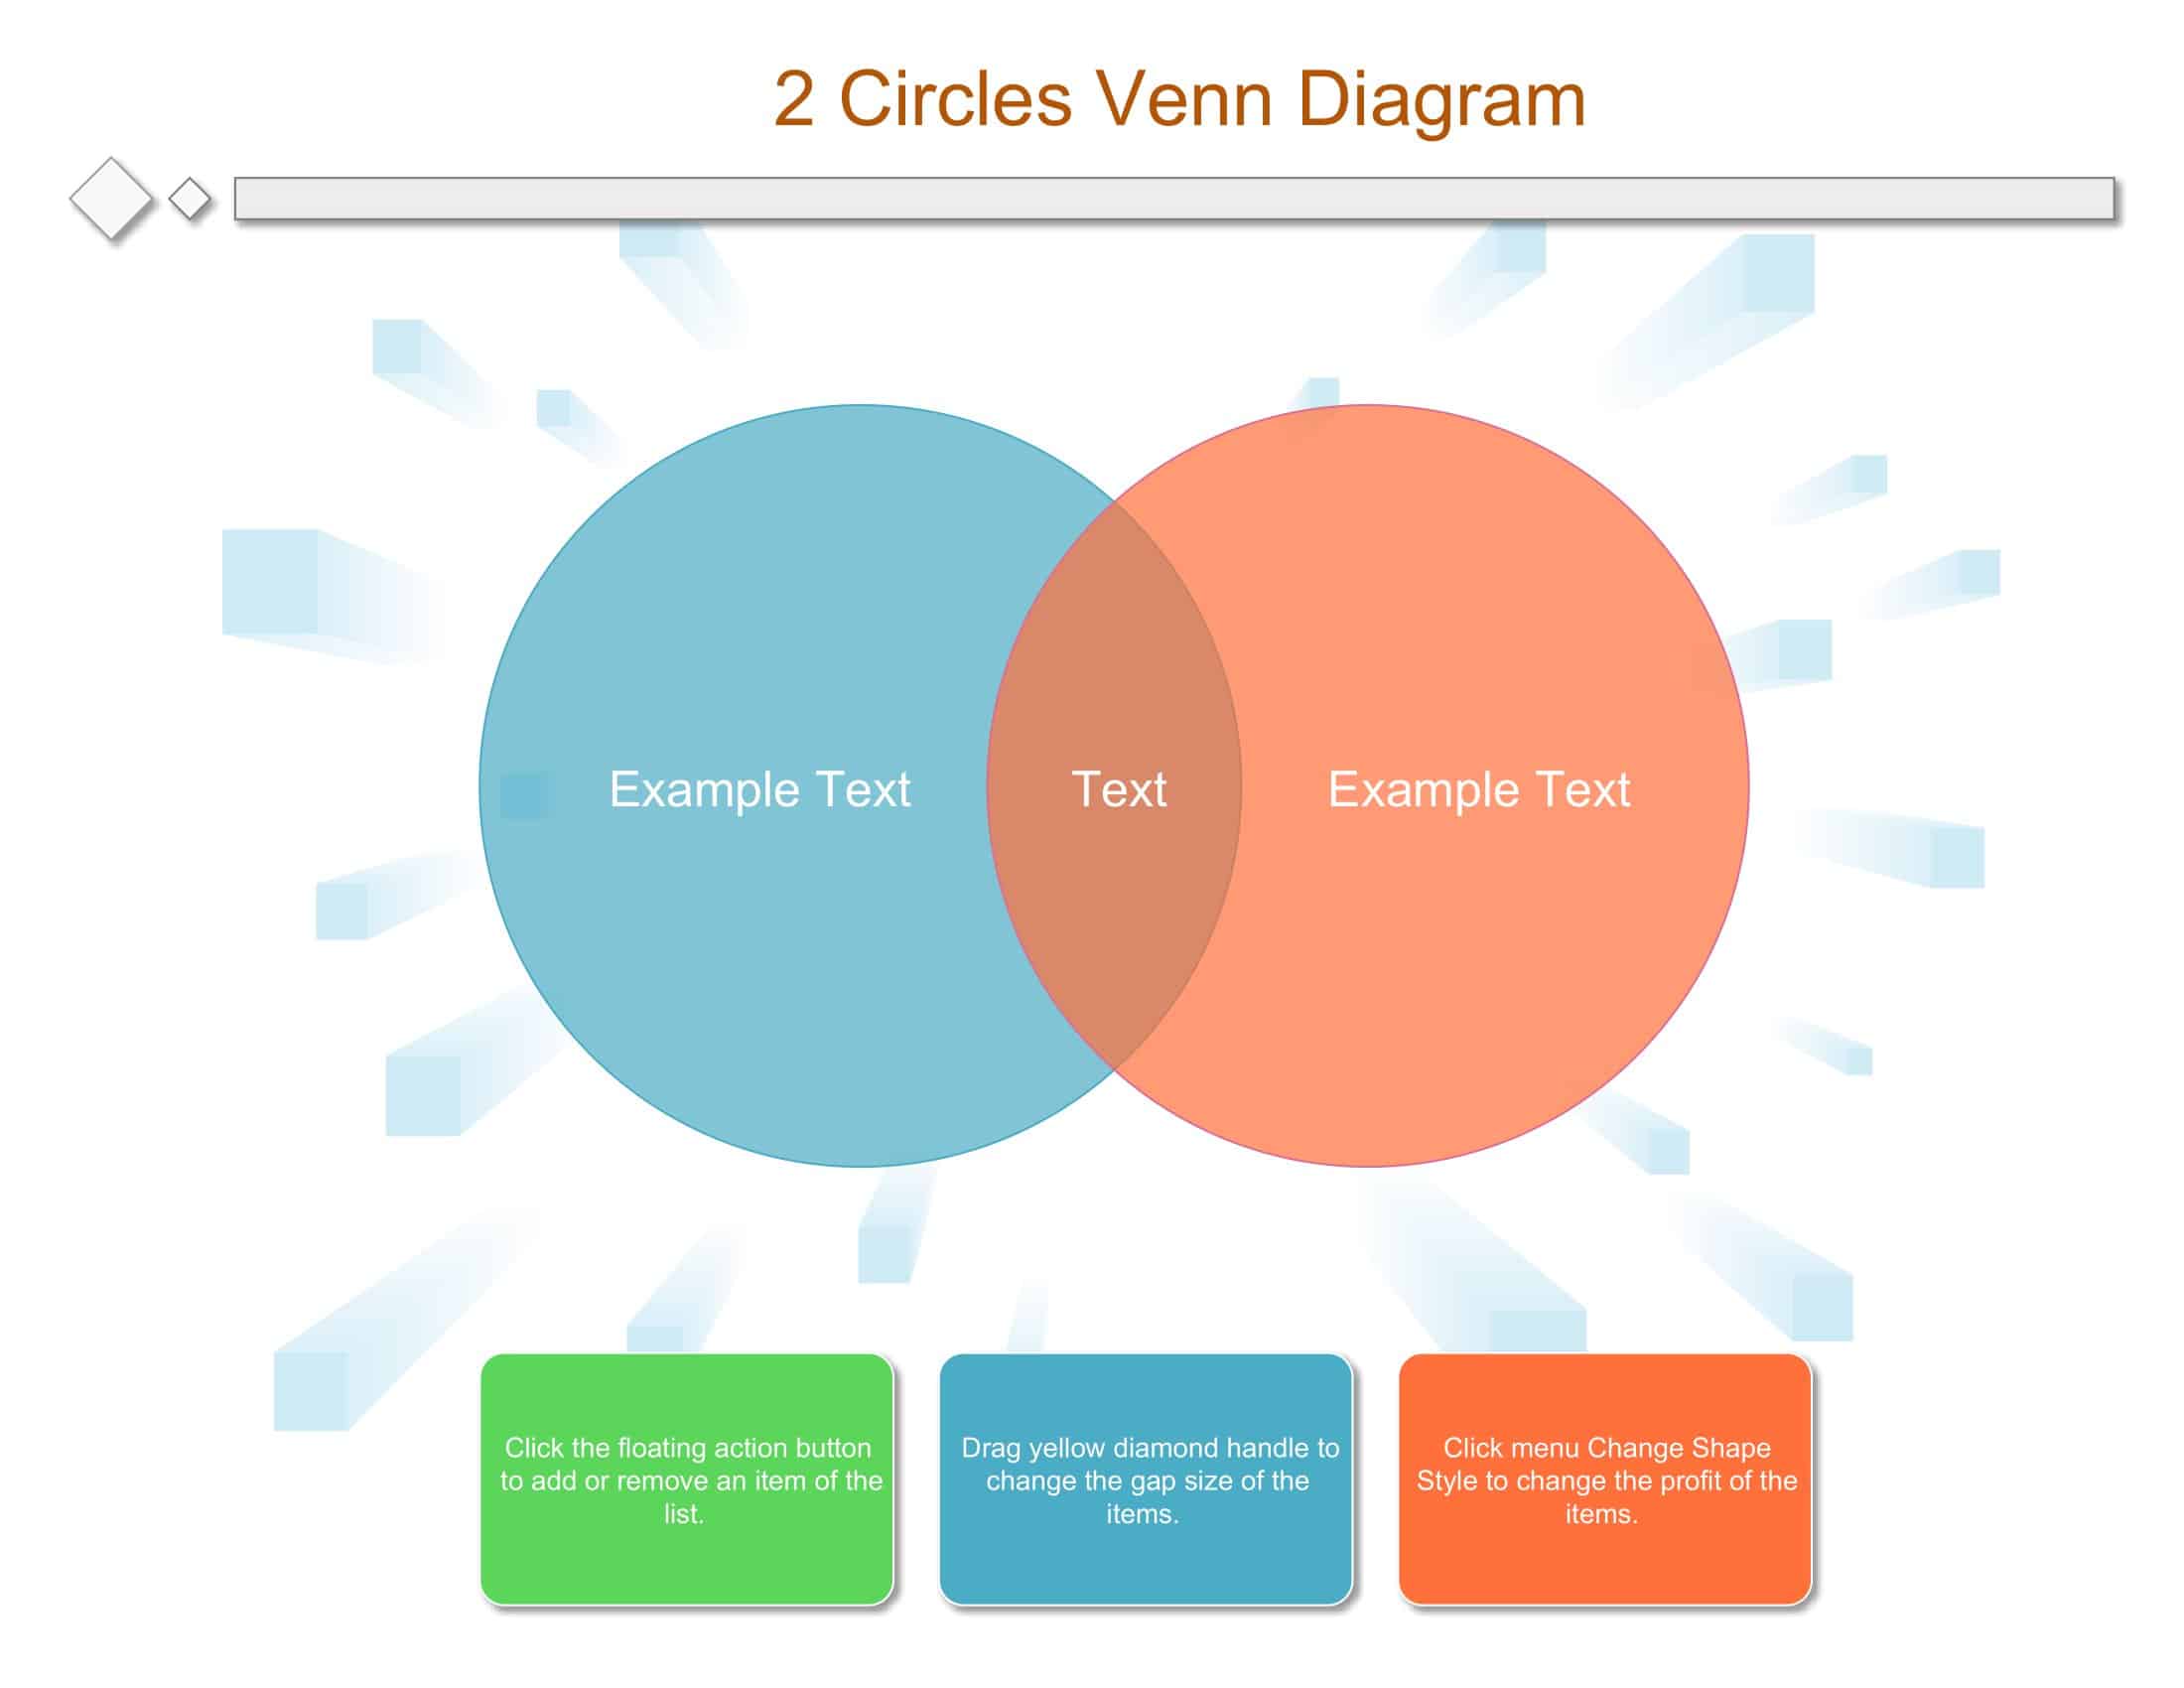
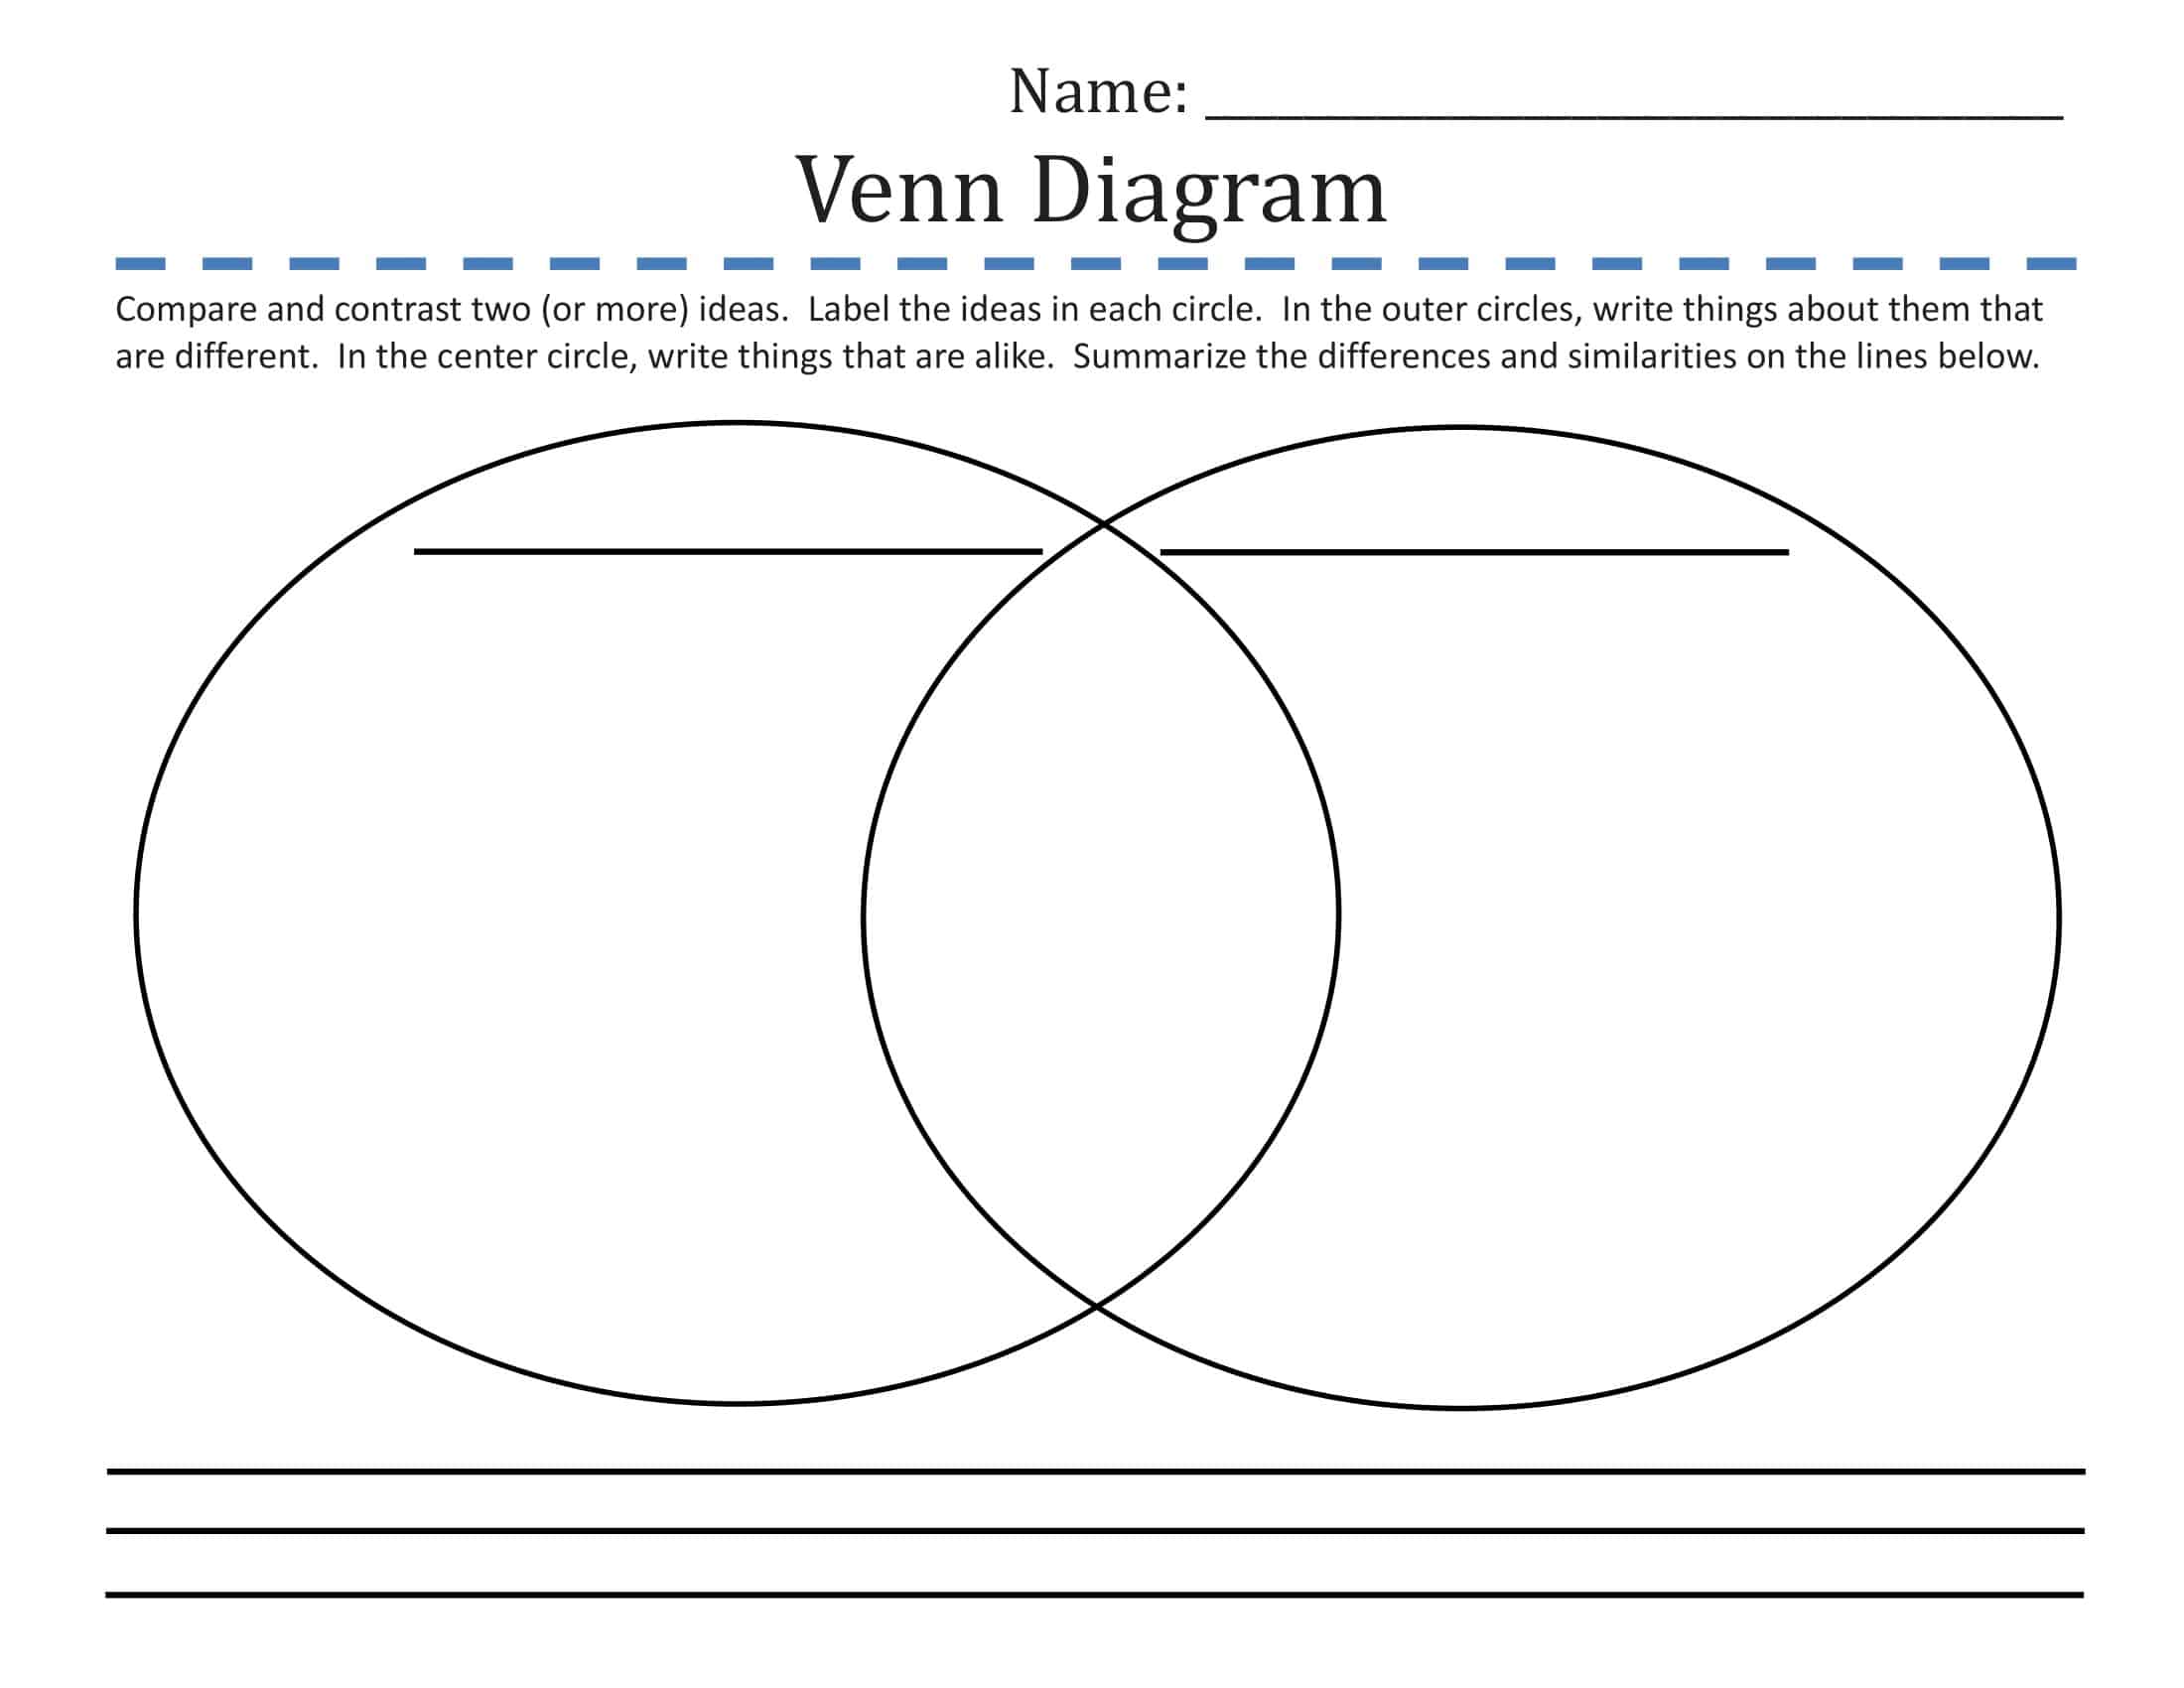
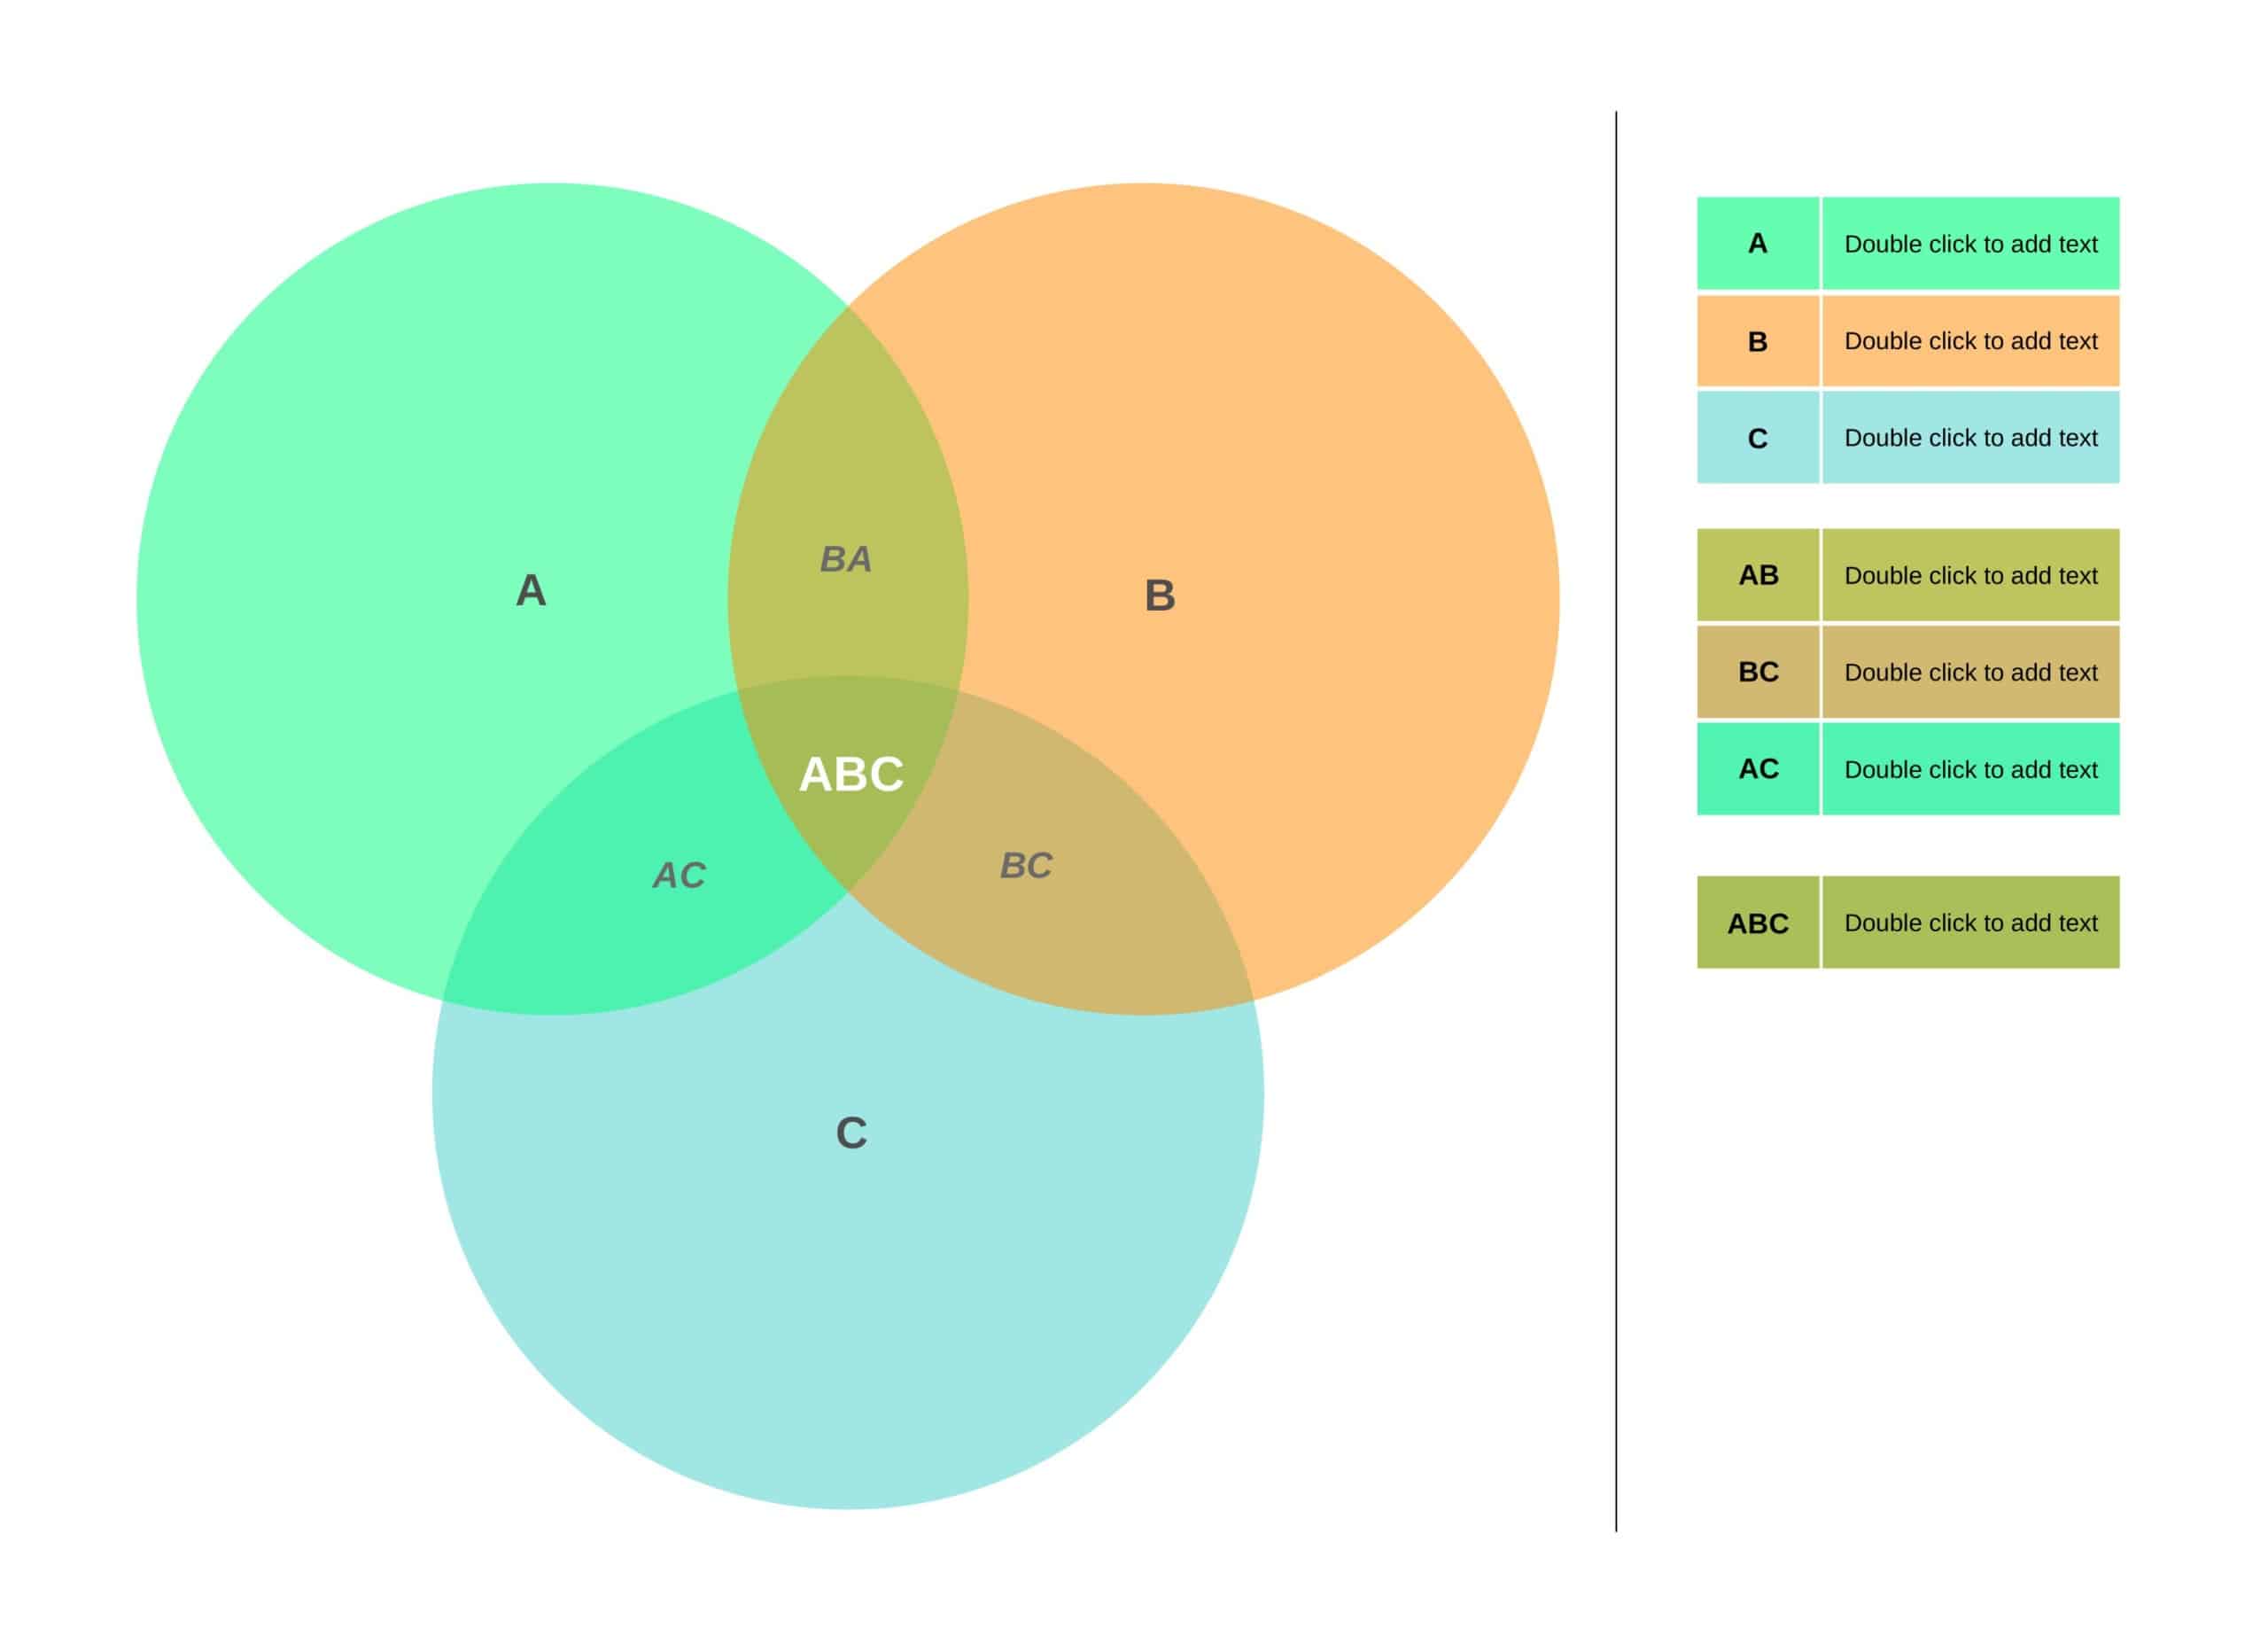
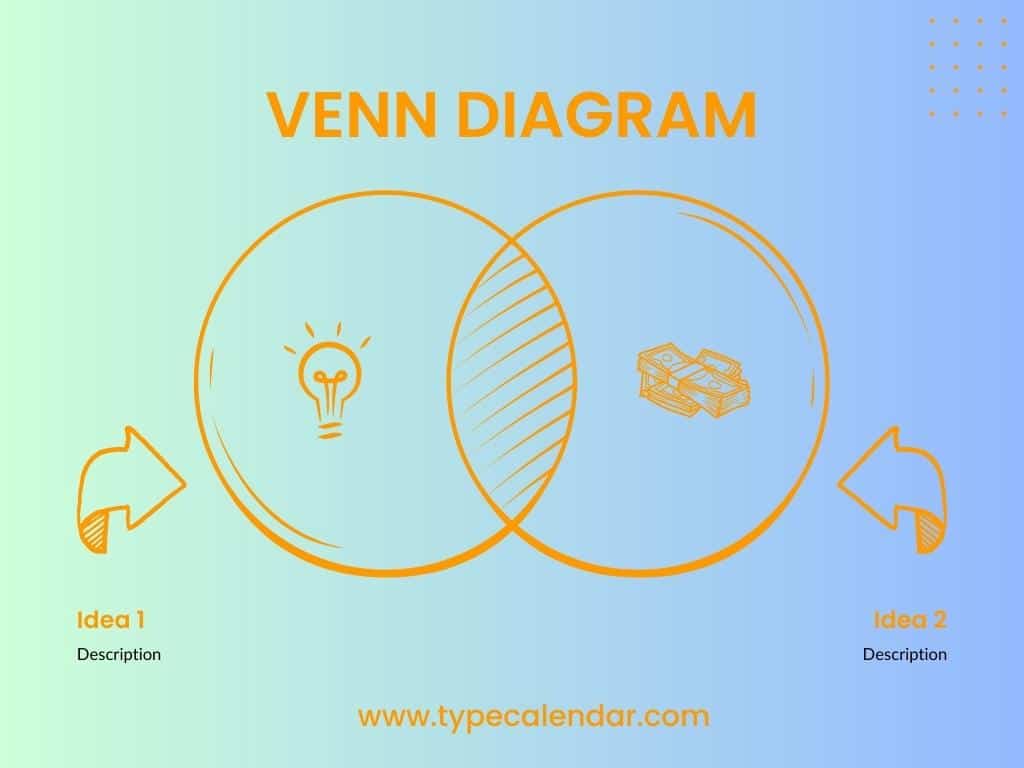
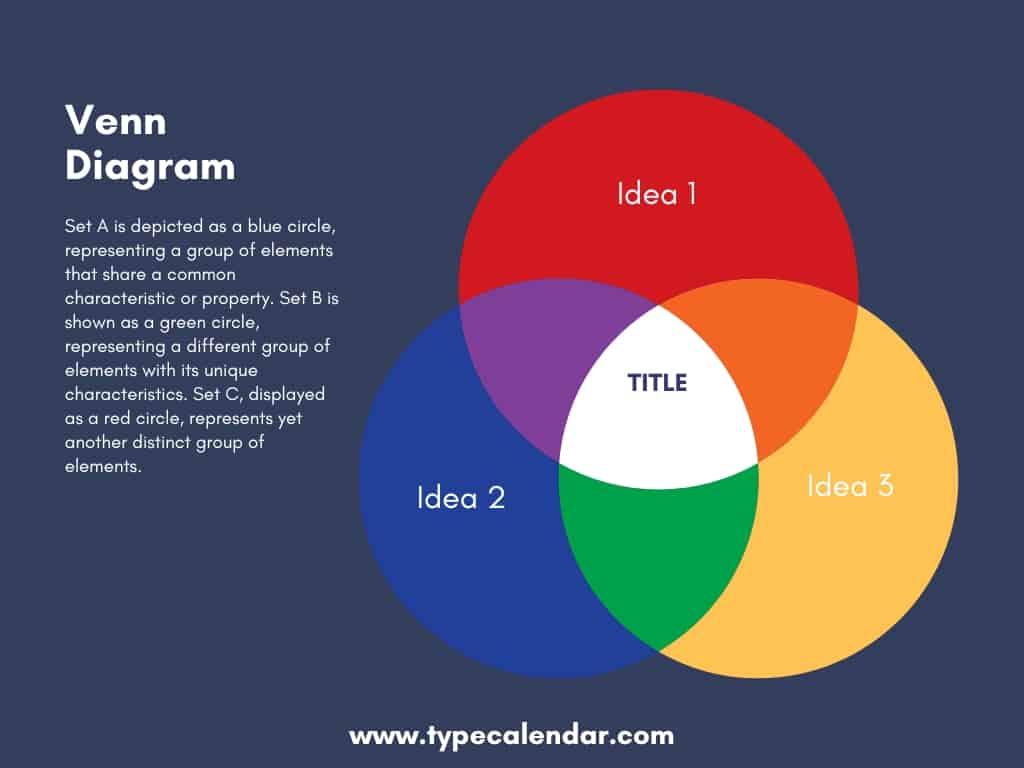
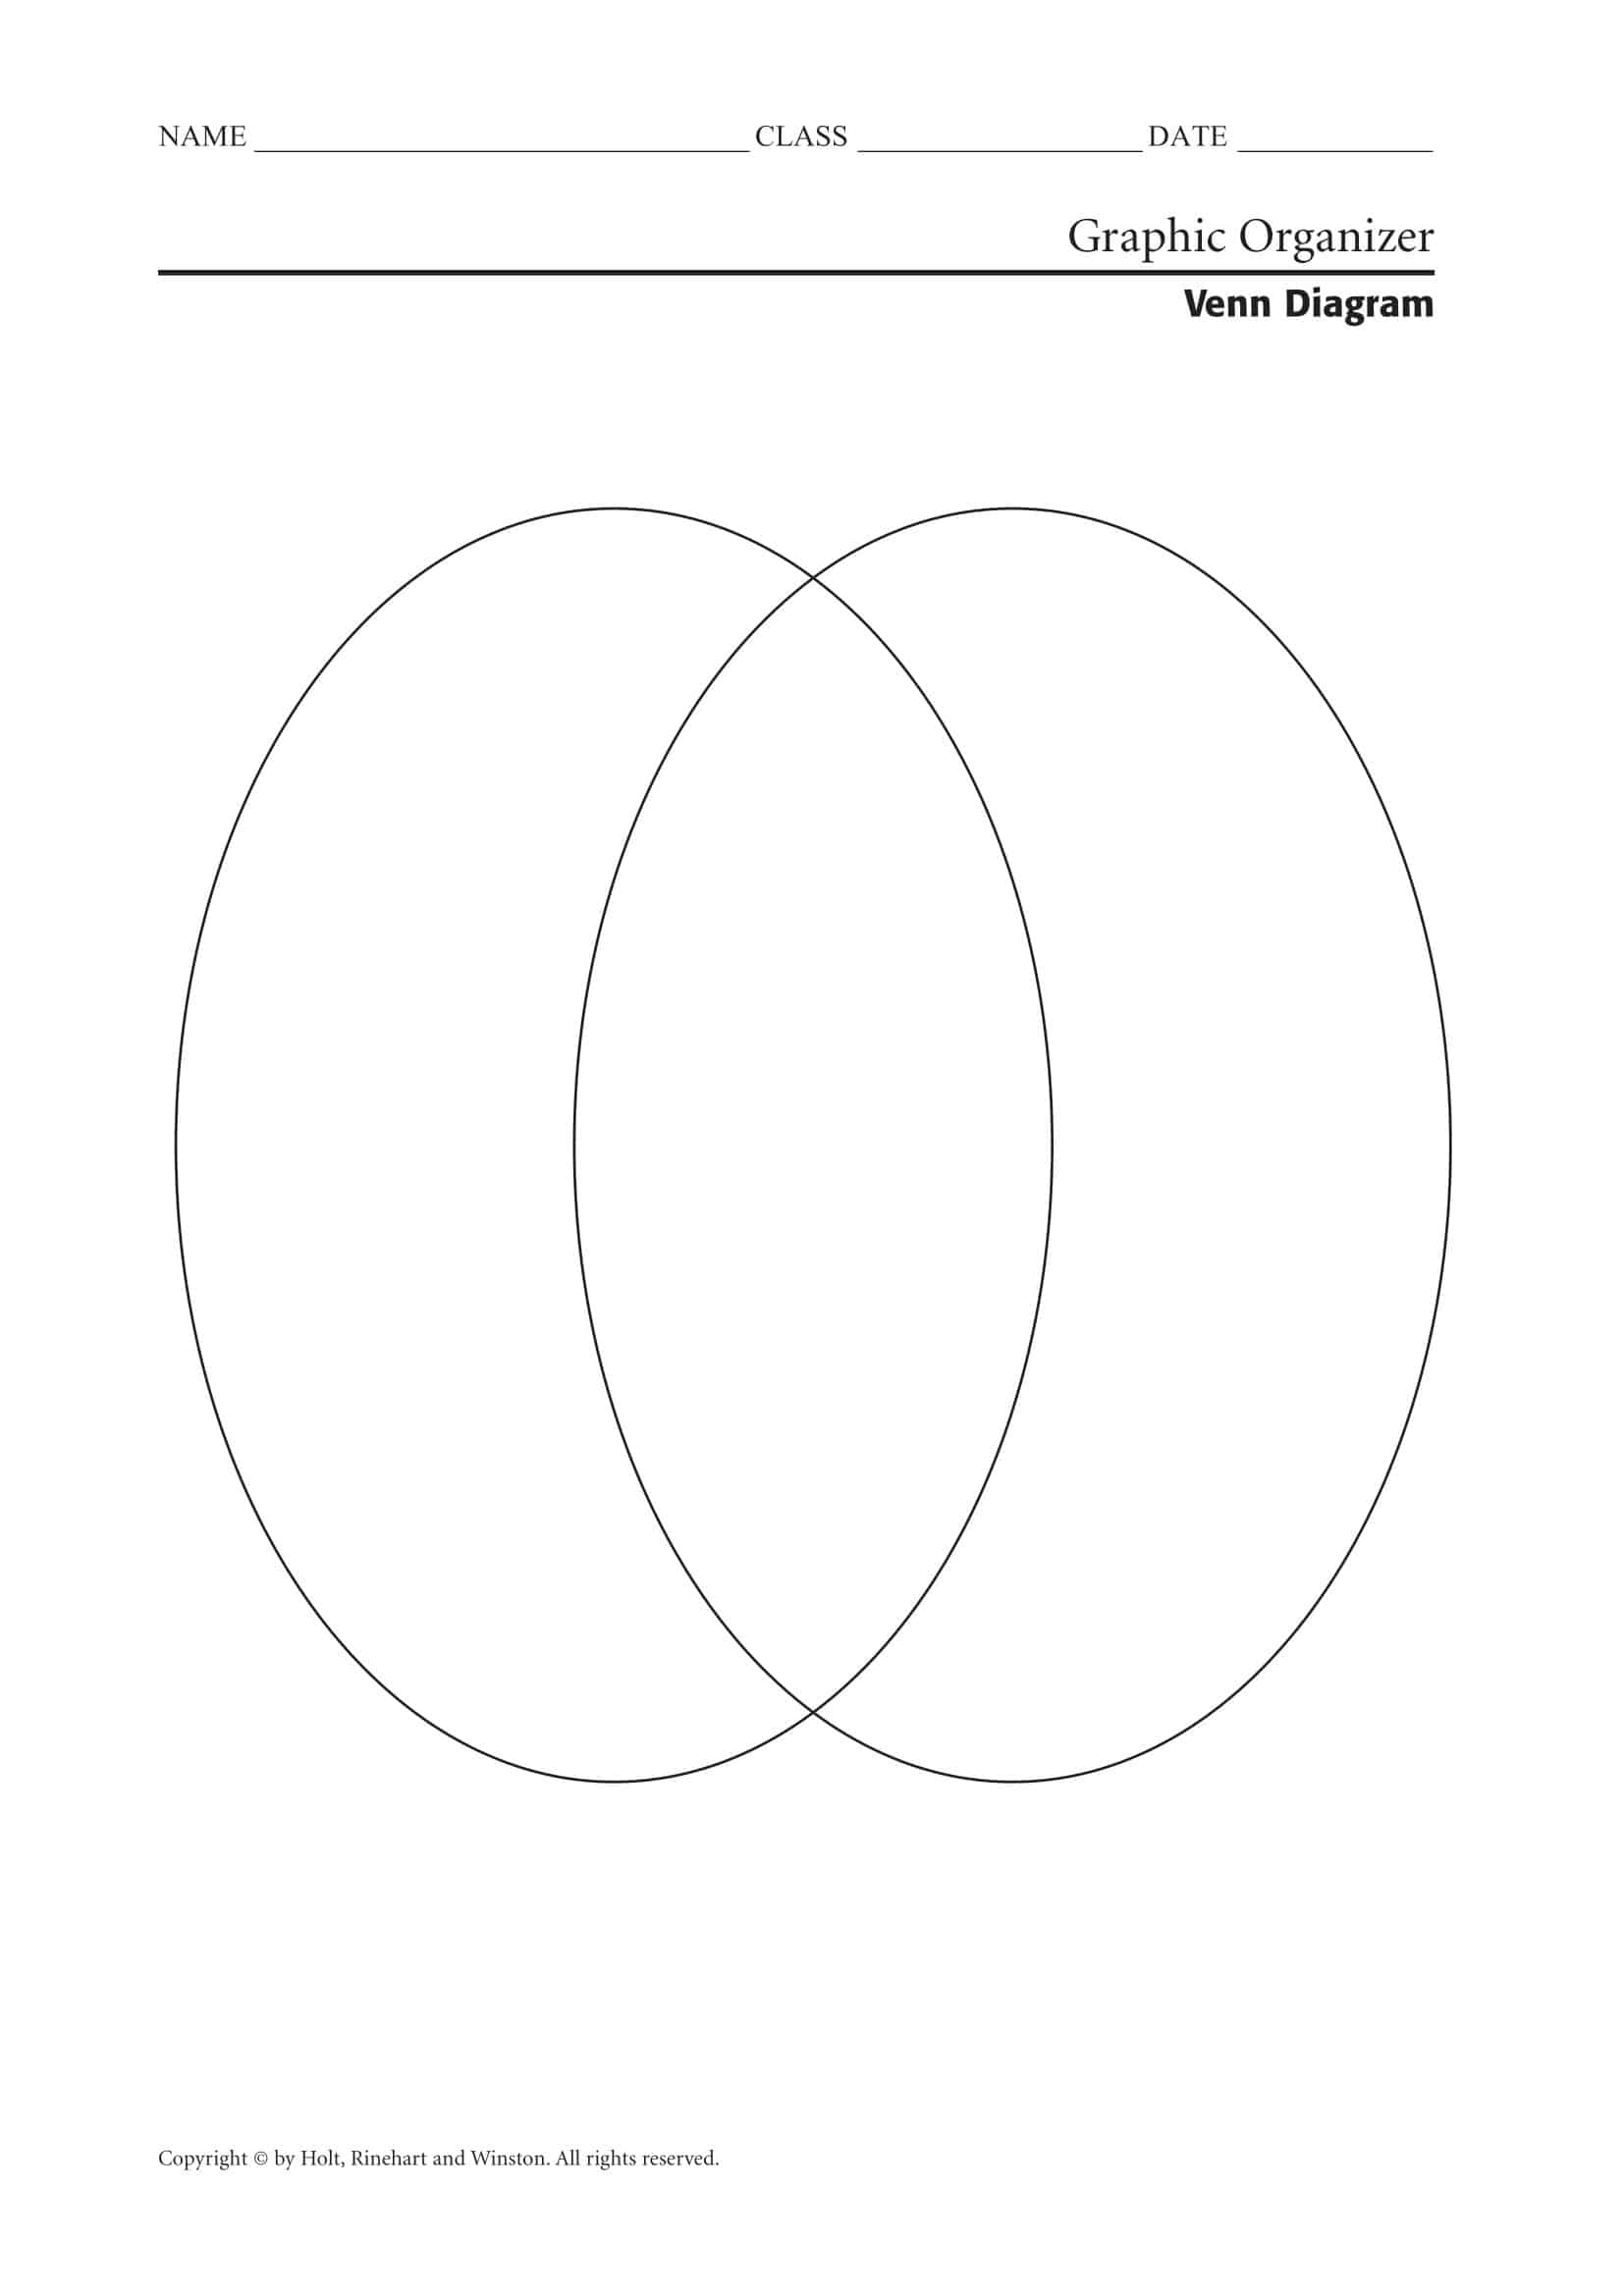
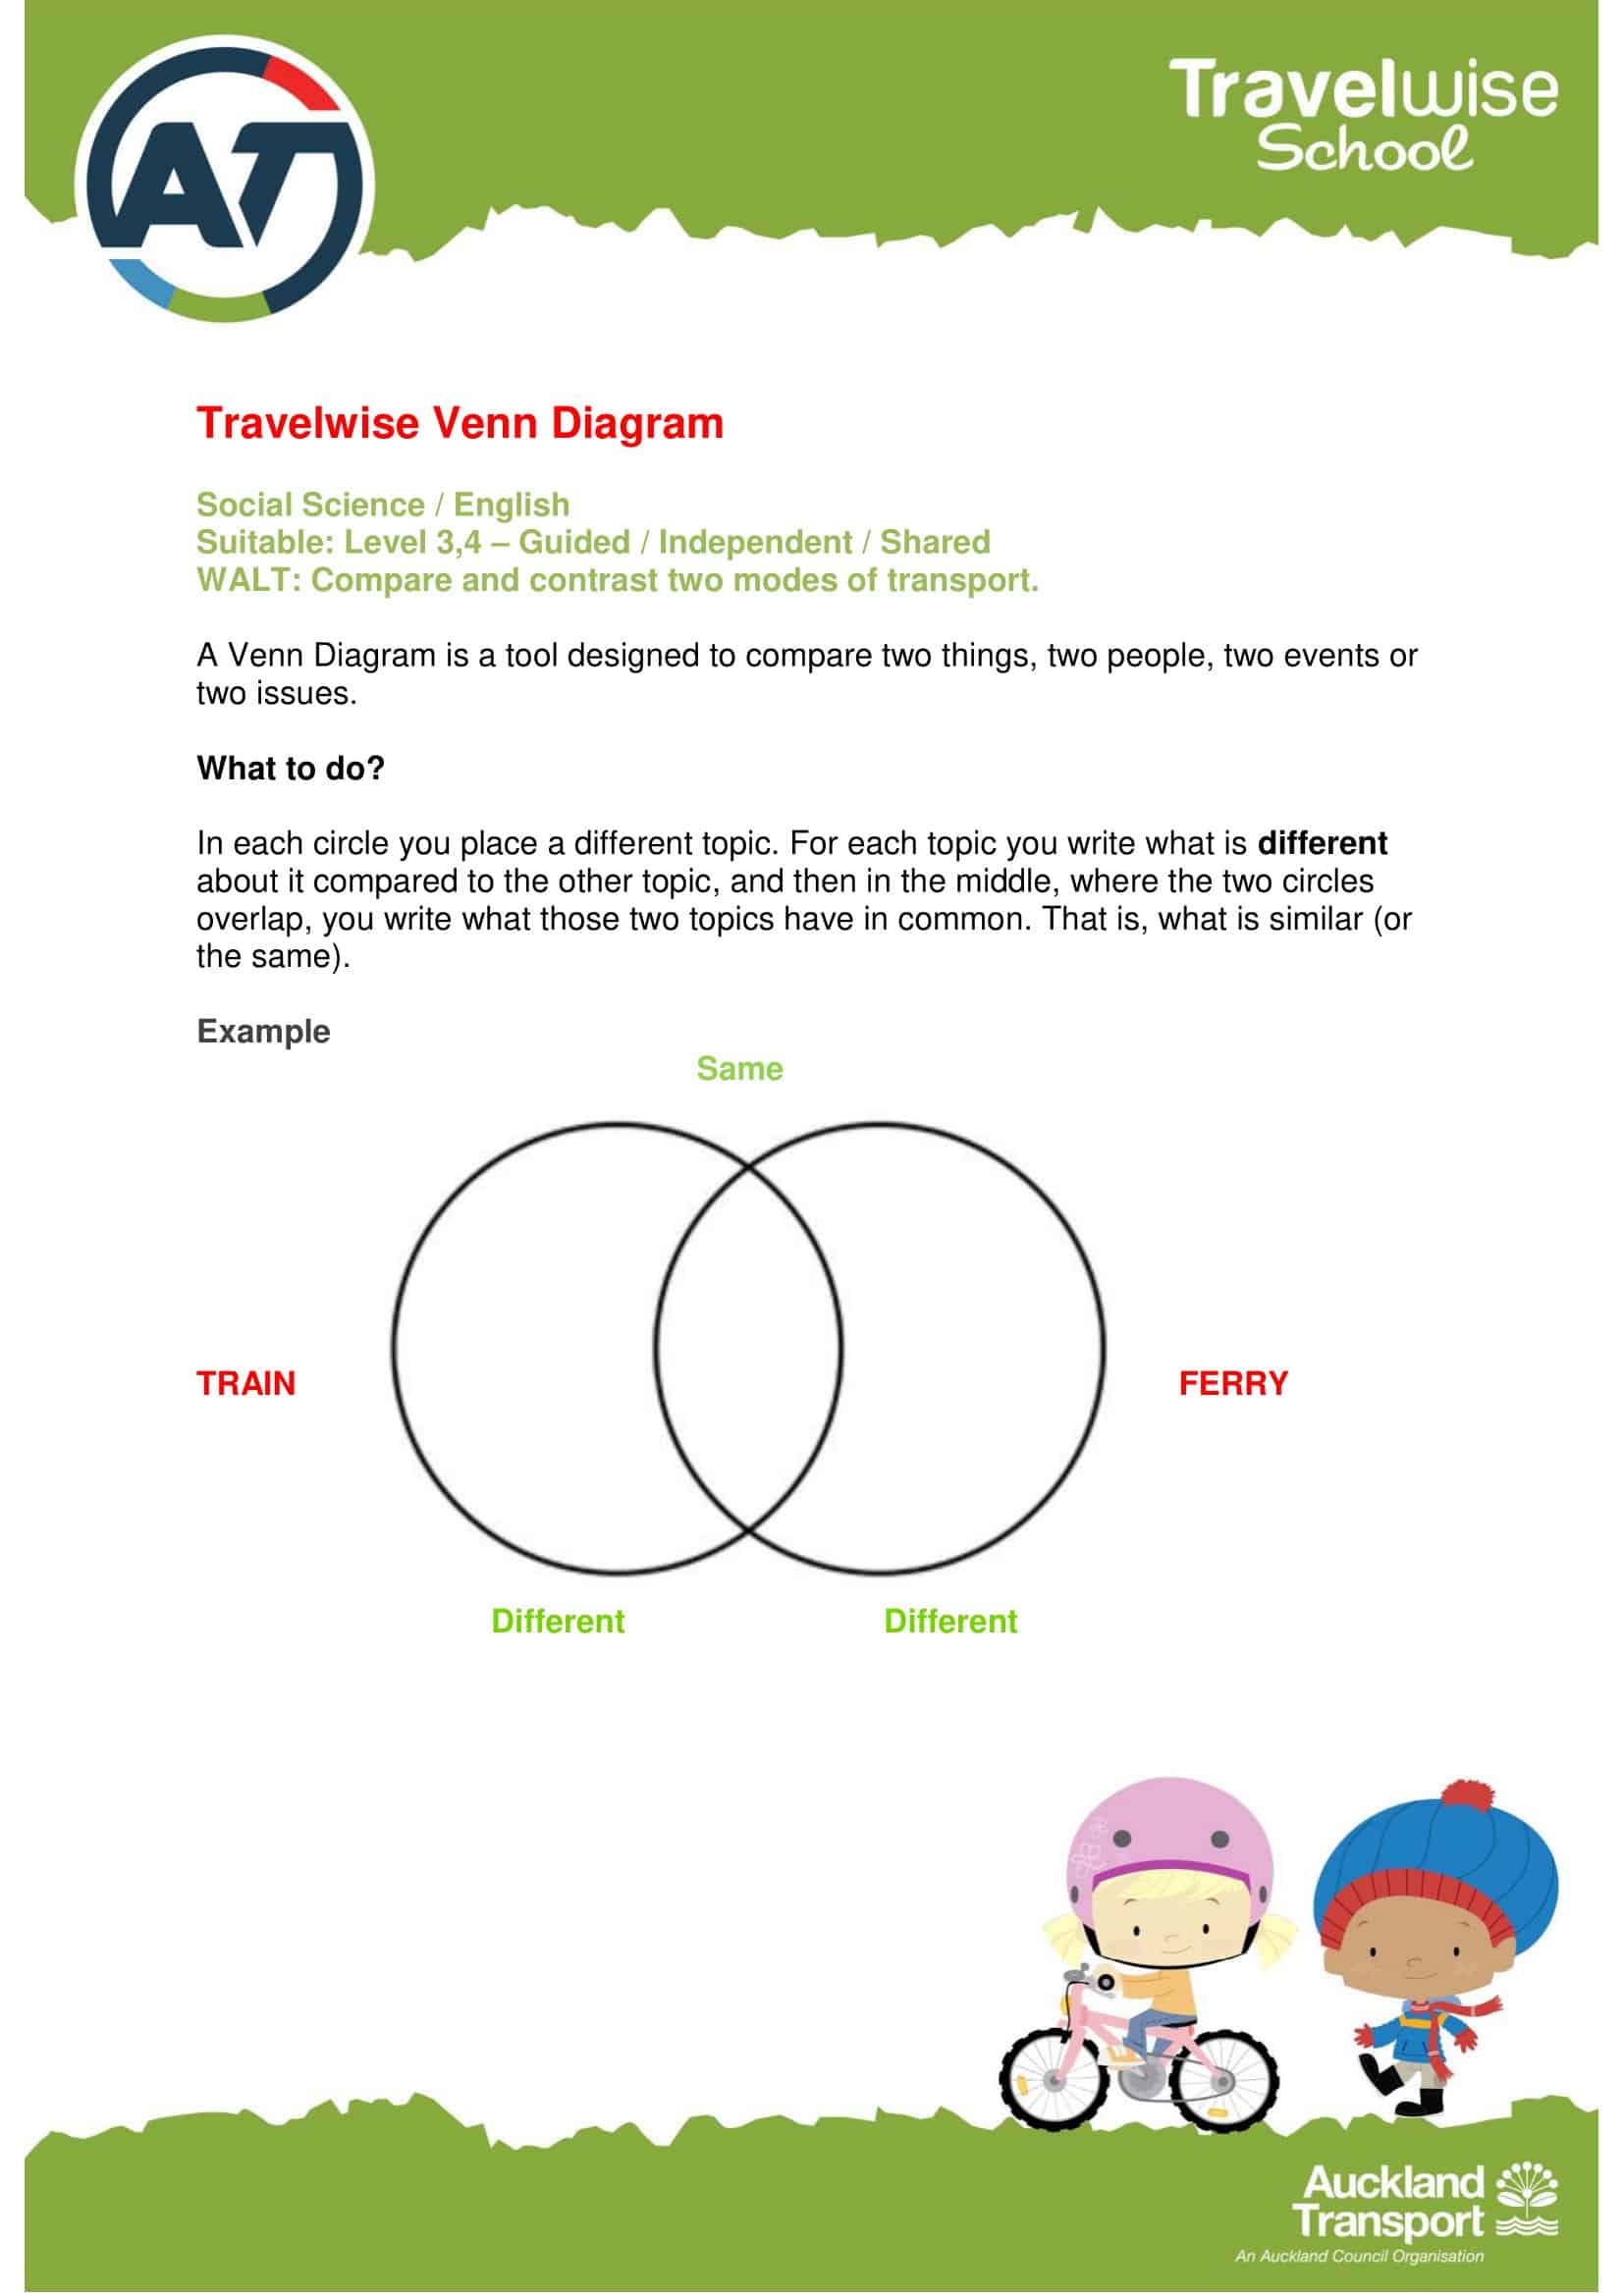
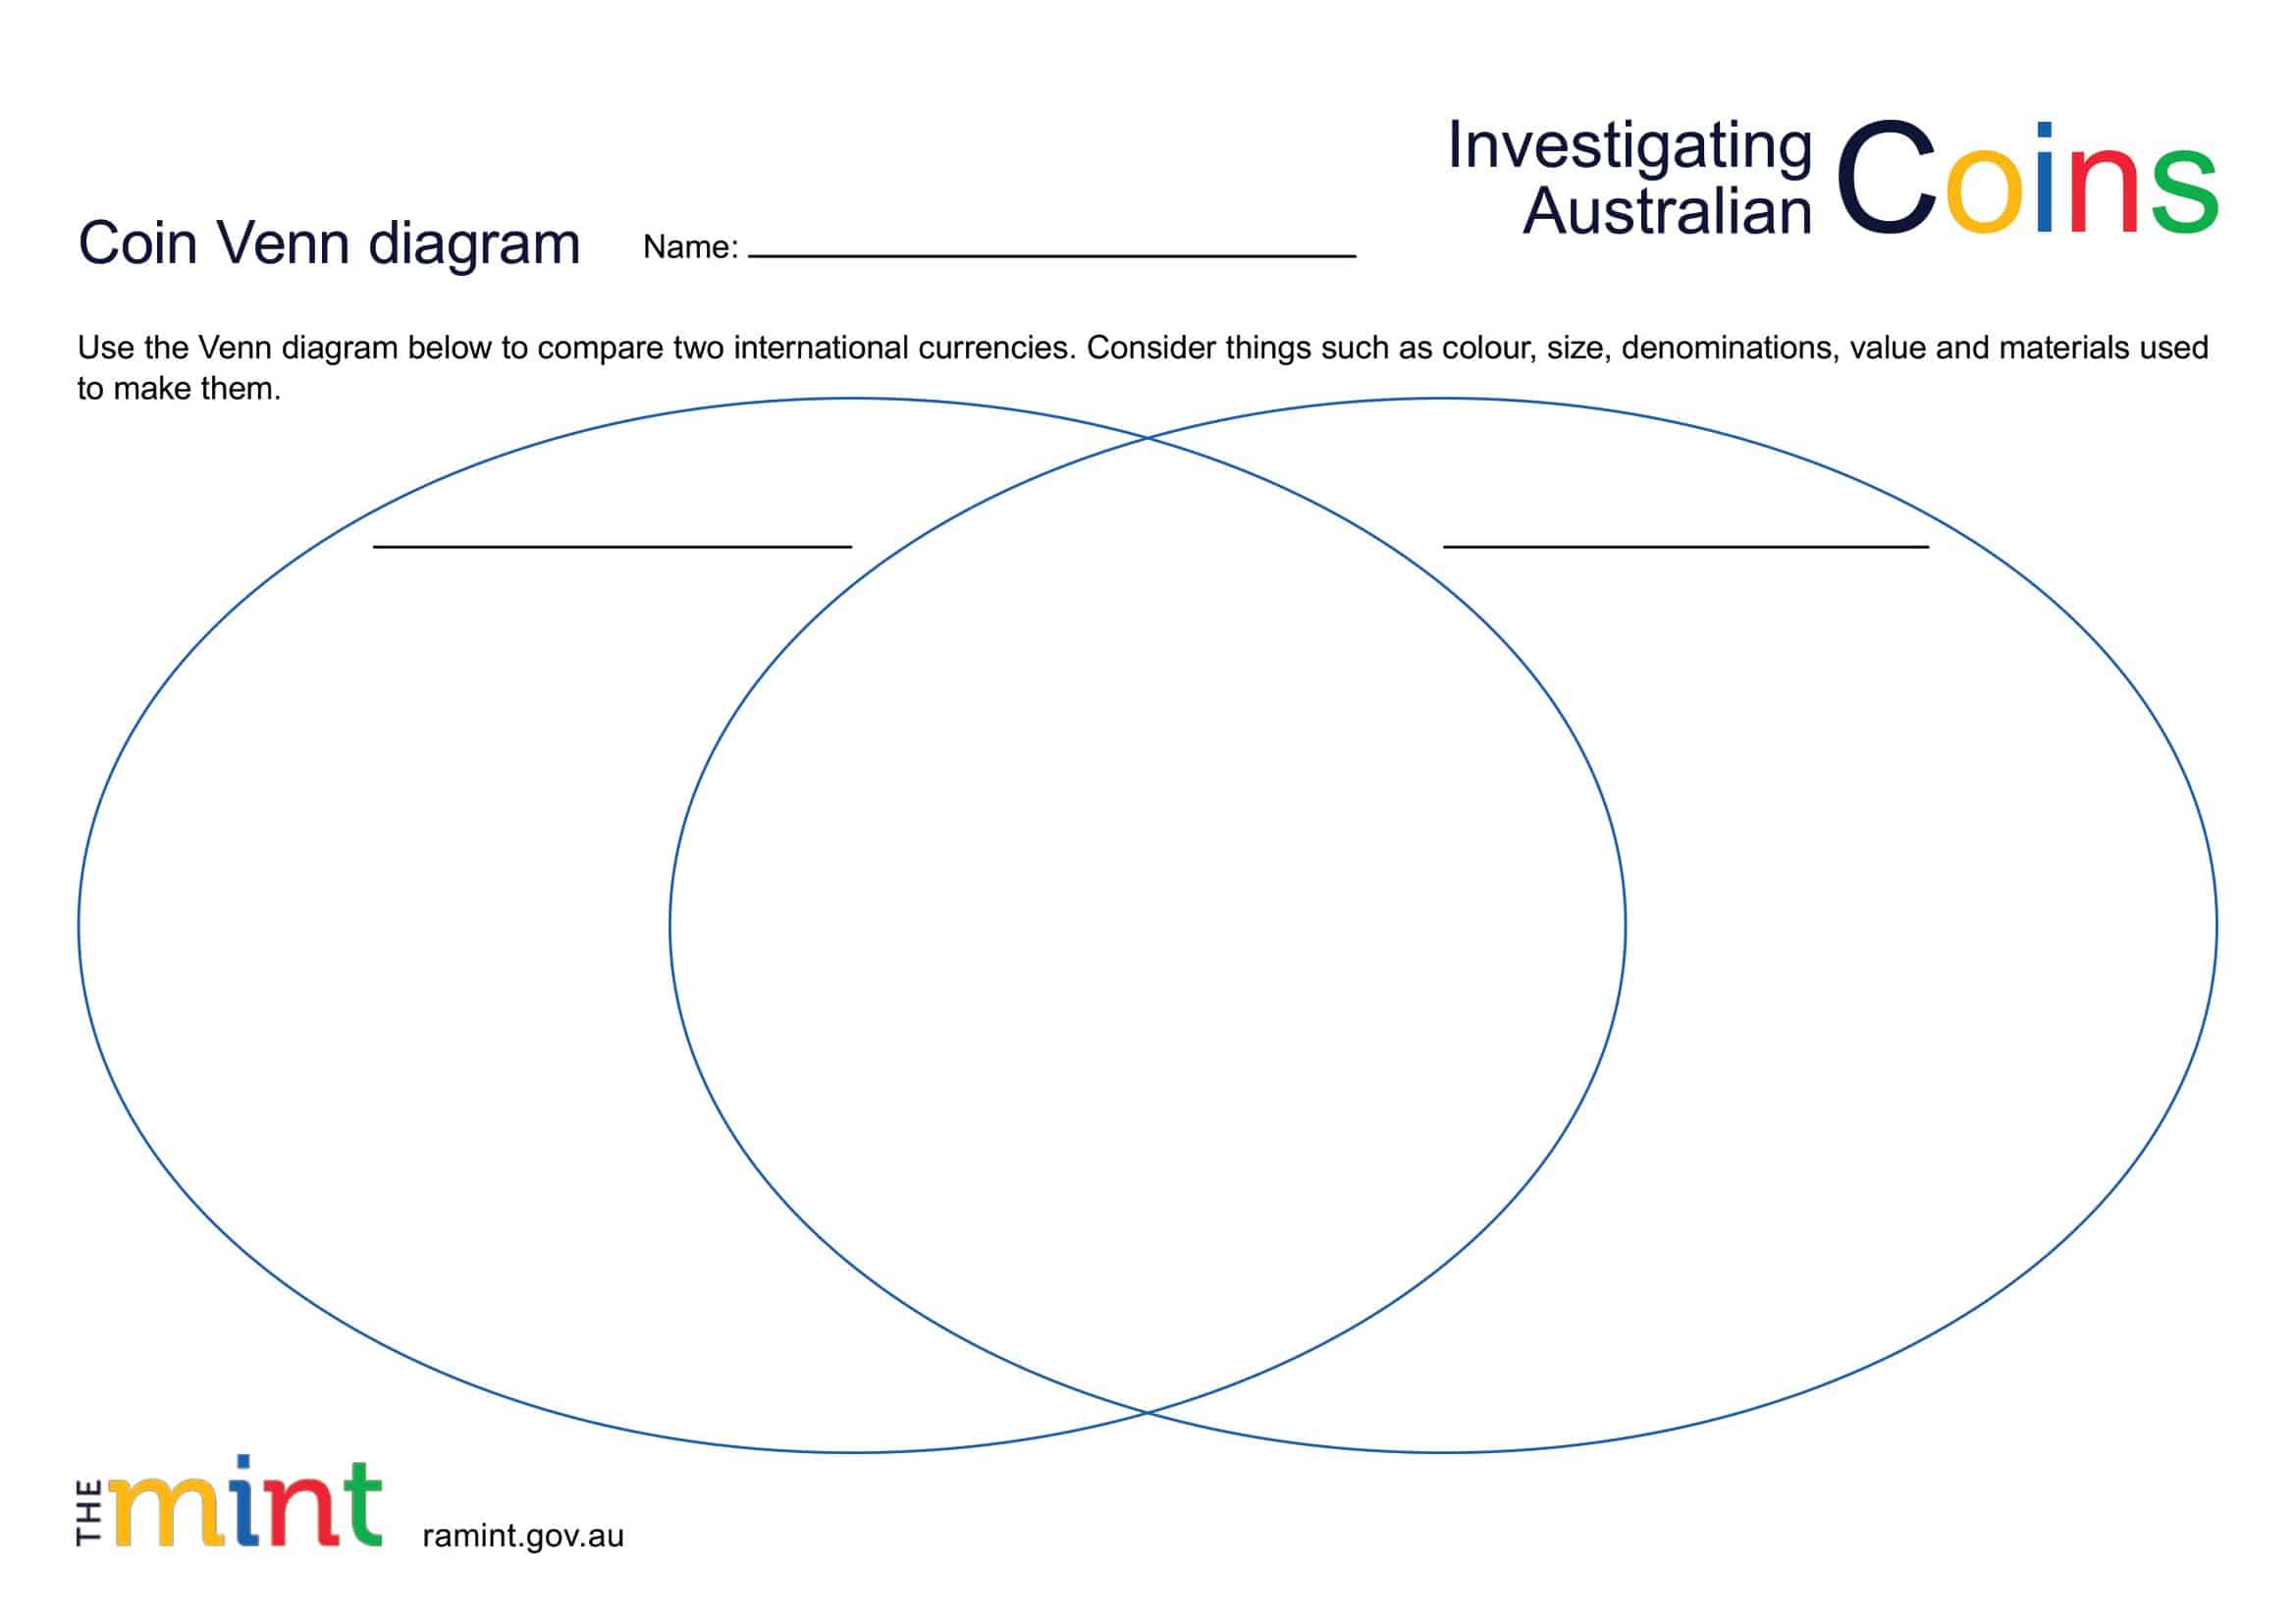
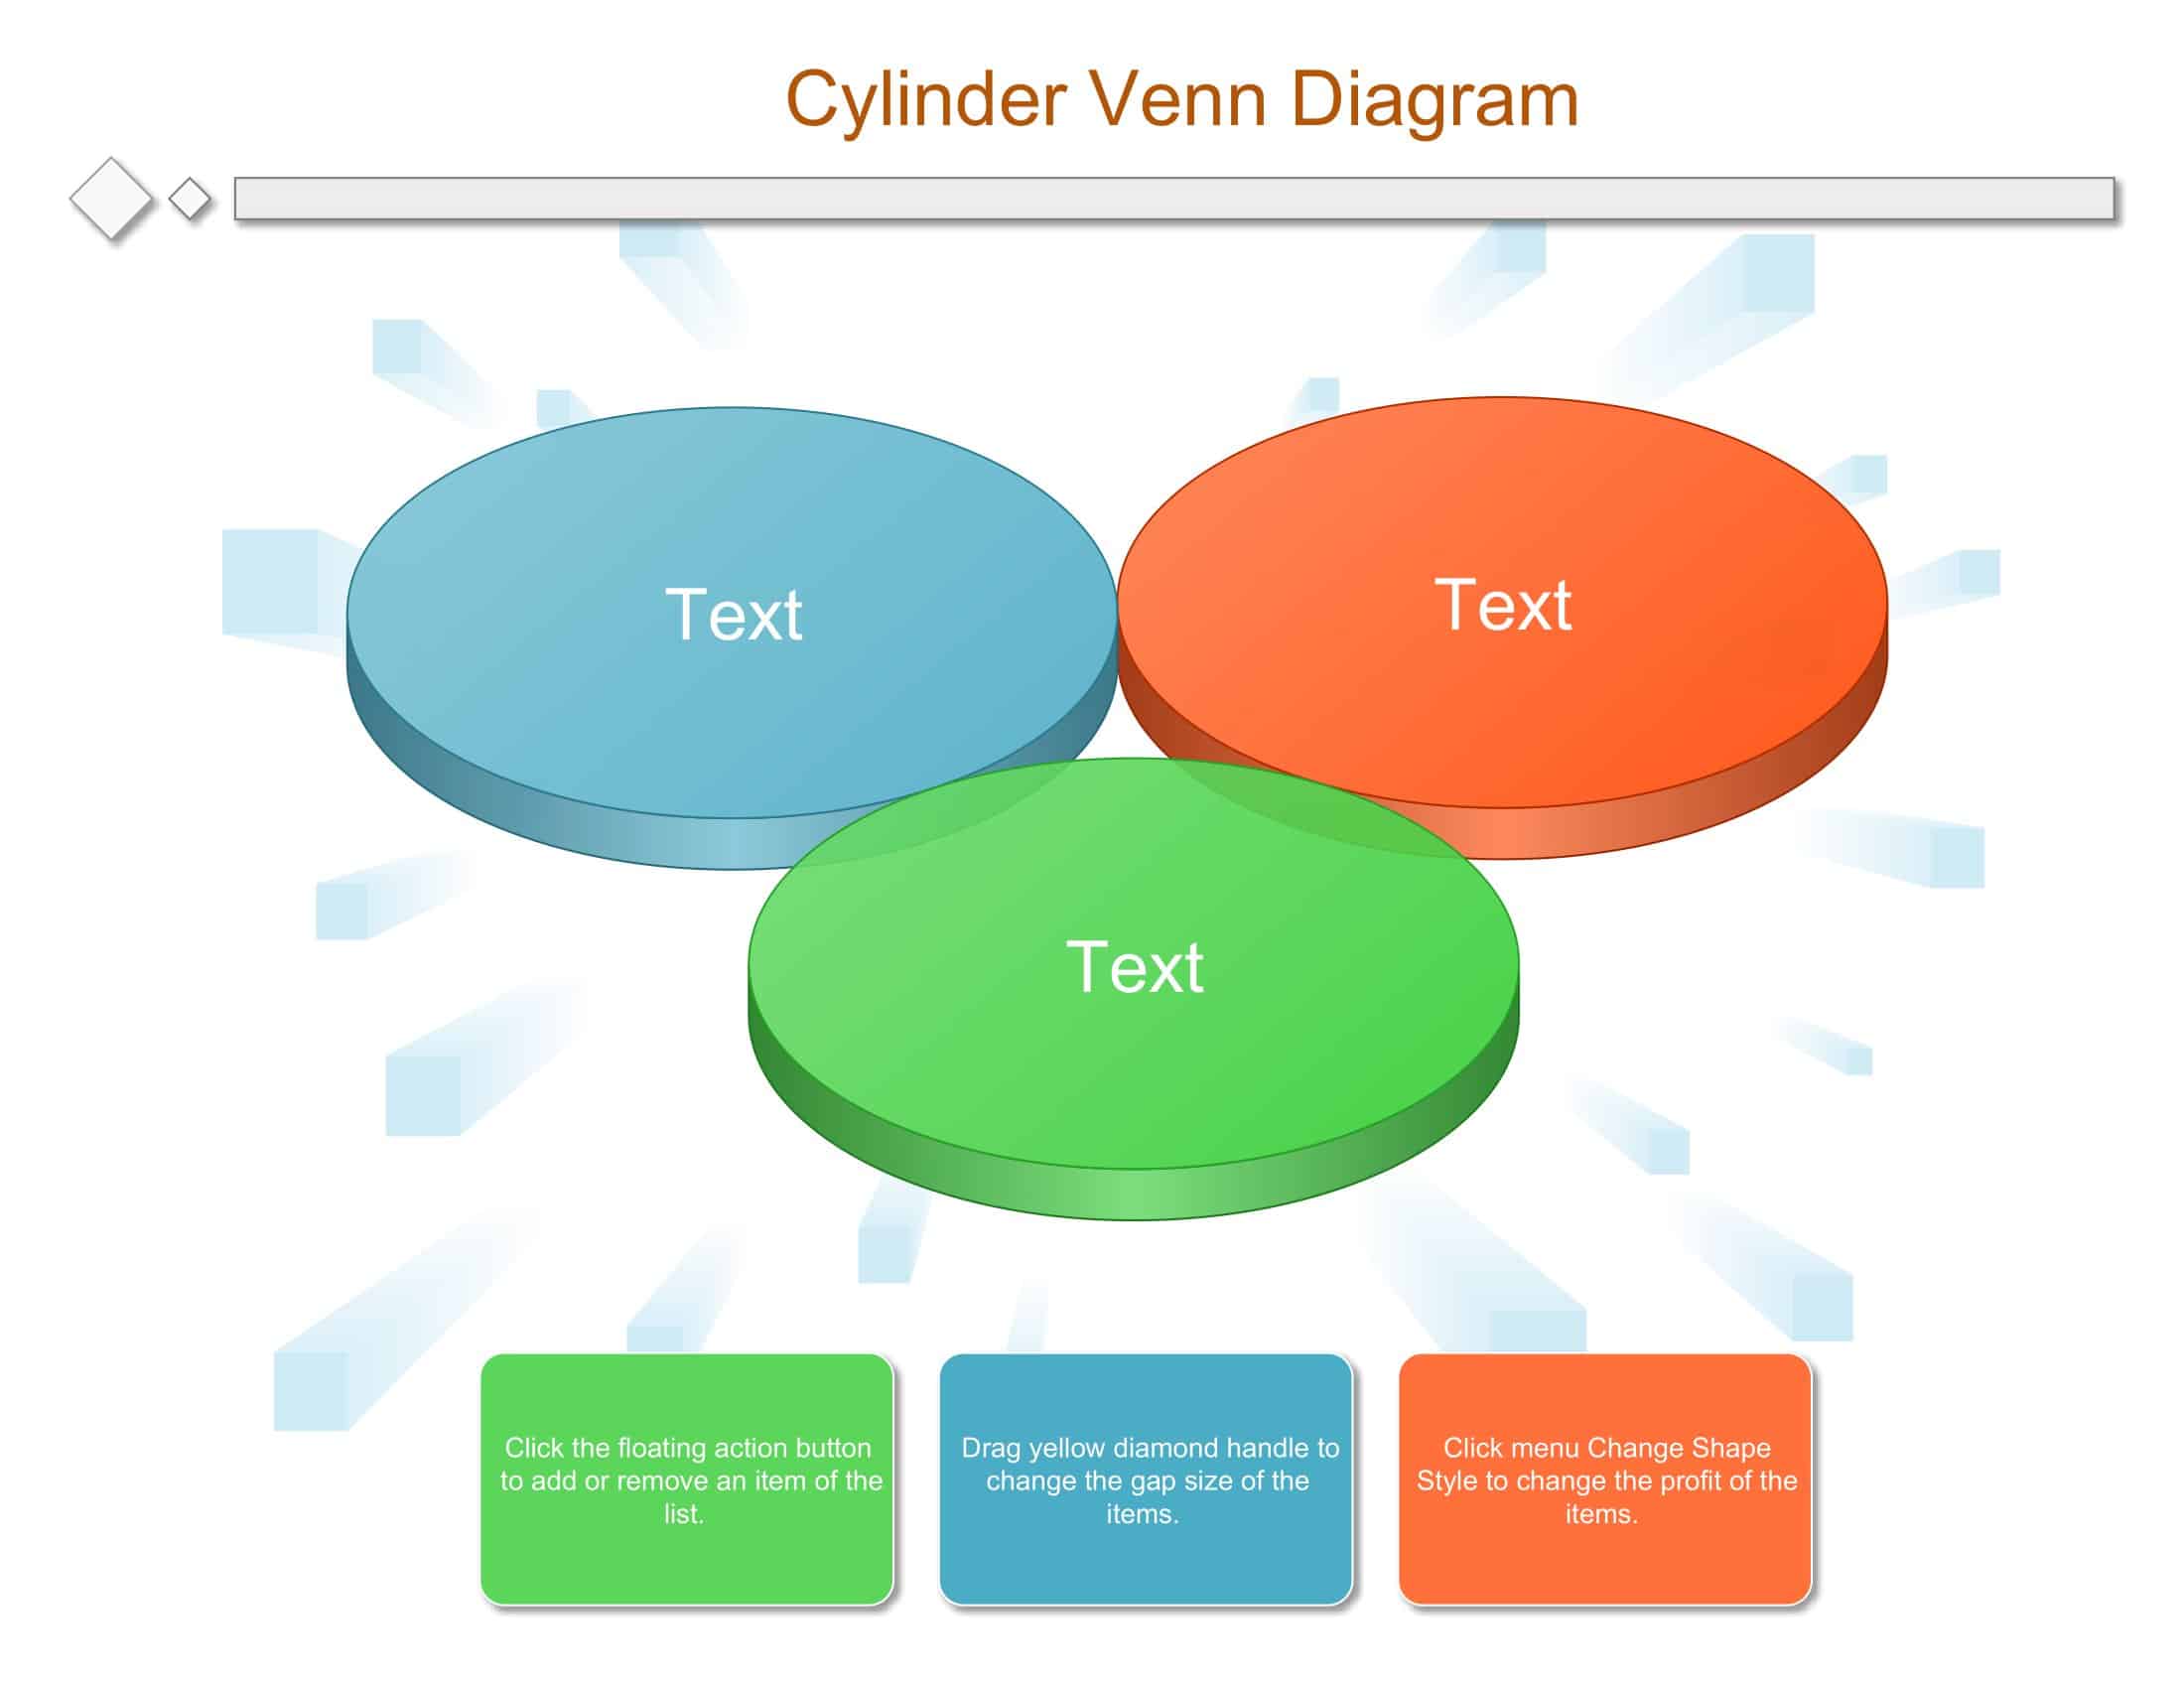
Based on the principle of “one template is not the cure for every job”, TypeCalendar has designed 58 Venn Diagram Templates and listed them for download one by one. A wide range has been created, from basic two-ring models to five-ring multi variable designs, from current pastel-toned styles to black and white prototype focused drawings. Thus, instead of wasting time downloading a single file and changing the colors, you focus directly on the content by choosing the exact number of clusters and aesthetic language you need.
Free Printable Venn Diagram Templates
File Formats and Quick Editing
Every template comes print-ready as PDF and PNG; you can open it in the browser and print it in minutes. If you want to adapt the design to your company colors, you can change the border lines, fill colors and fonts in one click in Illustrator or Inkscape thanks to the layered SVG version. For presentations, the PPTX/Google Slides files are not formatted; as soon as you enlarge the title boxes, alignment guides come into play and the text patterns are automatically centered.
Who’s It For and When to Use It
- Marketing and Product Teams: Show the intersection of target audience, product function and competition on a single slide, shortening the strategy meeting.
- Academics & Students: Boost presentation scores by turning shared elements of complex concepts into visuals.
- Consultants & Analysts: Distill multi-data market maps so the report’s key page pops.
- Design Sprints & Workshops: Visualize conflicting idea sets during brainstorming and speed prototype decisions.
Getting Started Quickly
Choose the template that suits your needs, open the file, type your titles into the clusters; it takes just a few seconds to update the color palette according to your brand guide. Then print the output or drag and drop it on your slide. The 58 template Venn diagram collection keeps visuals clear, readable, and fast never left to chance. Spend the time you once used to explain overlaps on discussing the data instead.





















![Free Printable Roommate Agreement Templates [Word, PDF] 1 Roommate Agreement](https://www.typecalendar.com/wp-content/uploads/2023/06/Roommate-Agreement-150x150.jpg)
![Free Printable Credit Card Authorization Form Templates [PDF, Word, Excel] 2 Credit Card Authorization Form](https://www.typecalendar.com/wp-content/uploads/2023/06/Credit-Card-Authorization-Form-150x150.jpg)
![Free Printable Stock Ledger Templates [Excel,PDF, Word] 3 Stock Ledger](https://www.typecalendar.com/wp-content/uploads/2023/08/Stock-Ledger-150x150.jpg)
